
Abstract
Metformin activates both PRKA and SIRT1. Furthermore, autophagy is induced by either the PRKA-MTOR-ULK1 or SIRT1-FOXO signaling pathways. We aimed to elucidate the mechanism by which metformin alleviates hepatosteatosis by examining the molecular interplay between SIRT1, PRKA, and autophagy. ob/ob mice were divided into 3 groups: one with ad libitum feeding of a standard chow diet, one with 300 mg/kg intraperitoneal metformin injections, and one with 3 g/d caloric restriction (CR) for a period of 4 wk. Primary hepatocytes or HepG2 cells were treated with oleic acid (OA) plus high glucose in the absence or presence of metformin. Both CR and metformin significantly improved body weight and glucose homeostasis, along with hepatic steatosis, in ob/ob mice. Furthermore, CR and metformin both upregulated SIRT1 expression and also stimulated autophagy induction and flux in vivo. Metformin also prevented OA with high glucose-induced suppression of both SIRT1 expression and SIRT1-dependent activation of autophagy machinery, thereby alleviating intracellular lipid accumulation in vitro. Interestingly, metformin treatment upregulated SIRT1 expression and activated PRKA even after siRNA-mediated knockdown of PRKAA1/2 and SIRT1, respectively. Taken together, these results suggest that metformin alleviates hepatic steatosis through PRKA-independent, SIRT1-mediated effects on the autophagy machinery.
Abbreviations:
- 3MA, 3-methyladenine
- CQ, chloroquine
- CR, caloric restriction
- GOT1/AST, glutamic-oxaloacetic transaminase 1, soluble
- GPT/ALT, glutamic-pyruvate transaminase (alanine aminotransferase)
- IPGTTs, intraperitoneal glucose tolerance tests
- Met, metformin
- MTOR, mechanistic target of rapamycin
- NAFLD, nonalcoholic fatty liver disease
- OA, oleic acid
- ORO, Oil Red O
- PRKA, protein kinase, AMP-activated
- siRNA, short interfering RNA
- SIRT1, sirtuin 1
- T-CHO, total cholesterol
- TG, triglyceride
Introduction
Efforts for treating nonalcoholic fatty liver disease (NAFLD) have traditionally focused on burning excess energy and unloading caloric burdens, on either the individual or cellular level. To achieve the aims of increasing energy expenditure and mimicking caloric restriction (CR) in the treatment of metabolic disease, a thorough understanding of the molecular machinery involved in these processes is required. Understanding how this molecular machinery is dysregulated or dysfunctional in NAFLD is also crucial. Although metformin is the first-line antidiabetic drug, particularly for overweight and obese people and those with normal kidney function, the idea that metformin exerts pleiotropic effects via novel mechanisms of action is now gaining popularity.Citation1,2 In this regard, the mechanism by which metformin alleviates hepatosteatosis and the effects of metformin on autophagy are 2 current areas of debate and investigation.
The traditional pathways of autophagy induction are either through PRKA (protein kinase, AMP-activated)-MTOR-ULK1 mediated signaling, activated by an increase in the AMP/ATP ratio, or the sirtuin class of histone/protein deacetylases (SIRT1)-FOXO pathway, activated by increased NAD+.Citation3,4 In addition, metformin is well-established to activate both PRKA and the NAD+-dependent deacetylase SIRT1.Citation5 Based on these reports, we aimed to elucidate the mechanism by which metformin alleviates NAFLD by investigating the molecular interplay between PRKA, SIRT1, and autophagy.
Results
Metformin and caloric restriction decrease body weight and blood glucose in ob/ob mice
To confirm the reported beneficial metabolic phenotypes of metformin treatment and CR in vivo, body weight and gluco-metabolic parameters were assessed in C57bl/6j control and ob/ob mice through weekly fasted blood glucose measurements and intraperitoneal glucose tolerance tests (IPGTTs). The ob/ob mouse, an animal model of obesity and type 2 diabetes, eats excessively and expresses mutation in the gene encoding LEP/leptin, which is important in the control of appetite. Despite increased levels of insulin, ob/ob mice develop high blood glucose.Citation6 Whole body weights of ob/ob mice treated with 3 g/d CR (p < 0.001 at 1, 2, 3, and 4 wk) and 300 mg/kg metformin (p < 0.01 at 1 and 2 wk, p < 0.05 at 4 wk) were significantly lower than those fed ad libitum (). Except for ob/ob mice treated with CR (all p < 0.001), food intakes were not different among ob/ob mice (). As shown in , blood glucose levels in the fasting condition were significantly decreased throughout the entire experiment by metformin treatment (p < 0.05 at 1 wk; p < 0.01 at 2, 3 wk; p < 0.001 at 4 wk) and CR treatment (p < 0.001) compared with ad libitum-fed mice, whose blood glucose levels ranged from 300 to 400 mg/dL at 2 wk post-ad libitum. To investigate the effect of metformin treatment and CR on glucose tolerance, we performed 2 g/kg body weight IPGTTs at 3 wk (). Compared to ad libitum-fed mice, tolerances to glucose loading were significantly improved in CR-treated mice at all-time points tested (p < 0.001) and in metformin-treated mice at 60, 90, and 120 min (p < 0.05, p < 0.01, and p < 0.01, respectively).
Figure 1. Metabolic effects of metformin and caloric restriction on ob/ob mice. The effects of metformin and CR on body weight (A), food intake (B), and blood glucose (C) in the 8-wk-old C57bl/6j control (○) and ob/ob mice were evaluated. The latter mice were classified into 3 groups: ad libitum feeding of chow diets (▴), 300 mg/kg intraperitoneal metformin (▵), and 3 g/d CR (Ø). During a 4-wk treatment course of either metformin or CR, body weight significantly decreased compared to ad libitum-fed ob/ob mice (A). Due to the protocol of this study, food intake was only reduced in calorie-restricted mice. Blood glucose levels were significantly decreased throughout the entire 4 wk in ob/ob mice treated either with metformin or CR, compared to ad libitum-fed ob/ob mice (C). At 3 wk, glucose tolerance tests were performed after an intraperitoneal injection of glucose (2 g/g body weight, D). Blood was collected from the tail vein, and glucose concentrations were measured at 0, 15, 30, 60, 90, and 120 min. CR significantly improved glucose tolerance throughout the IPGTTs, but metformin only significantly improved glucose tolerance at 60, 90, and 120 min. Values displayed are means ± SEM of 8 mice per group.***P < 0.001, CR vs. ad libitum-fed ob/ob mice;`P < 0.05,††P < 0.01, and†††P < 0.001, metformin vs. ad libitum-fed ob/ob mice.
Metformin and caloric restriction alleviate liver dysfunction and hepatic lipid accumulation in ob/ob mice
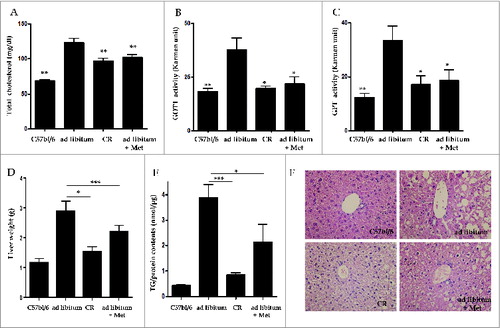
To examine whether metformin and CR alleviated hepatic fat accumulation in vivo, serum levels for total cholesterol (T-CHO), GOT1/AST (glutamic-oxaloacetic transaminase 1, soluble), and GPT/ALT, (glutamic-pyruvate transaminase [alanine aminotransferase]), as well as triglyceride (TG) contents and hepatic histology were evaluated in C57bl/6j control and ob/ob mice. Serum levels of T-CHO were significantly reduced in both the CR- (97.3 ± 10.4, p < 0.01) and metformin-treated groups (101.9 ± 8.9, p < 0.01) compared to the ad libitum-fed group (122.8 ± 15.6 mg/dL, ). The elevated GOT1 and GPT serum levels of the ad libitum-fed group (37.74 ± 5.49 and 33.53 ± 5.15, respectively) were significantly lowered by treatment with CR (19.54 ± 1.28 and 17.09 ± 3.26, both p < 0.05) and metformin (21.95 ± 3.07 and 18.74 ± 3.82, both p < 0.05, respectively; ). As shown in , liver weights adjusted by body weights in the CR- (1.53 ± 0.15 g, p < 0.05) and metformin-treated groups (2.20 ± 0.16 g, p < 0.001) were significantly lower than those in the ad libitum-fed group (2.88 ± 0.35 g). Compared to the ad libitum-fed mice (3.89 ± 0.49 TG/protein nm/μg), CR- (0.85 ± 0.06, p < 0.001) and metformin-treated mice (2.13 ± 0.70, p < 0.05) showed a significant decrease in hepatic TG contents as assessed by a Quantification Colorimetric Kit (). Liver sections were also stained with hematoxylin and eosin (H&E,×40) to visualize lipid accumulation under all treatment conditions. Extensive macrovesicular steatosis surrounding the perisinusoidal areas was present in ad libitum-fed ob/ob mice. However, visible decreases in the accumulation of intracellular lipid droplets were observed in ob/ob mice upon treatment with both metformin and CR ().
Figure 2. Hepatic effects of metformin and caloric restriction on ob/ob mice. Serum chemistry values (A-C), as well as TG contents and hepatic histology (D-F), were evaluated after 4 wk of metformin administration or CR. Levels of T-CHO, as well as GOT1 and GPT activity, were significantly decreased in ob/ob mice treated with metformin or CR compared to ad libitum-fed ob/ob mice (A-C). Mice treated with either metformin or CR also showed a significant decrease both in liver weights adjusted by body weights (D) and also in hepatic fat accumulation (E) compared to ad libitum-fed ob/ob mice. Staining of liver sections with H&E (× 40) revealed extensive macrovesicular steatosis around the perisinusoidal area in ad libitum-fed ob/ob mice (F). Values displayed are means ± SEM of 8 mice per group. Asterisks (*P < 0.05,**P < 0.01,***P < 0.001) indicate significant differences compared to ad libitum-fed ob/ob mice.
Metformin reduces oleic acid-induced lipid accumulation in hepatocytes in vitro
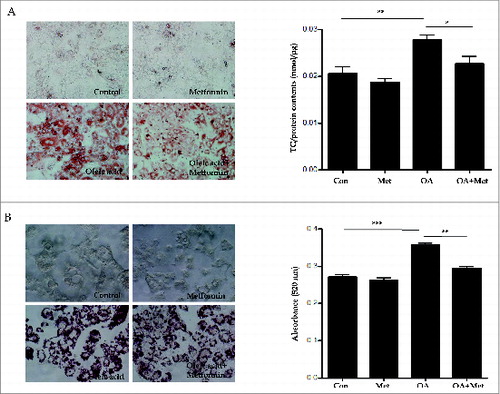
To confirm the lipid clearance effects of metformin on primary mouse hepatocytes in vitro, we stained lipid droplets with Oil Red O (ORO) and quantified them with an ELISA kit (); furthermore, we also quantified TGs in HepG2 cells via spectrophotometry (). As shown in , treatment with 2 mM OA for primary hepatocytes (0.021 ± 0.004 vs. 0.028 ± 0.002, p < 0.01) and 1 mM OA for HepG2 cells (0.27 ± 0.01 vs. 0.36 ± 0.005, p < 0.001) significantly increased intracellular lipid accumulation in the presence of 30 mM glucose for 8 h. However, pretreatment with 0.5 mM metformin significantly attenuated OA-induced lipid accumulation in both primary mouse hepatocytes (0.028 ± 0.002 vs. 0.022 ± 0.004, p < 0.05) and HepG2 cells (0.36 ± 0.005 vs. 0.29 ± 0.01, p < 0.01).
Figure 3. Metformin reduces oleic acid-induced lipid accumulation in hepatocytes in vitro. Treatment with OA (2.0 mM for primary hepatocytes, 1.0 mM for HepG2 cells) in combination with 30 mM glucose for 8 h significantly increased intracellular lipid accumulation. In contrast, pretreatment with 0.5 mM metformin for 2 h before OA exposure significantly reduced OA-induced lipid accumulation in both primary hepatocytes (A) and HepG2 cells (B), as assessed by visualization and quantification of ORO staining (× 40). Values displayed are means ± SEM of 8 independent experiments. Asterisks (*P < 0.05,**P < 0.01,***P < 0.001) indicate significant differences.
SIRT1 expression and induction of autophagy are suppressed in type 2 diabetic ob/ob mice, but are ameliorated by metformin
SIRT1 regulates autophagy by deacetylating autophagy machinery, including the autophagic players ATG5, ATG7, and LC3. To test the hypothesis that hepatic SIRT1 expression and autophagy induction are suppressed in type 2 diabetes, and that restoration of SIRT1 expression and autophagy induction can be achieved by treatment with metformin and CR in the ob/ob mouse model of type 2 diabetes, SIRT1 and autophagy induction were evaluated in this model. Compared to C57bl/6j mice, downregulated hepatic expression of SIRT1 protein as well as mRNA and SIRT1 activity were observed in C57bl/6j background ob/ob mice, while SIRT1 expression and activity were restored in ob/ob mice treated with a 4-wk course of CR or metformin (). With respect to autophagy, LC3-I to LC3-II conversion were significantly increased, while expression of SQSTM1 was decreased in ob/ob mice treated with a 4-wk course of CR or metformin compared to those fed ad libitum ().
Figure 4. SIRT1 expression and autophagy induction are decreased in ob/ob mice. Immunoblots, SIRT1 activity assay, and real-time PCR and immunohistochemistry for SIRT1 were performed in mice liver tissues (A). Hepatic expression and activity of SIRT1 and induction of autophagy were significantly decreased in ad libitum-fed ob/ob mice, compared to C57bl/6j control mice. Furthermore, a 4-wk treatment course of either metformin or CR significantly restored the expression and activity of SIRT1 and induction of autophagy in ob/ob mice. Expression of LC3 and SQSTM1 was shown as a densitometric graph of the optical density-based data of immunoblots (B). LC3 immunoblots were conducted in liver tissues from 4 experimental groups to analyze autophagy flux in vivo using a leupeptin-based assay (C). Autophagy flux was expressed as the subtraction of the amount of LC3-II in the absence of leupeptin from the amount of LC3-II in the presence of leupeptin for each of the conditions, which is defined as “LC3 net flux” and graphically displayed (C, right graph). Autophagosomes (red arrows) and autolysosomes (white arrows) were shown in the electron microscopy images from ad libitum-fed ob/ob mice and ob/ob mice treated with CR or metformin (D). Scale bars are indicated. The numbers of autophagic vacuoles (autophagosomes and autolysosomes) per cell (n = 20) were counted and graphically displayed (D, right graph). Values displayed are means ± SEM of at least 5 independent experiments. Asterisks (*P < 0.05,**P < 0.01 and***P < 0.001) indicate significant differences.
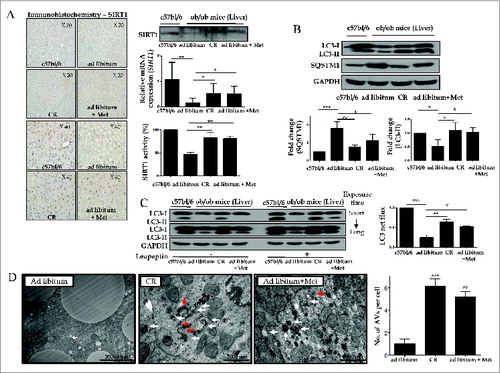
To verify autophagic flux under the in vivo condition, leupeptin was administrated into each mouse before sacrifice and the rate of LC3-II accumulation after leupeptin injection was calculated from immunoblots (). Consistent with in vitro findings, this leupeptin-based assay demonstrated that leupeptin treatment significantly increased the amount of LC3-II accumulation (designated as LC3 net flux) in ob/ob mice treated with CR or metformin compared to ad libitum-fed mice.
Furthermore, autophagosomes and autolysosomes were determined in the liver tissue of each group using an electron microscope to support the evidence of autophagy induction (). Hepatocytes in ob/ob mice treated with a 4-wk course of CR or metformin had a significantly increased number of autophagic vacuoles compared with those fed ad libitum.
Oleic acid suppresses hepatic expression of SIRT1 and autophagy induction, but metformin restores SIRT1 expression and activates the autophagy machinery
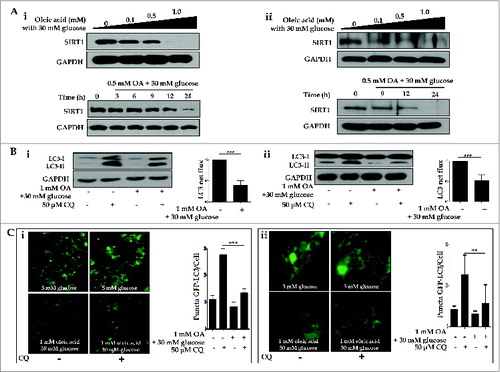
To test the possible mechanisms by which a dysfunctional autophagic pathway results in lipid accumulation, and functional autophagy mediates lipid clearance, the integrity of the autophagy machinery was assessed on several levels. First, we demonstrated OA-induced suppression of SIRT1 in both a dose- (0, 0.1, 0.5, 1.0 mM) and time- (0, 3, 6, 9, 12, 24 h) dependent manner in both HepG2 cells and primary hepatocytes (). Second, we employed multiple techniques to demonstrate OA-induced dysfunctional autophagy in vitro. Dysfunctional autophagy was first validated with autophagic flux assays; as shown in , 1.0 mM OA in the presence of 30 mM glucose suppressed conversion of LC3-I to LC3-II (designated as LC3 net flux), compared to the control group. Next, we employed fluorescence confocal microscopy to visualize autophagosome formation. HepG2 cells and primary hepatocytes ectopically expressing GFP-LC3 exhibited a decrease in the number of punctate GFP-LC3 structures upon exposure to 1.0 mM OA, either in the presence or absence of 50 μM chloroquine (CQ; ).
Figure 5. Oleic acid downregulates hepatic expression of SIRT1 and suppresses autophagy machinery. HepG2 cells and primary hepatocytes exposed to OA in combination with 30 mM glucose exhibited decreased levels of SIRT1, as assessed by immunoblots, in a dose- (0, 0.1, 0.5 and 1.0 mM OA) and time- (0, 3, 6, 9, 12, and 24 h) dependent manner (Ai and Aii designated as HepG2 cells and primary hepatocytes, respectively). Furthermore, treatment with the lysosomal inhibitor CQ (50 μM) in combination with 1.0 mM OA and 30 mM glucose decreased LC3-II conversion, whereas CQ alone upregulated LC3-II levels in LC3 immunoblot flux assays (Bi and Bii). Autophagy flux was expressed as the subtraction of the amount of LC3-II in the absence of CQ from the amount of LC3-II in the presence of CQ for each of the conditions, which is defined as “LC3 net flux” and graphically displayed. Fluorescence confocal microscopy was used to monitor the vesicle formation step of autophagy and autophagosome-lysosome fusion in the absence or presence of 50 μM CQ (Ci and Cii). The number of GFP-LC3 puncta was quantified and plotted. Punctate patterns of the autophagic marker GFP-LC3 were decreased in response to autophagic inhibition by 1.0 mM OA. Asterisks (**P < 0.01 and***P < 0.001) indicate significant differences.
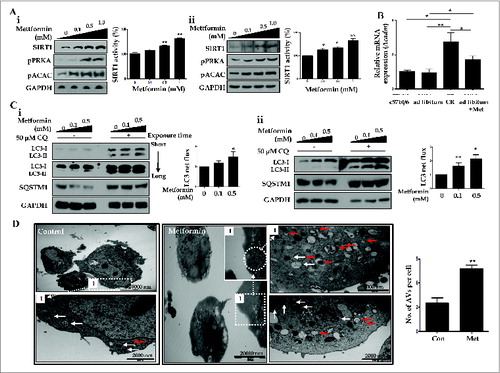
Then, we examined metformin-induced upregulation of SIRT1 expression and autophagy induction in vitro. As shown in , HepG2 cells and primary hepatocytes exposed to different concentrations of metformin (0, 0.1, 0.5, 1.0 mM) showed significantly increased activity and expression of SIRT1, in a dose-dependent manner. Metformin also upregulated the expression of phosphorylated PRKA (pPRKA) and pACAC (phosphorylated acetyl-CoA carboxylase) in a dose-dependent manner (). Consistent with these findings in vitro, both metformin and CR significantly induced mRNA expression of the gene encoding ACADM (acyl-CoA dehydrogenase, C-4 to C-12 straight chain), one of the key enzymes in the β-oxidation pathwayCitation7 in liver tissues compared with those fed ad libitum (). In autophagy flux assays, increased conversion of LC3-I to LC3-II and reduction of SQSTM1 expression were observed in both metformin-treated HepG2 cells and primary hepatocytes (). This increase in LC3 net flux and decrease in SQSTM1 expression occurred in a dose-dependent manner. In addition, electron microscopy analysis showed that the numbers of autophagosomes and autolysosomes were significantly increased after metformin treatment in hepatocytes ().
Figure 6. Metformin upregulates SIRT1 and stimulates induction of autophagy. Metformin upregulated the expression and activity of SIRT1, phosphorylated PRKA (pPRKA), and phosphorylated ACAC (pACAC) in a dose-dependent manner, as shown by immunoblots from HepG2 cells and primary hepatocytes (Ai and Aii, respectively). Asterisks (*P < 0.05 and**P < 0.01) indicate significant differences compared to the no-metformin control. Real-time RT-PCR of Acadm (acyl-CoA dehydrogenase, C-4 to C-12 straight chain) expression in mouse livers (B) showed that CR and metformin treatment significantly increased the level of Acadm. In LC3 flux assays, metformin increased LC3-II expression in a dose-dependent manner (0, 0.1, and 0.5 mM), and CQ (50 μM) upregulated LC3-II conversion in HepG2 cells and primary hepatocytes, as assessed by immunoblots (Ci and Cii). Autophagy flux was expressed as the subtraction of the amount of LC3-II in the absence of CQ from the amount of LC3-II in the presence of CQ for each of the conditions, which is defined as “LC3 net flux” and graphically displayed. Expression of SQSTM1 was decreased in metformin-treated cells in a dose-dependent manner, while it increased after addition of CQ (50 μM). In transmission electron microscopy images (D), the number of autophagosomes (red arrows) and autolysosomes (white arrows) were significantly increased in primary hepatocytes treated with metformin compared with controls. Scale bars are indicated. The numbers of autophagic vacuoles (autophagosomes and autolysosomes) per cell (n = 20) were counted and graphically displayed (D, right graph).
Furthermore, pretreatment with 0.5 mM metformin prevented OA-induced suppression of SIRT1 expression and LC3-II conversion (). An autophagic flux assay using CQ showed that the conversion of LC3-I to LC3-II was blocked in OA-treated hepatocytes, but was restored after metformin treatment. In addition, increased expression of SQSTM1 by OA was significantly reduced after metformin pretreatment. To test the hypothesis that metformin reduces lipid accumulation by inducing autophagy, we inhibited the induction of autophagy with either siRNA directed against ATG5, or a pharmacological inhibitor of autophagy, 3-methyladenine (3MA). Intracellular lipid accumulation in HepG2 cells and primary mouse hepatocytes was analyzed by using a spectrophotometer at 520 nm and a colorimetric quantification kit, respectively (). While 1.0 mM OA significantly increased the lipid contents of HepG2 cells (0.17 ± 0.003 vs. 0.37 ± 0.01, P < 0.001), 0.5 mM metformin significantly decreased intracellular fat loading (0.37 ± 0.01 vs. 0.34 ± 0.01, P < 0.05). However, after siRNA-mediated knockdown of ATG5, metformin no longer attenuated OA-induced lipid accumulation (0.39 ± 0.01 vs. 0.37 ± 0.003, p = 0.15; ). Similarly, metformin was also unable to attenuate OA-induced lipid accumulation in the presence of 5 mM 3MA in both HepG2 cells (0.11 ±0.003 vs. 0.12 ± 0.002, p = 0.08; ) and primary mouse hepatocytes (0.029 ± 0.001 vs. 0.03 ± 0.001, p = 0.61; ).
Figure 7. Metformin reduced OA-induced lipids by autophagy induction. Metformin also inhibited OA-induced downregulation of SIRT1 expression and autophagy induction (A). HepG2 cells (Ai) and primary hepatocytes (Aii) exposed to 1.0 mM OA showed a significant decrease in SIRT1 expression and autophagy induction, whereas pretreatment with 0.5 mM metformin significantly reduced OA-induced autophagy dysfunction. Expression of indicated proteins was shown as a densitometric graph of the optical density-based data of immunoblots. Furthermore, LC3 immunoblot flux assays showed that treatment with the lysosomal inhibitor CQ (50 μM) in combination with 1.0 mM OA alone decreased LC3-II conversion, whereas treatment with 0.5 mM metformin in the presence of CQ increased LC3-II expression in both HepG2 cells and primary hepatocytes regardless of OA. Autophagy flux was expressed as the subtraction of the amount of LC3-II in the absence of CQ from the amount of LC3-II in the presence of CQ for each of the conditions, which is defined as “LC3 net flux” and graphically displayed. Lipid accumulation was determined by fat quantification in the presence or absence of the autophagic inhibitor 3MA, and also after siRNA-mediated knockdown of ATG5. OA-treated primary mouse hepatocytes and HepG2 cells exhibited a significant increase in lipid accumulation. However, treatment with 0.5 mM metformin significantly decreased the OA-induced intracellular lipid accumulation (B-D). Furthermore, the lipid contents of both HepG2 cells transfected with siRNA against ATG5 (B) and HepG2 cells (C) or primary hepatocytes (D) treated with 5 mM 3MA in the presence of metformin and OA were similar to those of cells treated with OA alone. Values displayed are means ± SEM of 5 independent experiments. Asterisks (*P < 0.05,**P < 0.01 and***P < 0.001) indicate significant differences.
Metformin activates SIRT1 expression through a PRKA-independent pathway
To determine whether metformin induced SIRT1 expression through a PRKA-independent pathway, siRNAs directed against PRKAA1/2 or SIRT1 were transfected into HepG2 cells. Metformin upregulated SIRT1 activity as well as its expression, regardless of PRKA expression levels (). With respect to autophagy, metformin significantly increased the level of LC3-II, while it decreased SQSTM1 expression in both PRKA-sufficient and -deficient conditions. In , metformin treatment significantly reduced lipid accumulation in OA-treated HepG2 cells regardless of the presence of PRKA. Interestingly, the amount of lipid was much lower in OA and metformin co-treated cells transfected with control siRNA compared to those with PRKAA1/2 siRNA (0.337 ± 0.01 vs. 0.359 ± 0.005, P < 0.05). After transfection with siRNA against SIRT1, SIRT1 knockdown did not interfere with metformin-induced phosphorylation of PRKA ().
Figure 8. Metformin upregulates SIRT1 expression through a PRKA-independent pathway. HepG2 cells were transfected with siRNA against PRKAA1/2 or a scrambled siRNA control. Densitometric graphs of the optical density-based data of immunoblots (A) showed that SIRT1 expression and activity were significantly upregulated after metformin treatment in HepG2 cells regardless of PRKA expression levels. Metformin also decreased SQSTM1 expression while it increased LC3-II levels in both control and PRKAA1/2 siRNA-treated cells. Oil Red O staining and spectrophotometer analysis of HepG2 cells transfected with either siRNA against PRKAA1/2 or scrambled siRNA control demonstrated that metformin significantly decreased lipid accumulation in cells treated with OA (B). HepG2 cells were then transfected with siRNA against SIRT1, and a scrambled siRNA control, showing that the ratio of pPRKA and PRKA expression was increased upon treatment with metformin regardless of SIRT1 levels (C). Values displayed are means ± SEM of 3 to 6 independent experiments. Asterisks (*P < 0.05,**P < 0.01 and***P < 0.001) indicate significant differences.
SIRT1 attenuates lipid accumulation in hepatocytes through SIRT1-mediated autophagy induction
To confirm that SIRT1-mediated autophagy induction was responsible for hepatic lipid clearance, either a vector driving SIRT1 overexpression or siRNA directed against SIRT1 were transfected into HepG2 cells. As shown in , the SIRT1 vector increased SIRT1 expression, decreased SQSTM1 levels and promoted subsequent conversion of LC3-II, whereas SIRT1 siRNA downregulated SIRT1 expression, increased SQSTM1 levels and decreased the conversion of LC3-II. OA-induced lipid accumulation was significantly alleviated by transfecting the SIRT1 vector into both HepG2 cells (0.019 ± 0.0007 vs. 0.015 ± 0.0005, p < 0.05; ) and primary hepatocytes (0.011 ± 0.001 vs. 0.008 ± 0.0005, p < 0.05; ). To elucidate whether hepatic lipid clearance required the SIRT1-mediated autophagy pathway, we disrupted this pathway through both siRNA knockdown of SIRT1 expression and the pharmacological inhibitor 3MA. Intracellular lipid accumulation in HepG2 cells and primary mouse hepatocytes were analyzed using a spectrophotometer at 520 nm and a colorimetric quantification kit, respectively. While 2 mM OA significantly increased the lipid contents in HepG2 cells (0.28 ± 0.007 vs. 0.4 ± 0.02, p < 0.05), 0.5 mM metformin significantly decreased this intracellular fat loading (0.4 ± 0.02 vs. 0.35 ± 0.008, p < 0.05). However, upon siRNA-mediated SIRT1 knockdown, metformin was unable to attenuate OA-induced lipid accumulation (0.41 ± 0.007 vs. 0.39 ± 0.008, p = 0.11) in HepG2 cells (). Similarly, after siRNA-mediated SIRT1 knockdown in primary mouse hepatocytes, metformin also did not attenuate 1 mM OA-induced lipid accumulation (0.012 ± 0.0008 vs. 0.01 ± 0.0007, p = 0.54, ). In the absence of 5 mM 3MA, 1 mM OA-induced lipid accumulation was significantly attenuated by overexpression of SIRT1 (0.017 ± 0.0017 vs. 0.012 ± 0.0006, p < 0.05). However, in the presence of 5 mM 3MA, OA-induced lipid accumulation was not alleviated by SIRT1 overexpression (0.017 ± 0.0013 vs. 0.016 ± 0.0011, p = 0.76, ).
Figure 9. SIRT1 attenuates lipid accumulation in hepatocytes through SIRT1-mediated induction of autophagy. Increased protein levels of SIRT1 in HepG2 cells transfected with a SIRT1 vector increased LC3-II conversion, while decreased expression of SQSTM1 was verified by immunoblots (A). Expression ratio of pPRKA/PRKA was also increased in SIRT1 overexpression cells. Furthermore, transfection with siRNA against SIRT1 decreased both SIRT1 protein levels and also conversion of LC3-I to LC3-II (B). Expression of SQSTM1 was significantly increased, while pPRKA levels were not affected. To investigate whether SIRT1 could regulate lipid accumulation in hepatocytes, either a SIRT1 overexpression vector or siRNA directed against SIRT1 were transfected into HepG2 cells and primary mouse hepatocytes. In HepG2 cells (C) and primary hepatocytes (D), OA-induced increases in intracellular TG contents were significantly reduced by SIRT1 overexpression. In accordance with the data presented in , OA-induced intracellular lipid accumulation was significantly alleviated by metformin treatment of control siRNA-treated HepG2 cells (E) and primary hepatocytes (F). In contrast, reduction of lipid contents by metformin was negligible in SIRT1-knockdown cells. Lipid accumulation was also examined in the presence or absence of the autophagic inhibitor 3MA (G). OA-treated HepG2 cells exhibited a significant increase in lipid accumulation. However, SIRT1 overexpression significantly decreased OA-induced intracellular lipid accumulation. Lipid contents of cells treated with 5 mM 3MA and transfected with SIRT1 were similar to those of cells treated with OA alone. Values are displayed as means ± SEM of 8 mice per group. Asterisks (*P < 0.05,**P < 0.01,***P < 0.001) indicate significant differences.
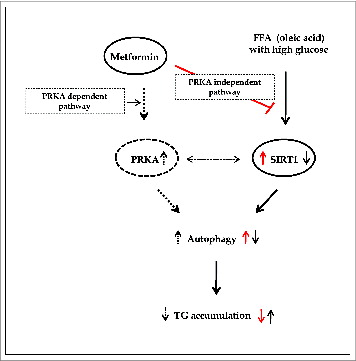
Figure 10. Summary of working thesis of the study. See the text for details.
Discussion
Autophagy facilitates the removal of damaged proteins and aged organelles, thereby maintaining cellular homeostasis. Under conditions of nutrient deprivation, induction of autophagy provides a simple response for cells to reutilize their own constituents for energy.Citation8,9 From a translational point of view, nutritional deprivation through CR causes weight reduction on the individual level, and induces autophagy on the cellular level. Similar to CR, metformin causes weight reduction and induces autophagy through PRKA activation.Citation10,11 Metformin belongs to the biguanide class of drugs and inhibits complex I of the electron transport chain by sequentially lowering the cellular energy charge and then activating PRKA.Citation12,13 In this regard, lifestyle modification through CR and taking metformin are thought to induce autophagy; a promising approach for treating NAFLD.Citation8,14 Based on these reports, we used an animal model to implement CR as a lifestyle modification, and metformin as a drug therapy in both cellular and animal models.
The traditional role of PRKA is to act as a cellular stress and energy sensor, and its activity increases upon glucose deprivation.Citation11 It is also well established that PRKA can cooperate with the fuel/NAD+-dependent sirtuin class of histone/protein deacetylases (SIRTs). SIRT1 has been reported to mediate the beneficial metabolic effects of CR through deacetylation of transcription factors such as PPARG (peroxisome proliferator-activated receptor gamma), PPARA, PPARGC1A (peroxisome proliferator-activated receptor gamma, coactivator1 α) and FOXO (forkhead box O). These transcription factors are involved in diverse processes such as hepatic lipid metabolism, gluconeogenesis, mitochondrial biogenesis, and energy expenditure.Citation15-18 Particularly, liver-specific SIRT1 deletion induces hepatic steatosis and inflammation via impairment of PPARA signaling.Citation18 Conversely, both PRKA and SIRT1 are downregulated in the liver under stress conditions of nutrient excess, including a high-fat diet, obesity, and type 2 diabetes.Citation15,19,20 In addition, SIRT1-deficient mice exhibit a premature aging phenotype and develop fatty livers.Citation18,21,22 Based on these reports, we investigated the molecular interplay between SIRT1, PRKA, and autophagy in response to metformin.
The present study aimed to determine whether metformin alleviates hepatosteatosis through SIRT1-mediated autophagy induction, and whether this mechanism is PRKA-independent. This work had 3 main findings: First, SIRT1 expression and induction of autophagy are significantly downregulated both in the livers of ob/ob mice and also in OA- plus 30 mM glucose-treated hepatic cell lines. Second, both CR and metformin treatment caused weight reduction and alleviated hepatosteatosis and glucose homeostasis in ob/ob mice in association with increasing SIRT1 expression and induction of autophagy. Third, metformin treatment restored SIRT1 expression and, consequently, induction of autophagy, via a PRKA-independent pathway.
Regarding the effects of metformin on hepatosteatosis, definitive evidence that metformin is the treatment option of choice for fatty livers in humans is still lacking. Even taking into account the comorbidities of NAFLD with other diseases such as obesity, glucose intolerance, and dyslipidemia, the primary cause of lipid accumulation in the liver is not yet clear. An increased supply of free fatty acids, de novo hepatogenic lipogenesis, decreased oxidation of free fatty acids, and secretion of hepatic very-low-density lipoprotein-triglycerides have all been implicated in the development of NAFLD.Citation8,23,24 The need to develop a new model of the molecular pathways responsible for NAFLD has generated intense interest in autophagy as a pathway that could be manipulated for the management of NAFLD.Citation8,14 Here, we used the ob/ob mouse model, which mimics type 2 diabetes, to show that these mice exhibited increased body weight, an accumulation of hepatic fat, decreased hepatic levels of SIRT1, and suppressed autophagic machinery when fed ad libitum. However, metformin treatment of these mice caused significant weight reduction and alleviated hepatic lipid accumulation. In vitro experiments with both primary hepatocytes and HepG2 cells were performed with a monounsaturated fatty acid (OA) in the presence of high glucose, which minimizes inflammatory lipogenic effects. In these experiments, metformin decreased intracellular fat contents and activated the autophagy machinery. The activation of the autophagy machinery was demonstrated on several levels, including examining LC3 turnover in the absence or presence of CQ to measure the induction of autophagy, and using fluorescence microscopy to visualize autophagosome formation via GFP-LC3 localization. Most importantly, a leupeptin-based in vivo animal assayCitation25 was applied to assess the dynamics of autophagic flux under the in vivo condition, showing that both metformin and CR induced autophagic flux in the liver of ob/ob mice. However, considering previous reports showing age-related decline in autophagy function in livers,Citation26,27 it is quite possible that metformin may be less able to alleviate hepatic steatosis in elderly human subjects by activation of autophagy.
Regarding the mechanisms by which CR and metformin unload caloric burden, the role of PRKA as a key energy sensor for suppressing lipid accumulation and cell growth is well established. In contrast, the MTOR (mechanistic target of rapamycin) signaling pathway has been proposed to have an opposing role to PRKA with respect to protein synthesis, cell growth, and cell division.Citation28 Inhibition of MTOR induces autophagy, a process which plays a homeostatic role not only by breaking and removing cellular components, but also by decreasing cellular stores of TGs, as demonstrated in this study in hepatocytes. Under low-nutrient conditions, increased PRKA activity controls the induction of autophagy by activating either the MTOR-ULK1 or the SIRT1-FOXO signaling pathway.Citation3,4 In addition, metformin activates both PRKA and SIRT1 through a PRKA-mediated increase in gene expression of NAMPT (nicotinamide phosphoribosyltransferase), the rate-limiting enzyme of the salvage pathway for NAD+.Citation5 In this study, we tested whether SIRT1 regulates the autophagic machinery, and whether this regulation required PRKA activation; to this end, we used siRNA to manipulate cellular levels of both SIRT1 and PRKAA1/2. We observed that both SIRT1 and pPRKA were still upregulated upon treatment with metformin even under PRKAA1/2 and SIRT1 knockdown conditions, respectively. Taken together, we suggest that metformin induces SIRT1 gene expression via a PRKA-independent pathway, thereby resulting in autophagy induction.
The present study has some limitations, which should be addressed by further research. Although it is well known that autophagic activation induces lipophagy, which leads to decreased cellular lipid content, we did not demonstrate direct evidence of lipophagy as a link between increased autophagic flux by metformin and reduced lipid accumulation in hepatocytes. Moreover, additional experiments with genetically engineered animal models such as liver-specific Atg7- or Sirt1-knockout mice should be conducted in the future to provide a more definitive mechanistic role of metformin.
Regarding autophagy-induced clearance of hepatic fat content, metformin was no longer able to alleviate lipid accumulation either in the presence of an inhibitor of autophagy, 3MA, or upon siRNA-mediated knockdown of ATG5, an important player in the elongation step of autophagosome formation. In addition, overexpression of SIRT1 stimulated induction of autophagy, thereby alleviating the increase in hepatic fat content normally caused by OA. Furthermore, the TG-lowering action of SIRT1 was also abolished by incubation with 3MA. Collectively, these data suggest that metformin-mediated alleviation of increased hepatic fat content involves the autophagy machinery (Fig. 10), a finding that may have implications for the pathogenesis and treatment of hepatosteatosis.
Materials and Methods
Animal procedures
Eight-wk-old ob/ob mice (C57bl/6j background, Jackson Laboratory, 000632) and C57bl/6j control mice (Jackson Laboratory, 000664) were used in this study. ob/ob mice were separated into 3 groups (n = 8) and subjected to the following treatment regimens: 1) ad libitum feeding of chow diets (Dyets Inc..) and vehicle injection of phosphate-buffered saline (PBS, pH 7.8; GIBCO, 10010); 2) ad libitum feeding of chow diets and intraperitoneal injections of 300 mg/kg metformin (Merck KGaA, 317240, n = 8); and 3) CR group (3 g/d, n = 8). Mice were maintained at 60 ± 5% relative humidity and 22 ± 2°C, with a 12-h light/dark cycle. Mouse weight and food intake were measured daily over a 4-wk course of treatment. All experimental procedures performed in this study followed ethical guidelines for animal studies, and were approved by the Institutional Animal Care and Use Committee of Yonsei University College of Medicine (IACUC No. 2011–0302–1).
Leupeptin assay for measuring autophagic flux
Mice were intraperitoneally injected with sterile PBS or PBS containing 25 mg/kg leupeptin hemisulfate (Sigma, L2884). After injection, mice were returned to their cages and provided water without any food for 5 h.Citation24
Metabolic and biochemical analyses
For IPGTTs, 3-wk-old mice were fasted overnight and given an intraperitoneal injection of glucose (2 mg/g body weight; Sigma, G7021). Blood was collected from the tail vein, and glucose concentrations were measured at 0, 15, 30, 60, 90, and 120 min using a handheld glucose meter (SD Code Free, Standard Diagnostics, Inc., 01GC110). After sacrificing the mice at 4 wk, blood was obtained by cardiac puncture, and mouse livers were removed and weighed. Serum levels of GOT1/AST (Asan Pharm Inc., AM101), GPT/ALT (Asan Pharm Inc.., AM101), and T-CHO were quantified using a commercial kit (Asan Pharm Inc., AM202).
Histological analysis
After each animal was sacrificed, fresh tissues were immediately frozen and subsequently placed in prelabeled base molds filled with embedding medium to ensure optimal cutting temperature. Frozen sections (7 μM) were stained with ORO (Sigma, O0625); paraffin-embedded sections were stained with H&E (Dako, CS700, CS701). To evaluate hepatic steatosis, morphometric analysis was performed on 2 randomly selected fields (at 40× magnification) from a section of each animal using an Olympus IX71 microscope equipped with an Olympus DP70 camera (Olympus Optical Company, Tokyo, Japan). Immunohistochemical analysis for the expression of SIRT1 was conducted as previously described.Citation29 After epitope retrieval by heat in citrate, deparaffinized sections were incubated with anti-SIRT1 antibody (Santa Cruz Biotechnology, sc-155464)) for 1 h, rinsed with Tris-buffered saline (Sigma, T5912) containing 0.1% Tween-20 (Sigma, P1379), and incubated with a secondary antibody (Vector Laboratories, Inc., BA-1000). After washing in PBS, sections were detected with the horseradish peroxidase–conjugated anti-biotin labeling solution (Vector Laboratories, Inc., PK-6100). Counterstaining was then performed before examination under a light microscope. The sections were mounted and dehydrated permanently in nonaqueous mounting medium. The slides were photographed at 20× and 40× magnification) using an Olympus IX71 microscope equipped with an Olympus DP70 camera.
Real-time PCR
Total RNA was isolated using TRIZOL reagent (Invitrogen, 15596–018) according to the manufacturer's instructions and subjected to reverse transcription followed by quantitative real-time PCRs using SuperScript III First-strand kit (Invitrogen, 18080–051). cDNA from liver from ob/ob mice was used for real-time PCR with SYBR Green (Takara, RR820) and run on an StepOnePlusTM (Life technologies, 4376357) to detect relative mRNA levels. The sequences of the primers used for mouse samples were: Acadm, forward primer 5′-TGA CGG AGC AGC CAA TGA-3′ and reverse primer 5′-TCG TCA CCC TTC TTC TCT GCT T-3′; Sirt1, forward primer 5-ACC TCC CAG ACC CTC AAG-3′ and reverse primer 5′- TTC CTT CCT TAT CTG ACA AAG C-3′; Sqstm1, forward primer 5′- GCT GCC CTA TAC CCA CAT CT-3′ and reverse primer 5′- CGC CTT CT CCG AGA AAC-3′; ActBb, forward primer 5′- TGG CGC TTT TGA CTC AGG AT -3′ and reverse primer 5′- GGG ATG TTT GCT CCA ACC AA -3′. The sequences of the primers used for HepG2 cells were: SQSTM1, forward primer 5′- CAG GGC TGA AGG AAG CTG C-3′ and reverse primer 5′-AAG CCC ATG GAC AGC ATC TG-3′; ACTB, forward primer 5′- TCA TGA AGT GTG ACG TTG ACA TCC GT -3′ and reverse primer 5′- CCT AGA AGC ATT TGC GGT GCA CGA TG -3′. Quantitative analyses were performed using the ΔΔcycle threshold method and StepOne Software version 2.2.2.
Isolation of primary hepatocytes and cell culture
Primary mouse hepatocytes were prepared according to the 2-step perfusion method as previously describedCitation30 with minor modifications. Livers were digested with Hank's balanced salt solution containing 30 μg/mL of Liberase Blendzyme 3 (Roche, 1814176), 5 mM CaCl2 (Sigma, C1016), 0.1 mg/mL DNaseI (Roche, 10104159001), and 100 mM HEPES (Sigma, H3375) for 5 min. After centrifugation, pellets were resuspended in growth medium consisting of DMEM (Welgene, LM001–05) supplemented with 2.7 mM D-glucose (Sigma, G8270) and 10% fetal bovine serum and subsequently incubated at 37°C in humidified air containing 5% CO2. After determining cell viability via trypan blue exclusion testing, hepatocytes were seeded on collagen-coated 6-well plates (SPL, 50050; 5 × 10⁵/well) and incubated for 24 h prior to all experiments. HepG2 cells were maintained in Dulbecco's modified Eagle's medium (Welgene, LM001–05) supplemented with 10% fetal bovine serum and antibiotics. For pharmacological studies, cells were incubated with either control (5.5 mM) or high-glucose (30 mM) medium in the presence of 1 mM oleic acid (Sigma, O3008) after pretreatment with 0.5 mM metformin for 2 h.
Quantification of lipids by Oil Red O staining and triglyceride assays
Lipid droplets were initially visualized and subsequently quantified by ORO staining. Primary mouse hepatocytes and HepG2 cells were exposed to 2 mM and 1 mM OA, respectively, in the presence of 30 mM glucose after pretreatment with or without 0.5 mM metformin, followed by fixation with 10% formalin for 1 h. Fixed cells were then stained in prewarmed ORO solution (Sigma, O0625) for 1 h in a 60°C water bath, and red-stained lipid droplets were subsequently observed with a light microscope. To quantify lipid accumulation, ORO was eluted with 100% isopropanol and the optical densities of the eluates were measured using a spectrophotometer at 520 nm. TG levels in liver tissue, primary mouse hepatocytes, and HepG2 cells were measured with the Triglycerides Quantification Kit (Biovision, K622) according to the manufacturer's instructions.
Plasmid transfections and SIRT1 activity assays
The plasmid construct driving overexpression of SIRT1 was kindly provided by Professor Hyun-seok Kim (Ewha Womans University, Seoul, Republic of Korea). Transient transfections of plasmid DNA were performed using Lipofectamine 2000 (Invitrogen, 11668–027) according to the manufacturer's protocol. To measure cellular SIRT1 activity, nuclear proteins were extracted from mouse livers, primary hepatocytes, and HepG2 cells using a Nuclear/Cytosol Fractionation Kit (Pierce Biotechnology, 78833). SIRT1 activity was quantified with a SIRT1 Fluorometric Assay Kit (Sigma, CS1040) according to the manufacturer's protocol. Fluorescence intensities were measured with a microplate fluorometer (excitation wavelength = 360 nm, emission wavelength = 450 nm).
RNA interference
Primary hepatocytes and HepG2 cells were transfected with siRNAs targeting ATG5 (Sigma, SASI_Hs01_00173156), SIRT1 (Sigma, SASI_Hs01_00153666), PRKAA1/2 (Santa Cruz Biotechnology, sc-45312), or a control siRNA (Sigma, SIC001) using Lipofectamine 2000 (Invitrogen, 11668–027) by following the manufacturer's instructions. Cells were incubated for 16 h with a transfection mixture containing a final siRNA concentration of 100 pM, and then supplemented with fresh medium.
Immunoblotting and antibodies
Mouse livers, primary hepatocytes, and HepG2 cells were lysed in PRO-PREPTM protein extraction solution (iNtRON Biotechnology, 17081), and the protein contents of the resulting lysates were measured with the Bradford assay (Bio-Rad, 162–0115). Equal amounts of proteins were resolved by SDS-PAGE and electroblotted onto a nitrocellulose membrane (Bio-Rad, 162–0115). Membranes were subsequently probed as indicated with the following primary antibodies: LC3B (Cell Signaling Technology, 2275), PRKA (Cell Signaling Technology, 2603), pPRKA (Cell Signaling Technology, 2535), pACAC (Cell Signaling Technology, 3661), SIRT1 (Santa Cruz Biotechnology, sc-155464) and GAPDH (Santa Cruz Biotechnology, sc-25778).
Detection of autophagy
To monitor autophagy, levels of conversion of the autophagy marker protein MAP1LC3/LC3 (microtubule-associated protein 1 light chain 3)-I to LC3-II were measured by immunoblotting. Detection of autophagosomes was also performed by transfecting HepG2 cells with a plasmid driving the expression of GFP-LC3 (ORIGINE, RC100021). Transfected cells were fixed with 4% paraformaldehyde and then observed with a confocal microscope. Cells were classified as having either a predominantly diffuse GFP stain, or as having numerous punctate structures representing autophagosomes. To assay autophagic flux, LC3 processing either in the presence or absence of 50 μM of the lysosomal alkalinizing agent, CQ (Sigma, C6628), was assayed by immunoblotting. For detection of autophagosomes using electron microscopy, liver tissues of ob/ob mice were fixed with 2% glutaraldehyde-2% paraformaldehyde buffered with 0.1 M phosphate buffer (pH 7.2) overnight at 4°C, post-fixed with 1% osmium tetroxide in a 0.1 M sodium cacodylate buffer (pH 7.4) for 1 h at room temperature, and were dehydrated with a graded series of ethanol as previously described.Citation8 The dehydrated tissues were then embedded in Epon, poly/Bed812 Embedding kit/DMP-30 (Polysciences, 08792–1). Sectioning for electron microscopy examination was accomplished with an ultramicrotome (Leica, EM UC7), and electron microscopy was performed with a JEM-1011 transmission electron microscope (JEOL). Autophagic vacuoles were counted from at least 20 random cells, averaged, and expressed as the number of autophagic vacuoles per cell.
Statistical analysis
Statistical analysis was performed using PRISM (GraphPad Software Inc..). Results are expressed as means ± SE, and statistical significance was calculated using Student t test. Alternatively, for comparisons involving more than 2 groups, one-way analysis of variance (ANOVA) with a post hoc Bonferroni multiple comparison test was used to assess the differences between the groups. Differences in liver weights among 4 mice groups were compared by using analysis of covariance (ANCOVA) with adjustment for body weights. Statistical significance was defined as the conventional P value of < 0.05.
Disclosure of Potential Conflicts of Interest
No potential conflicts of interest were disclosed.
Funding
This research was supported by the Basic Science Research Program through the National Research Foundation of Korea (NRF) funded by the Ministry of Education, Science and Technology (2013R1A1A2004570).
References
- Foretz M, Hebrard S, Leclerc J, Zarrinpashneh E, Soty M, Mithieux G, Sakamoto K, Andreelli F, Viollet B. Metformin inhibits hepatic gluconeogenesis in mice independently of the LKB1AMPK pathway via a decrease in hepatic energy state. J Clin Invest 2010; 120:2355-69; PMID:20577053; http://dx.doi.org/10.1172/JCI40671
- Park HK. Metformin and cancer in type 2 diabetes. Diabetes Metab J 2013; 37:113-6; PMID:23641351; http://dx.doi.org/10.4093/dmj.2013.37.2.113
- Salminen A, Kaarniranta K. AMP-activated protein kinase (AMPK) controls the aging process via an integrated signaling network. Ageing Res Rev 2012; 11:230-41; PMID:22186033; http://dx.doi.org/10.1016/j.arr.2011.12.005
- Pallauf K, Rimbach G. Autophagy, polyphenols and healthy ageing. Ageing Res Rev 2013; 12:237-52; PMID:22504405; http://dx.doi.org/10.1016/j.arr.2012.03.008
- Caton PW, Nayuni NK, Kieswich J, Khan NQ, Yaqoob MM, Corder R. Metformin suppresses hepatic gluconeogenesis through induction of SIRT1 and GCN5. J Endocrinol 2010; 205:97-106; PMID:20093281; http://dx.doi.org/10.1677/JOE-09-0345
- Lindstrom P. The physiology of obese-hyperglycemic mice [obob mice]. ScientificWorldJournal 2007; 7:666-857; PMID:17619751; http://dx.doi.org/10.1100/tsw.2007.117
- el Azzouzi H, Leptidis S, Dirkx E, Hoeks J, van Bree B, Brand K, McClellan EA, Poels E, Sluimer JC, van den Hoogenhof MM, et al. The hypoxia-inducible microRNA cluster miR-199a approximately 214 targets myocardial PPARdelta and impairs mitochondrial fatty acid oxidation. Cell Metab 2013; 18:341-54; PMID:24011070; http://dx.doi.org/10.1016/j.cmet.2013.08.009
- Song YM, Song SO, Jung YK, Kang ES, Cha BS, Lee HC, Lee BW. Dimethyl sulfoxide reduces hepatocellular lipid accumulation through autophagy induction. Autophagy 2012; 8:1085-97; PMID:22722716; http://dx.doi.org/10.4161/auto.20260
- Singh R, Cuervo AM. Autophagy in the cellular energetic balance. Cell Metab 2011; 13:495-504; PMID:21531332; http://dx.doi.org/10.1016/j.cmet.2011.04.004
- Sugden MC, Holness MJ. Metformin, metabolic stress, and mitochondria. Focus on “A novel inverse relationship between metformin-triggered AMPK-SIRT1 signaling and p53 protein abundance in high glucose-exposed HepG2 cells”. Am J Physiol Cell Physiol 2012; 303:C1-3; PMID:22442140; http://dx.doi.org/10.1152/ajpcell.00090.2012
- Speakman JR, Mitchell SE. Caloric restriction. Mol Aspects Med 2011; 32:159-221; PMID:21840335; http://dx.doi.org/10.1016/j.mam.2011.07.001
- Rena G, Pearson ER, Sakamoto K. Molecular mechanism of action of metformin: old or new insights? Diabetologia 2013; 56:1898-906; PMID:23835523
- Lee CK, Choi YJ, Park SY, Kim JY, Won KC, Kim YW. Intracerebroventricular injection of metformin induces anorexia in rats. Diabetes Metab J 2012; 36:293-9; PMID:22950061; http://dx.doi.org/10.4093/dmj.2012.36.4.293
- Singh R. Autophagy and regulation of lipid metabolism. Results Probl Cell Differ 2010; 52:35-46; PMID:20865370; http://dx.doi.org/10.1007/978-3-642-14426-4_4
- Rodgers JT, Lerin C, Haas W, Gygi SP, Spiegelman BM, Puigserver P. Nutrient control of glucose homeostasis through a complex of PGC-1alpha and SIRT1. Nature 2005; 434:113-8; PMID:15744310; http://dx.doi.org/10.1038/nature03354
- Pfluger PT, Herranz D, Velasco-Miguel S, Serrano M, Tschop MH. Sirt1 protects against high-fat diet-induced metabolic damage. Proc Natl Acad Sci U S A 2008; 105:9793-8; PMID:18599449; http://dx.doi.org/10.1073/pnas.0802917105
- Barger JL, Kayo T, Vann JM, Arias EB, Wang J, Hacker TA, Wang Y, Raederstorff D, Morrow JD, Leeuwenburgh C, et al. A low dose of dietary resveratrol partially mimics caloric restriction and retards aging parameters in mice. PLoS One 2008; 3:e2264; PMID:18523577; http://dx.doi.org/10.1371/journal.pone.0002264
- Purushotham A, Schug T, Xu Q, Surapureddi S, Guo X, Li X. Hepatocyte-specific deletion of SIRT1 alters fatty acid metabolism and results in hepatic steatosis and inflammation. Cell Metab 2009; 9:327-38; PMID:19356714; http://dx.doi.org/10.1016/j.cmet.2009.02.006
- Czaja MJ. Autophagy in health and disease. 2. Regulation of lipid metabolism and storage by autophagy: pathophysiological implications. Am J Physiol Cell Physiol 2010; 298:C973-8; PMID:20089934; http://dx.doi.org/10.1152/ajpcell.00527.2009
- Zhang W, Wu R, Zhang F, Xu Y, Liu B, Yang Y, Zhou H, Wang L, Wan K, Xiao X, Sidransky D. Thiazolidinediones improve hepatic fibrosis by activating the adenosine monophosphate-activated protein kinase (ampk) signaling pathway in rats with non-alcoholic steatohepatitis. Clin Exp Pharmacol Physiol 2012; 39:1026-33; PMID:23127227
- Sommer M, Poliak N, Upadhyay S, Ratovitski E, Nelkin BD, Donehower LA, Sidransky D. DeltaNp63alpha overexpression induces downregulation of Sirt1 and an accelerated aging phenotype in the mouse. Cell Cycle 2006; 5:2005-11; PMID:16940753; http://dx.doi.org/10.4161/cc.5.17.3194
- Bordone L, Cohen D, Robinson A, Motta MC, van Veen E, Czopik A, Steele AD, Crowe H, Marmor S, Luo J, et al. SIRT1 transgenic mice show phenotypes resembling calorie restriction. Aging Cell 2007; 6:759-67; PMID:17877786; http://dx.doi.org/10.1111/j.1474-9726.2007.00335.x
- Tilg H, Moschen AR. Evolution of inflammation in nonalcoholic fatty liver disease: the multiple parallel hits hypothesis. Hepatology 2010; 52:1836-46; PMID:21038418; http://dx.doi.org/10.1002/hep.24001
- Lee JY, Moon JH, Park JS, Lee BW, Kang ES, Ahn CW, et al. Dietary oleate has beneficial effects on every step of non-alcoholic Fatty liver disease progression in a methionine- and choline-deficient diet-fed animal model. Diabetes Metab J 2011; 35:489-96; PMID:22111040; http://dx.doi.org/10.4093/dmj.2011.35.5.489
- Haspel J, Shaik RS, Ifedigbo E, Nakahira K, Dolinay T, Englert JA, Lee HC, Cha BS. Characterization of macroautophagic flux in vivo using a leupeptin-based assay. Autophagy 2011; 7:629-42; PMID:21460622; http://dx.doi.org/10.4161/auto.7.6.15100
- Del Roso A, Vittorini S, Cavallini G, Donati A, Gori Z, Masini M, Pollera M, Bergamini E. Ageing-related changes in the in vivo function of rat liver macroautophagy and proteolysis. Exp Gerontol 2003; 38:519-27; PMID:12742529; http://dx.doi.org/10.1016/S0531-5565(03)00002-0
- Cavallini G, Donati A, Taddei M, Bergamini E. Evidence for selective mitochondrial autophagy and failure in aging. Autophagy 2007; 3:26-7; PMID:16963838; http://dx.doi.org/10.4161/auto.3268
- Zoncu R, Efeyan A, Sabatini DM. mTOR: from growth signal integration to cancer, diabetes and ageing. Nat Rev Mol Cell Biol 2011; 12:21-35; PMID:21157483; http://dx.doi.org/10.1038/nrm3025
- Lee YH, Kim SH, Lee YJ, Kang ES, Lee BW, Cha BS, Kim JW, Song DH, Lee HC. Transcription factor Snail is a novel regulator of adipocyte differentiation via inhibiting the expression of peroxisome proliferator-activated receptor gamma. Cell Mol Life Sci 2013; 70:3959-71; PMID:23689589; http://dx.doi.org/10.1007/s00018-013-1363-8
- Seglen PO. Hepatocyte suspensions and cultures as tools in experimental carcinogenesis. J Toxicol Environ Health 1979; 5:551-60; PMID:224209; http://dx.doi.org/10.1080/15287397909529766