
Abstract
The Vitamin D Receptor (VDR) is a member of the nuclear receptor superfamily and is of therapeutic interest in cancer and other settings. Regulation of microRNA (miRNA) by the VDR appears to be important to mediate its actions, for example, to control cell growth. To identify if and to what extent VDR-regulated miRNA patterns change in prostate cancer progression, we undertook miRNA microarray analyses in 7 cell models representing non-malignant and malignant prostate cells (RWPE-1, RWPE-2, HPr1, HPr1AR, LNCaP, LNCaP-C4–2, and PC-3). To focus on primary VDR regulatory events, we undertook expression analyses after 30 minutes treatment with 1α,25(OH)2D3. Across all models, 111 miRNAs were significantly modulated by 1α,25(OH)2D3 treatment. Of these, only 5 miRNAs were modulated in more than one cell model, and of these, only 3 miRNAs were modulated in the same direction. The patterns of miRNA regulation, and the networks they targeted, significantly distinguished the different cell types. Integration of 1α,25(OH)2D3-regulated miRNAs with published VDR ChIP-seq data showed significant enrichment of VDR peaks in flanking regions of miRNAs. Furthermore, mRNA and miRNA expression analyses in non-malignant RWPE-1 cells revealed patterns of miRNA and mRNA co-regulation; specifically, 13 significant reciprocal patterns were identified and these patterns were also observed in TCGA prostate cancer data. Lastly, motif search analysis revealed differential motif enrichment within VDR peaks flanking mRNA compared to miRNA genes. Together, this study revealed that miRNAs are rapidly regulated in a highly cell-type specific manner, and are significantly co-integrated with mRNA regulation.
Introduction
Aberrant transcriptional regulation is evident in many cancers. This arises by genomic, epigenomic, and posttranscriptional mechanisms. Genomic alterations, namely mutations, insertions, deletions, and amplifications, combine with aberrant epigenetic states to manipulate and distort the global cellular transcriptional program. In this manner, the cancer cell transcriptome forms a unique fingerprint of the cell state, which provides for potential therapeutic targeting strategies. Overall, the cancer cell state can be considered to be in a transcriptionally rigid state (reviewed inCitation1).
This restriction in transcriptional potential is displayed by members of the nuclear receptor (NR) superfamily. Members of this superfamily are expressed in virtually all cell types and are highly integrated functionally.Citation2-5 These receptors represent some of the most successful examples of targeted therapiesCitation6-9 and, more widely, in human disease they represent the target for approximately 15% of all drugs (reviewed inCitation10,11). Of the family of 48 NRs, at least 30 are expressed in the prostateCitation2 and many are well established in the etiology of prostate cancer (CaP), for example, the androgen receptor (AR) (reviewed inCitation12), VDR (reviewed inCitation9), and the peroxisome proliferator-activated receptors (PPARs) (reviewed inCitation6). Regulation studies on single NR target genes have revealed dynamic mRNA accumulation patterns.Citation13-16 AR regulation of the TMPRSS2/ETS fusion, a common occurrence in CaP,Citation17 is critical, precisely because TMPRSS2 is sustained in an AR responsive state in CaP,Citation18 whereas the regulation of other AR targets, such as the prostate tumor suppressor NKX3.1, becomes attenuated.Citation19
We have established patterns of transcriptional distortion by the VDR in CaP cell lines and primary cultures, with attenuation of genes, such as GADD45A, whereas the DNA helicase MCM-7 and 1α,25(OH)2D3-degrading enzyme CYP24A1 are sustained in a responsive state.Citation20,21 Similar distortions to PPAR signaling occurs.Citation2,3,Citation22,23 These de-regulated responses appear particularly amenable to targeted restoration with epigenetic therapies.Citation2-4,Citation21,24-26
Furthermore, the transition to more aggressive CaP is associated with changes to the basal expression of multiple miRNAs, including miR-125b, which targets NCOR2/SMRT,Citation27,28 and miR-221/miR-222, which target CDKN1B (encodes p27(kip1)).Citation29 An emergent literature has identified that AR and VDR also regulate miRNAs.Citation29-33 In parallel to the distorted NR regulation of mRNA in cancer, there is similar altered regulation of miRNA expression, for example, aberrant modulation of miR-21 and others by the ARCitation30 and VDR.Citation34 miRNA and mRNA combine to form feed forward loops. For example, we identified VDR-regulated MCM-7 that encodes the MIR106b clusterCitation35. VDR also regulated CDKN1A,Citation35-38 which, in turn, is targeted by miR-106b. The net result is fine tuning of p21(waf1/cip1) expression and the control of the cell cycle arrest.Citation35
Together, these observations support the concept that miRNA regulation by the VDR is distorted in a similar fashion as the mRNA targets. Thus, the transcriptional control of miRNAs appears as precise as that required for mRNA and most likely reflects their function to serve as critical regulatory components in feed forward signaling loops.Citation39-43
miRNAs hold considerable promise to be exploited as highly accurate and functional prognostic serum markers of CaP stages and drug responses.Citation27,44-54 They can encapsulate events within the tumor microenvironment, thereby overcoming the limitations of sampling error at biopsy. In parallel, it has become apparent that changes in miRNA regulation in tumors is translated to altered serum expression patterns and, therefore, offers an important diagnostic and prognostic therapeutic window.Citation53, 55-57
Therefore, we reasoned that part of the diversity of cell responses to 1α,25(OH)2D3 may be explained by the seemingly large choice of VDR binding sites through the genome and the downstream regulation of miRNA. Specifically, we propose that miRNA expression reflects the epigenetic restriction of VDR transcriptional responsiveness that evolves during CaP progression. In the current study, we applied microarray approaches to examine the VDR regulated expression of miRNA in a wide panel of human prostate non-malignant and malignant cell lines, combined with parallel microarray analyses of mRNA in non-malignant prostate RWPE-1 cells. Combining these data with publically available VDR ChIP-seq data indicates how VDR transcriptional actions evolve in cancer. The findings suggest selective distortion of miRNA regulation in CaP progression.
Results
1α,25(OH)2D3 regulates differential expression of miRNA in 7 different prostate cell models
We reasoned that short time exposures of cells to 1α,25(OH)2D3 would reveal genes where the VDR was either already bound or could access them as they were in open chromatin context. Therefore, cells were treated with 1α,25(OH)2D3 for 30 minutes and miRNA extracted for microarray analyses.
Characteristics and 1α,25(OH)2D3 sensitivity of the cell line models are listed in . We observed distinct patterns of VDR-regulated miRNA expression. In total, 111 miRNA were significantly modulated (P-value < 0.01, and Table S1) in different cell line models. Of these, only 5 miRNAs were modulated in more than one model, and of these, only 3 miRNAs were modulated in the same direction (miR-30e, mir-98, and miR-140–5p; ). The microarray expression patterns in the 7 prostate cell lines are represented as a heatmap in . The cell lines with similar clinical features and 1α,25(OH)2D3 sensitivity showed related expression changes and clustered together. Generally, non-malignant epithelial cells with the greatest 1α,25(OH)2D3 sensitivity (RWPE1 and HPr1AR) clustered separately from androgen-sensitive and partially 1α,25(OH)2D3-sensitive malignant models (LNCaP and RWPE2) and ADT-RCaP disease (). These data suggest that VDR-regulated miRNA expression patterns have the capacity to distinguish between cell lines derived from different stages of CaP. Microarray results were validated using Q-RT-PCR for 5 miRNAs and Q-RT-PCR results showed concordance with microarray data ().
Table 1. miRNA expression analyses in prostate cell lies. Each cell line was treated with 1α,25(OH)2D3 (100 nM) and ethanol as vehicle control for 30 minutes. Log2 changes in expression of miRNAs were calculated in 1α,25(OH)2D3 treated samples compared to ethanol treated samples. Number of up- and down-regulated miRNAs in response to 1α,25(OH)2D3 treatment in each cell line are shown. Characteristics and reported response to 1α,25(OH)2D3 for each cell line is also shown.
Table 2. miRNAs regulated in more than one cell line. Five miRNAs showed differential expression in more than one cell line upon 1α,25(OH)2D3 treatment. Table shows the regulated miRNAs, cell lines and their direction of expression change compared to ethanol within each cell line. Two arrows show the direction of expression change in respective cell lines (↑) up-regulated, (↓) downregulated.
Figure 1 (See previous page). Regulation of miRNAs in response to 1α,25(OH)2D3 in prostate cell lines. (A) Heatmap of miRNA expression profile across 7 prostate cell lines. The cell lines were treated with either 1α,25(OH)2D3 or ethanol for 30 minutes and genome-wide miRNA expression analysis was performed using Exiqon microarrays. Differential expression of miRNAs was calculated in treated samples compared to ethanol vehicle control samples for each cell line. Hierarchical clustering of 7 prostate cell lines was performed using log2 fold changes values of 111 miRNAs across all the cell lines. Hierarchical clustering was performed using Cluster 3.0 and the clusters were visualized by Tree View. Clustering of cell lines showed the separation of cell lines based on their phenotypic characteristics. (B) To validation the microarray results 5 miRNAs across 4 different cell lines were tested using miRNA specific TapMan probes. Validation by Q-PCR showed concordant results for all 5 miRNAs tested. (C) Pathways analysis of miRNAs target genes for significant miRNAs in each cell lines was performed using DIANA-mirPath. Top 20 significantly enriched miRNA targeted pathways for individual cell lines were selected and a unique list of pathways was generated. Pathways were given a score of 1 or 0 if they are present or absent, respectively, in each cell line and hierarchical clustering was performed as described for miRNA expression. Hierarchical clustering of top 20 significantly enriched miRNA targeted pathways for each cell line showed separation of non-malignant and malignant cell lines. Pink color shows the presence of the pathway in the cell lines whereas gray color show absence of the pathway.
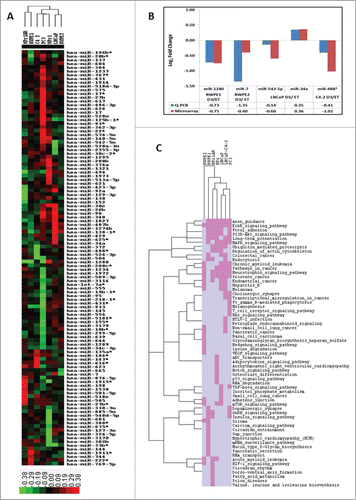
Subsequently, we analyzed these 1α,25(OH)2D3-regulated miRNAs across the cell models to identify the molecular pathways and networks targeted by these miRNAs using DIANA miRPath v.2.0. Firstly, lists of significantly targeted pathways by miRNAs were generated for each cell line. Individual cell lines showed unique and common pathways targeted by these miRNAs. Subsequently, the top 20 most significant pathways from each cell line were used to find if the common and unique pathway signatures cluster cell lines based on clinical features or 1α,25(OH)2D3 sensitivity. The top 20 significant pathways from all the cell lines represent 63 unique pathways. Hierarchical clustering of cell lines based on these 63 pathways showed very unique patterns where non-malignant cell lines (RWPE-1, HPr1 and HPr1AR) and cancer cell lines (LNCaP, LNCaP-C4–2 and PC3) cluster separately (). This pathway analysis and clustering suggests that 1α,25(OH)2D3-regulated miRNAs target pathways that are shared by either malignant or non-malignant cell lines.
VDR binding associates with miRNA regulation. In an attempt to establish a role for VDR regulation of these miRNAs, we leveraged publically available VDR ChIP-seq data to identify VDR binding regions in one or more data sets within 5, 10, 50, and 100 kb genomic regions flanking the miRNAs (). Specifically, we exploited a pre-compiled list of 23,409 non-overlapping VDR binding sitesCitation58 derived from published VDR ChIP-seq studies. We used this list of VDR binding sites to identify VDR binding regions in the flanking sequences of miRNAs. The VDR binding peaks were compared to the genomic coordinates for primary miRNAs downloaded from miRbase. To test whether 1α,25(OH)2D3-regulated miRNAs in CaP cell lines show enrichment of VDR peaks we compared the number of peaks around 1α,25(OH)2D3 regulated miRNAs (N = 111) to the number of VDR peaks around all the miRNAs in miRbase (N = 2571). The extent of significant enrichment was tested using hypergeometric distribution.
Table 3. Showing distribution of VDR peaks near miRNAs regulated by 1α,25(OH)2D3 in prostate cell lines. Genomic coordinates of all the regulated miRNAs across all the prostate cell lines were downloaded from miRbase and overlapped with combined list of VDR peaks from 5 published VDR ChIP-seq data sets. Number of VDR peak in defined flanking regions of 1α,25(OH)2D3 regulated miRNAs were compared to number of VDR peak in similar flanking regions of all the miRNAs reported in miRbase. Statistical significance of enrichment of VDR peaks was calculated using hypergeometric test and P ≤ 0 .05 was considered significant.
The 1α,25(OH)2D3-regulated miRNAs showed significant enrichment (hypergeometric distribution P-value < 0.05) of VDR peaks compared to all the miRNAs reported in miRbase database. For example, out of 111 1α,25(OH)2D3-regulated miRNAs, 24 miRNAs (21.6%) have at least one VDR peak within ±5 kb, whereas out of 2571 reported miRNAs, 399 miRNAs (15.5%) have at least one VDR peak within ±5 kb (hypergeometric distribution; P-value < 0.021; ). Similarly, distribution of VDR peaks within ±50 and 100 kb of 1α,25(OH)2D3-regulated miRNAs also showed significant enrichment compared to all reported miRNAs (). These results suggest that direct VDR binding events proximal to these miRNAs are functionally relevant in modulation of miRNA expression patterns in response to 1α,25(OH)2D3.
Significantly altered mRNA regulation in RWPE-1 cells reflects miRNA regulation
To complement these miRNA analyses, we undertook a parallel mRNA microarray experiment in RWPE-1 cells in response to 1α,25(OH)2D3 treatment. This approach, again at a short time point (30 minutes), revealed a restricted transcriptome of 108 targets (P-value < 0.01; Table S2). Of these, 48 genes were upregulated and 60 genes were downregulated. Gene ontology analysis with PANTHERCitation59 identified several biological processes to be enriched in this gene list, including cellular and metabolic processes ().
Figure 2 (See previous page). Functional annotation of 1α,25(OH)2D3-regulated mRNA genes in RWPE-1 cells and their co-regulation with miRNAs. (A). Biological processes enriched in the set of genes modulated by 1α,25(OH)2D3 in RWPE-1 cells were identified through PANTHER gene list analysis tool. The graph shows significantly enriched biological process and the number of genes in each process which is regulated. (B) The miRNAs and their predicted targets co-regulated in RWPE-1 in response to 1α,25(OH)2D3. Gene and miRNAs pairs showing negative correlation and their expression levels are shown. (C) Shows the reciprocal expression of miR-20a and its predicted target gene NOG. miRNA and mRNA expression (RNA-seq) data was downloaded from TCGA data portal. Raw expression values were log2 transformed and t-test was performed between normal tissue and tumors to identify significant difference in expression after FDR correction. Box plot show that miR-20a is upregulated in tumors where and its predicted target gene NOG is down regulated in tumors suggesting reciprocal relation between miRNA and its target mRNA. (D) Shows the enriched DNA binding motifs under the VDR peaks which does not contain DR3-type motif and present within ±5 kb of mRNA and miRNAs genes. Motif search was performed using MEME-ChIP tool of MEME suite.
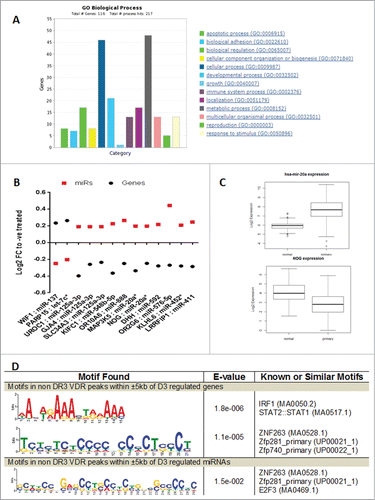
To explore the coordinated regulation of miRNAs and their target mRNAs we integrated miRNA and mRNA microarray data from RWPE-1 cells. First, we identified predicted mRNA targets for differentially expressed miRNAs (P ≤ 0.05, Table S3) in RWPE-1 cells. For this study, mRNA targets predicted by at least 3 of 4 different prediction algorithms (miRanda,Citation60 miRDB,Citation61 TargetScanCitation62, and ExprTargetDBCitation63) were considered for further analysis. Subsequently, predicted mRNA targets that were differentially expressed upon 1α,25(OH)2D3 treatment in RWPE-1 cells were used to identify reciprocal expression patterns between miRNAs and their predicted mRNA targets. In this approach, we identified 10 miRNAs showing a statistically significant inverse expression pattern with 13 genes regulated by 1α,25(OH)2D3 (). These findings suggest that in non-malignant RWPE-1 cells, 1α,25(OH)2D3-regulated miRNA and mRNA expression are integrated.
We also tested the expression of these miRNAs and mRNAs in TCGA prostate cancer samples using RNA-seq data. Interestingly, out of these 13 genes, 5 genes showed differential expression between tumor and matched normal samples (downregulated genes—WIF1 and NOG; upregulated genes—KIFC1, KLHL6, and SLC34A3). Also miR-20a showed differential expression in TCGA CaP samples. Further, a reciprocal expression pattern was observed between miR-20a and NOG, a predicted target of miR-20a, in TCGA CaP samples (). These findings in TCGA CaP samples further strengthen the finding of reciprocal expression between mRNA and miRNA in RWPE-1 cells.
VDR binding patterns around miRNA and mRNA
We subsequently examined the role of VDR binding associated with mRNA and miRNA targets in RWPE-1 cells. In the first instance, we compared all the VDR peaks within ±5 kb of 1α,25(OH)2D3-regulated miRNAs to identify peaks containing the canonical DR3-type VDR binding motif. For 1α,25(OH)2D3-regulated miRNAs, out of 81 VDR peaks within ±5 kb, 14 (17.3%) peaks contained the DR3-type motif. However, the same analyses of 1α,25(OH)2D3-regulated mRNA genes revealed 183 VDR peaks within ±5 kb and that 66 (36.1%) peaks contained the DR3-type motif. This difference of DR3-type containing motifs between 1α,25(OH)2D3-regulated miRNAs and mRNAs was statistically significant (Fisher's exact test P-value = 0.0022).
To identify other transcription factors which may be interacting with VDR to regulate these miRNAs and mRNA genes we searched for binding motif enrichment in VDR peaks that do not contain DR3-types motif using Multiple Em for Motif Elicitation (MEME).Citation64 The binding motif of ZNF263 was significantly enriched in VDR peaks flanking both mRNA and miRNA genes. Whereas the binding motif of IRF1/STAT1,2 was only significantly enriched under the VDR peaks flanking mRNA genes ().Citation65 This difference suggests that mRNA and miRNA genes are under control by unique VDR-containing complexes.
Discussion
The current study was undertaken to define the extent and flexibility of the VDR-regulated miRNAs in a wide range of different prostate cell models from non-malignant to malignant (androgen sensitive and androgen deprivation therapy recurrent) and metastatic models. Remarkably, the expression of VDR-regulated miRNAs was strikingly flexible and suggests that the VDR actions in this disease context are highly modulated by other cellular forces. These data also suggest that patterns of VDR-regulated miRNA and mRNA are integrated as identified in RWPE-1 cells. Furthermore, analyses of TCGA CaP data provide evidence that this integration remains in the diseased state.
We examined the expression of miRNA in response to 1α,25(OH)2D3 at an early time point (30 minutes) with the goal to identify initial and direct responses toward 1α,25(OH)2D3 and direct VDR targets in prostate cell lines. We identified differential miRNA expression with minimal overlap between cell lines supporting the concept that VDR regulation of miRNA is highly variable. As with other NRs, the genomic actions of VDR oscillate between on and off states and result in cyclical gene regulation that is apparent at early time points and often continues to modulate for at least several hours, subsequently. These findings suggest that the differentially expressed miRNA and mRNA signatures identified in this study after 30 minutes treatment are strongly suggestive of genes that will continue to modulate at later time points and have true biological consequences.Citation35, 66
This flexibility of VDR signaling is also reflected by the 5 published VDR ChIP-seq data sets, which show very little conservation of the choice of VDR binding site across the genome in different cell types. These five studies identified roughly a similar number of VDR binding sites (approximately 1500 – 2500) despite examining different cell lines at different time points. Namely, lymphoblastoid cells after 36 h treatment, Citation67 monocytes (THP-1) after 40 minutes treatments,Citation68 and colorectal cancer cells (LS180) after 180 min with 1α,25(OH)2D3.Citation69 Remarkably, only 20% of these genomic sites are identical in all 3 investigated cell lines. This indicates that the majority of VDR binding is both time and cell background specific. In general, this suggests that for the VDR, and probably also for other nuclear receptors, there is a high number of binding sites available within the genome and that these potential binding sites are distilled within a cell. The basis for this unrealized potential remains ambiguous but probably reflects a diversity of receptor interactions. These findings are consistent with the concept that VDR interacts with other “pioneer factors” or transcription factors that bind regulatory genomic regions and facilitate the opening of these loci via interactions with chromatin modifying enzymes. This then allows “following factors” to bind a subset of these accessible regions and to execute their regulatory actions. Analyses of the enrichment of the DR-3 motifs in miRNA compared to mRNA support the concept of differential targeting of protein coding versus non-coding genes. Similarly the enrichment of the IRF1 motif in the mRNA further supports the concept of unique regulation of genes depending on cell function.
As to what, in more aggressive cancer cells, controls the ability of the VDR to regulate miRNA, it is worth noting that in the absence of ligand, the VDR is resident in the nucleus. This in turn may support a mechanism by which inappropriate interactions with co-repressors and H3K9 methylation favor a more stable epigenetic event, namely, DNA methylation. We have revealed recently that the increased recruitment of co-repressor association with the VDR appears to convert a transient epigenetic silencing process, which is part of the normal nuclear receptor-transcriptional cycle, into a stable and heritable epigenetic event.Citation66 The consequences of this could therefore be the targeted methylation of genes where NCOR1 and other co-repressors are recruited by the VDR, or other nuclear resident transcription factors. Therefore, these receptors may provide a route for the silencing of critical miRNA transcriptional control by selective NCOR1 recruitment and thereby allow CaP cells to escape mitotic restraint.
Tumor expression patterns of miRNAs have been shown to distinguish either cancer subtypes or predict tumor biological and clinical behavior, and recently it has been demonstrated that altered levels of miRNA as a consequence of tumor expression are detectable in serum.Citation27 Thus, an emergent and highly attractive area in cancer biology is exploiting these non-invasive biomarkers to characterize clinical cancer phenotypes and disease progression more accurately. The current study addressed how miRNAs are regulated by the VDR pathway and how these actions are distorted in CaP phenotypes. Thus, by considering miRNA expression behavior in the presence of different vitamin D levels potentially gives an accurate and practical route to stratify patient responses toward VDR-centered therapies.
Materials and Methods
Cell Lines and reagents: Prostate epithelial cell lines representing a spectrum of CaP phenotypes were used, as described previously.Citation27 Cell lines derived from normal prostate epithelial cells (RWPE-1, HPr1, HPr1AR), early stage CaP cells (RWPE-2), androgen sensitive CaP (LNCaP), ADT recurrent CaP (LNCaP-C4–2), and metastatic CaP (PC3) were used. RWPE-1, RWPE-2, HPr1, and HPr1AR cells were maintained in KSF media supplemented with EGF and BPE (Invitrogen). Other cells were maintained in RPMI-1640 supplemented with 10% v/v FBS (Invitrogen). 1α25(OH)2D3 [gift of Dr. Milan Uskokovic (BioXell S.p.A., Italy)] was used at 100 nM concentration for all experiments and compared to ethanol treated cells.
Microarray analyses: Total mRNA and miRNA isolation was performed using Trizol (Invitrogen). MiRNA expression analysis in all the cell lines was performed using Exiqon miRNA 5th generation expression arrays using single color hybridization. For mRNA expression Illumina microarray (Illumina HT12v4) analysis was performed in RWPE-1 cells. All the microarrays were performed in biological triplicates for each cell line treated with 1α,25(OH)2D3 (100 nM) or ethanol (vehicle control) for 30 minutes. All analyses were performed using the R platform for statistical computing,Citation70 and a range of library packages implemented in Bioconductor, including the LIMMA package.Citation71 Normalized expression of miRNA and mRNA microarrays was compared across cell lines using Linear Models for Microarray Data in LIMMA. Hierarchical clustering was performed using Cluster 3.0Citation72 and the clusters were visualized by Tree View.Citation73 Gene Ontology analysis of 1α,25(OH)2D3-regulated genes in RWPE-1 was performed using PANTHER (Protein ANalysis THrough Evolutionary Relationships) classification system.Citation59 Network analysis of differentially expressed miRNAs was undertaken to reveal common targeting of pathways. To understand the functional significance of these miRNAs with CaP disease stages, we undertook pathway enrichment analyses using Diana-mirPath.Citation74
Quantitative real time PCR (Q-RT-PCR): For validation of microarray results, TaqMan probes for selected miRNAs were used and Q-RT-PCR analysis was performed on ABI 7300.
Integration with VDR ChIP-seq data: Tuoresmaki et al.Citation58 compiled data sets from 5 published VDR ChIP-seq studies including immortalized lymphoblastoids,Citation67 hepatic stellate cells,Citation75 and cancer cell lines representing monocytic leukemia,Citation58,68 and colon cancer.Citation69 These studies differed in the time of cell exposure to 1α,25(OH)2D3 and identified binding sites, on the order of hundreds to several thousands of different binding sites per cell type.
From these 5 VDR ChIP-seq data sets a total of 23,409 non-overlapping genomic VDR binding sites were identified.Citation58 We used this list of VDR peaks to map VDR binding near miRNA and mRNA genes. Genomic coordinates of all miRNA primary transcripts were downloaded from miRbase (www.mirbase.org). Presence of VDR binding peaks was identified using GalaxyCitation76-78 within ±5, 10, 50 and 100 kb of miRNA primary transcripts for all 1α,25(OH)2D3-regulated miRNAs. Statistical significance of overlap was calculated by hypergeometric tests using R. The MEME Suite web server was used to identify enriched motif under VDR peaks. Specifically, MEME-ChIPCitation64 tool with JASPAR Vertebrates and UniPROBE Mouse motif database and default settings were used.
Disclosure of Potential Conflicts of Interest
No potential conflicts of interest were disclosed.
Supplementary_Data.xlsx
Download MS Excel (25.5 KB)Funding
MJC acknowledges support in part from National Institute of Health grants [R01 CA095367–06 and 2R01-CA-095045–06] and the Prostate program of the Department of Defense Congressionally Directed Medical Research Programs [GRANT11496202], MJC also acknowledges support, in part, of the NCI Cancer Center Support Grant to the Roswell Park Cancer Institute [CA016056]. MDL acknowledges support of Molecular Pharmacology and Experimental Therapeutics NRSA T32 program [T32CA009072]. MJC and LES acknowledge support of the Pilot Studies program of the University at Buffalo Clinical and Translational Research Center and the Buffalo Translational Consortium.
Supplemental Material
Supplemental data for this article can be accessed on the publisher's website.
References
- Thorne JL, Campbell MJ, Turner BM. Transcription factors, chromatin and cancer. Int J Biochem Cell Biol 2009; 41:164-75; PMID:18804550; http://dx.doi.org/10.1016/j.biocel.2008.08.029
- Long MD, Thorne JL, Russell J, Battaglia S, Singh PK, Sucheston-Campbell LE, Campbell MJ. Cooperative behavior of the nuclear receptor superfamily and its deregulation in prostate cancer. Carcinogenesis 2014; 35:262-71; PMID:24104552; http://dx.doi.org/10.1093/carcin/bgt334
- Battaglia S, Maguire O, Thorne JL, Hornung LB, Doig CL, Liu S, Sucheston LE, Bianchi A, Khanim FL, Gommersall LM, et al. Elevated NCOR1 disrupts PPARalpha/gamma signaling in prostate cancer and forms a targetable epigenetic lesion. Carcinogenesis 2010; 31:1650-60; PMID:20466759; http://dx.doi.org/10.1093/carcin/bgq086
- Abedin SA, Thorne JL, Battaglia S, Maguire O, Hornung LB, Doherty AP, Mills IG, Campbell MJ. Elevated NCOR1 disrupts a network of dietary-sensing nuclear receptors in bladder cancer cells. Carcinogenesis 2009; 30:449-56; PMID:19126649; http://dx.doi.org/10.1093/carcin/bgp005
- Thorne JL, Campbell MJ. Nuclear receptors and the Warburg effect in cancer. Int J Cancer 2014; [Epub ahead of print]; http://dx.doi.org/10/1002/ijc.29012
- Campbell MJ, Carlberg C, Koeffler HP. A Role for the PPARgamma in Cancer Therapy. PPAR research 2008; 2008:314974; PMID:18528521; http://dx.doi.org/10.1155/2008/314974
- Carlberg C, Campbell MJ, Vitamin D Receptor signaling mechanisms: integrated actions of a well-defined transcription factor. Steroids 2013; 78:127-36; PMID:23178257; http://dx.doi.org/10.1016/j.steroids.2012.10.019
- Mongan NP, Gudas LJ. Diverse actions of retinoid receptors in cancer prevention and treatment. Differentiation; research in biological diversity 2007; 75:853-70; PMID:17634071; http://dx.doi.org/10.1111/j.1432-0436.2007.00206.x
- Thorne J, Campbell MJ. The vitamin D receptor in cancer. The Proceedings of the Nutrition Society 2008; 67:115-27; PMID:18412986; http://dx.doi.org/10.1017/S0029665108006964
- Carlberg C, Dunlop TW. An integrated biological approach to nuclear receptor signaling in physiological control and disease. Crit RevEukaryotGene Expr 2006; 16:1-22; http://dx.doi.org/10.1615/CritRevEukarGeneExpr.v16.i1.10
- Evans RM. The nuclear receptor superfamily: a rosetta stone for physiology. Mol Endocrinol 2005; 19:1429-38; PMID:15914712; http://dx.doi.org/10.1210/me.2005-0046
- Feldman BJ, Feldman D. The development of androgen-independent prostate cancer. Nat Rev Cancer 2001; 1:34-45; PMID:11900250; http://dx.doi.org/10.1038/35094009
- Metivier R, Penot G, Hubner MR, Reid G, Brand H, Kos M, Gannon F. Estrogen receptor-α directs ordered, cyclical, and combinatorial recruitment of cofactors on a natural target promoter. Cell 2003; 115:751-63; PMID:14675539; http://dx.doi.org/10.1016/S0092-8674(03)00934-6
- Metivier R, Gallais R, Tiffoche C, Le Peron C, Jurkowska RZ, Carmouche RP, Ibberson D, Barath P, Demay F, Reid G, et al. Cyclical DNA methylation of a transcriptionally active promoter. Nature 2008; 452:45-50; PMID:18322525; http://dx.doi.org/10.1038/nature06544
- Vaisanen S, Dunlop TW, Sinkkonen L, Frank C, Carlberg C. Spatio-temporal Activation of Chromatin on the Human CYP24 Gene Promoter in the Presence of 1alpha,25-Dihydroxyvitamin D(3). J Mol Biol 2005; 350:65-77; PMID:15919092
- Kang Z, Janne OA, Palvimo JJ. Coregulator recruitment and histone modifications in transcriptional regulation by the androgen receptor. Mol Endocrinol 2004; 18:2633-48; PMID:15308689
- Tomlins SA, Rhodes DR, Perner S, Dhanasekaran SM, Mehra R, Sun XW, Varambally S, Cao X, Tchinda J, Kuefer R, et al. Recurrent fusion of TMPRSS2 and ETS transcription factor genes in prostate cancer. Science 2005; 310:644-8; PMID:16254181; http://dx.doi.org/10.1126/science.1117679
- Wang Q, Li W, Liu XS, Carroll JS, Janne OA, Keeton EK, Chinnaiyan AM, Pienta KJ, Brown M. A hierarchical network of transcription factors governs androgen receptor-dependent prostate cancer growth. Mol Cell 2007; 27:380-92; PMID:17679089; http://dx.doi.org/10.1016/j.molcel.2007.05.041
- Bowen C, Bubendorf L, Voeller HJ, Slack R, Willi N, Sauter G, Gasser TC, Koivisto P, Lack EE, Kononen J, et al. Loss of NKX3.1 expression in human prostate cancers correlates with tumor progression. Cancer Res 2000; 60:6111-5; PMID:11085535
- Khanim FL, Gommersall LM, Wood VH, Smith KL, Montalvo L, O'Neill LP, Xu Y, Peehl DM, Stewart PM, Turner BM, et al. Altered SMRT levels disrupt vitamin D3 receptor signalling in prostate cancer cells. Oncogene 2004; 23:6712-25; PMID:15300237; http://dx.doi.org/10.1038/sj.onc.1207772
- Rashid SF, Moore JS, Walker E, Driver PM, Engel J, Edwards CE, Brown G, Uskokovic MR, Campbell MJ. Synergistic growth inhibition of prostate cancer cells by 1 α,25 Dihydroxyvitamin D(3) and its 19-nor-hexafluoride analogs in combination with either sodium butyrate or trichostatin A. Oncogene 2001; 20:1860-72; PMID:11313934; http://dx.doi.org/10.1038/sj.onc.1204269
- Annicotte JS, Iankova I, Miard S, Fritz V, Sarruf D, Abella A, Berthe ML, Noël D, Pillon A, Iborra F, et al. Peroxisome proliferator-activated receptor gamma regulates E-cadherin expression and inhibits growth and invasion of prostate cancer. Mol Cell Biol 2006; 26:7561-74; PMID:17015477; http://dx.doi.org/10.1128/MCB.00605-06
- Chang TH, Szabo E. Enhanced growth inhibition by combination differentiation therapy with ligands of peroxisome proliferator-activated receptor-gamma and inhibitors of histone deacetylase in adenocarcinoma of the lung. Clin Cancer Res 2002; 8:1206-12.
- Banwell CM, MacCartney DP, Guy M, Miles AE, Uskokovic MR, Mansi J, Stewart PM, O'Neill LP, Turner BM, Colston KW, et al. Altered nuclear receptor corepressor expression attenuates vitamin D receptor signaling in breast cancer cells. Clin Cancer Res 2006; 12:2004-13; PMID:16609009; http://dx.doi.org/10.1158/1078-0432.CCR-05-1218
- Tavera-Mendoza LE, Quach TD, Dabbas B, Hudon J, Liao X, Palijan A, Gleason JL, White JH. Incorporation of histone deacetylase inhibition into the structure of a nuclear receptor agonist. Proc Natl Acad Sci U S A 2008; 105:8250-5; PMID:18550844; http://dx.doi.org/10.1073/pnas.0709279105
- Yang X, Phillips DL, Ferguson AT, Nelson WG, Herman JG, Davidson NE. Synergistic activation of functional estrogen receptor (ER)-α by DNA methyltransferase and histone deacetylase inhibition in human ER-α-negative breast cancer cells. Cancer Res 2001; 61:7025-9; PMID:11585728
- Singh PK, Preus L, Hu Q, Yan L, Long MD, Morrison CD, Nesline M, Johnson CS, Koochekpour S, Kohli M, et al. Serum microRNA expression patterns that predict early treatment failure in prostate cancer patients. Oncotarget 2014; 5:824-40; PMID:24583788
- Yang X, Bemis L, Su LJ, Gao D, Flaig TW. miR-125b regulation of androgen receptor signaling via modulation of the receptor complex Co-repressor NCOR2. Biores Open Access 2012; 1:55-62; PMID:23514806; http://dx.doi.org/10.1089/biores.2012.9903
- Sun T, Wang Q, Balk S, Brown M, Lee GS, Kantoff P. The role of microRNA-221 and microRNA-222 in androgen-independent prostate cancer cell lines. Cancer Res 2009; 69:3356-63; PMID:19351832; http://dx.doi.org/10.1158/0008-5472.CAN-08-4112
- Ribas J, Ni X, Haffner M, Wentzel EA, Salmasi AH, Chowdhury WH, Kudrolli TA, Yegnasubramanian S, Luo J, Rodriguez R, et al. miR-21: an androgen receptor-regulated microRNA that promotes hormone-dependent and hormone-independent prostate cancer growth. Cancer Res 2009; 69:7165-9; PMID:19738047; http://dx.doi.org/10.1158/0008-5472.CAN-09-1448
- Song G, Wang L. Transcriptional mechanism for the paired miR-433 and miR-127 genes by nuclear receptors SHP and ERRgamma. Nucleic Acids Res 2008; 36:5727-35; PMID:18776219; http://dx.doi.org/10.1093/nar/gkn567
- Gatfield D, Le Martelot G, Vejnar CE, Gerlach D, Schaad O, Fleury-Olela F, Ruskeepää AL, Oresic M, Esau CC, Zdobnov EM, et al. Integration of microRNA miR-122 in hepatic circadian gene expression. Genes Dev 2009; 23:1313-26; PMID:19487572; http://dx.doi.org/10.1101/gad.1781009
- Wang X, Gocek E, Liu CG, Studzinski GP. MicroRNAs181 regulate the expression of p27Kip1 in human myeloid leukemia cells induced to differentiate by 1,25-dihydroxyvitamin D3. Cell Cycle 2009; 8:736-41.
- Wang WL, Chatterjee N, Chittur SV, Welsh J, Tenniswood MP. Effects of 1alpha,25 dihydroxyvitamin D3 and testosterone on miRNA and mRNA expression in LNCaP cells. Molecular cancer 2011; 10:58; PMID:21592394; http://dx.doi.org/10.1186/1476-4598-10-58
- Thorne JL, Maguire O, Doig CL, Battaglia S, Fehr L, Sucheston LE, Heinaniemi M, O'Neill LP, McCabe CJ, Turner BM, et al. Epigenetic control of a VDR-governed feed-forward loop that regulates p21(waf1/cip1) expression and function in non-malignant prostate cells. Nucleic Acids Res 2011; 39:2045-56; PMID:21088000; http://dx.doi.org/10.1093/nar/gkq875
- Saramaki A, Banwell CM, Campbell MJ, Carlberg C. Regulation of the human p21(waf1/cip1) gene promoter via multiple binding sites for p53 and the vitamin D3 receptor. Nucleic Acids Res 2006; 34:543-54; PMID:16434701; http://dx.doi.org/10.1093/nar/gkj460
- Schwaller J, Koeffler HP, Niklaus G, Loetscher P, Nagel S, Fey MF, Tobler A. Posttranscriptional stabilization underlies p53-independent induction of p21WAF1/CIP1/SDI1 in differentiating human leukemic cells. J Clin Invest 1995; 95:973-9; PMID:7883998; http://dx.doi.org/10.1172/JCI117806
- Liu M, Lee MH, Cohen M, Bommakanti M, Freedman LP. Transcriptional activation of the Cdk inhibitor p21 by vitamin D3 leads to the induced differentiation of the myelomonocytic cell line U937. Genes Dev 1996; 10:142-53; PMID:8566748; http://dx.doi.org/10.1101/gad.10.2.142
- Brosh R, Shalgi R, Liran A, Landan G, Korotayev K, Nguyen GH, Enerly E, Johnsen H, Buganim Y, Solomon H, et al. p53-Repressed miRNAs are involved with E2F in a feed-forward loop promoting proliferation. Mol Syst Biol 2008; 4:229; PMID:19034270; http://dx.doi.org/10.1038/msb.2008.65
- Petrocca F, Visone R, Onelli MR, Shah MH, Nicoloso MS, de Martino I, Iliopoulos D, Pilozzi E, Liu CG, Negrini M, et al. E2F1-regulated microRNAs impair TGFbeta-dependent cell-cycle arrest and apoptosis in gastric cancer. Cancer Cell 2008; 13:272-86; PMID:18328430; http://dx.doi.org/10.1016/j.ccr.2008.02.013
- Castellano L, Giamas G, Jacob J, Coombes RC, Lucchesi W, Thiruchelvam P, Barton G, Jiao LR, Wait R, Waxman J, et al. The estrogen receptor-α-induced microRNA signature regulates itself and its transcriptional response. Proc Natl Acad Sci U S A 2009; 106:15732-7; PMID:19706389; http://dx.doi.org/10.1073/pnas.0906947106
- Martinez NJ, Walhout AJ. The interplay between transcription factors and microRNAs in genome-scale regulatory networks. Bioessays 2009; 31:435-45; PMID:19274664; http://dx.doi.org/10.1002/bies.200800212
- Mangan S, Alon U. Structure and function of the feed-forward loop network motif. Proc Natl Acad Sci U S A 2003; 100:11980-5; PMID:14530388; http://dx.doi.org/10.1073/pnas.2133841100
- Watahiki A, Macfarlane RJ, Gleave ME, Crea F, Wang Y, Helgason CD, Chi KN. Plasma miRNAs as biomarkers to identify patients with castration-resistant metastatic prostate cancer. Int J Mol Sci 2013; 14:7757-70; PMID:23574937; http://dx.doi.org/10.3390/ijms14047757
- Tsuchiyama K, Ito H, Taga M, Naganuma S, Oshinoya Y, Nagano K, Yokoyama O, Itoh H. Expression of microRNAs associated with gleason grading system in prostate cancer: miR-182-5p is a useful marker for high grade prostate cancer. Prostate 2013; 73:827-34; PMID:23184537; http://dx.doi.org/10.1002/pros.22626
- Sun D, Layer R, Mueller AC, Cichewicz MA, Negishi M, Paschal BM, Dutta A. Regulation of several androgen-induced genes through the repression of the miR-99a/let-7c/miR-125b-2 miRNA cluster in prostate cancer cells. Oncogene 2014; 33(11):1448-57; PMID:23503464; http://dx.doi.org/10.1038/onc.2013.77
- Sita-Lumsden A, Dart DA, Waxman J, Bevan CL. Circulating microRNAs as potential new biomarkers for prostate cancer. Br J Cancer 2013; 108:1925-30; PMID:23632485; http://dx.doi.org/10.1038/bjc.2013.192
- Selth LA, Townley SL, Gillis JL, Tilley WD, Butler LM. Identification of Prostate Cancer-Associated MicroRNAs in Circulation Using a Mouse Model of Disease. Methods Mol Biol 2013; 1024:235-46; PMID:23719956; http://dx.doi.org/10.1007/978-1-62703-453-1_19
- Selth LA, Townley SL, Bert AG, Stricker PD, Sutherland PD, Horvath LG, Goodall GJ, Butler LM, Tilley WD. Circulating microRNAs predict biochemical recurrence in prostate cancer patients. B J Cancer 2013; 109:641-50; PMID:23846169; http://dx.doi.org/10.1038/bjc.2013.369
- Wang L, Tang H, Thayanithy V, Subramanian S, Oberg AL, Cunningham JM, Cerhan JR, Steer CJ, Thibodeau SN. Gene networks and microRNAs implicated in aggressive prostate cancer. Cancer Research 2009; 69:9490-7; PMID:19996289; http://dx.doi.org/10.1158/0008-5472.CAN-09-2183
- Tong AW, Fulgham P, Jay C, Chen P, Khalil I, Liu S, Senzer N, Eklund AC, Han J, Nemunaitis J. MicroRNA profile analysis of human prostate cancers. Cancer Gene Ther 2009; 16:206-16; PMID:18949015; http://dx.doi.org/10.1038/cgt.2008.77
- Siva AC, Nelson LJ, Fleischer CL, Majlessi M, Becker MM, Vessella RL, Reynolds MA. Molecular assays for the detection of microRNAs in prostate cancer. Mol Cancer 2009; 8:17; PMID:19267923; http://dx.doi.org/10.1186/1476-4598-8-17
- Mitchell PS, Parkin RK, Kroh EM, Fritz BR, Wyman SK, Pogosova-Agadjanyan EL, Peterson A, Noteboom J, O'Briant KC, Allen A, et al. Circulating microRNAs as stable blood-based markers for cancer detection. Proc Natl Acad Sci U S A 2008; 105:10513-8; PMID:18663219; http://dx.doi.org/10.1073/pnas.0804549105
- Ambs S, Prueitt RL, Yi M, Hudson RS, Howe TM, Petrocca F, Wallace TA, Liu CG, Volinia S, Calin GA, et al. Genomic profiling of microRNA and messenger RNA reveals deregulated microRNA expression in prostate cancer. Cancer Res 2008; 68:6162-70; PMID:18676839; http://dx.doi.org/10.1158/0008-5472.CAN-08-0144
- Heneghan HM, Miller N, Lowery AJ, Sweeney KJ, Newell J, Kerin MJ. Circulating microRNAs as Novel Minimally Invasive Biomarkers for Breast Cancer. Ann Surg; 251:499-505; PMID:20134314; http://dx.doi.org/10.1097/SLA.0b013e3181cc939f
- Chen X, Ba Y, Ma L, Cai X, Yin Y, Wang K, Guo J, Zhang Y, Chen J, Guo X, et al. Characterization of microRNAs in serum: a novel class of biomarkers for diagnosis of cancer and other diseases. Cell Res 2008; 18:997-1006; PMID:18766170; http://dx.doi.org/10.1038/cr.2008.282
- Resnick KE, Alder H, Hagan JP, Richardson DL, Croce CM, Cohn DE. The detection of differentially expressed microRNAs from the serum of ovarian cancer patients using a novel real-time PCR platform. Gynecol Oncol 2009; 112:55-9; PMID:18954897; http://dx.doi.org/10.1016/j.ygyno.2008.08.036
- Tuoresmaki P, Vaisanen S, Neme A, Heikkinen S, Carlberg C. Patterns of genome-wide VDR locations. PloS one 2014; 9:e96105; PMID:24787735; http://dx.doi.org/10.1371/journal.pone.0096105
- Mi H, Lazareva-Ulitsky B, Loo R, Kejariwal A, Vandergriff J, Rabkin S, Guo N, Muruganujan A, Doremieux O, Campbell MJ, et al. The PANTHER database of protein families, subfamilies, functions and pathways. Nucleic Acids Res 2005; 33:D284-8; PMID:15608197; http://dx.doi.org/10.1093/nar/gki078
- Betel D, Wilson M, Gabow A, Marks DS, Sander C. The microRNA.org resource: targets and expression. Nucleic Acids Res 2008; 36:D149-53; PMID:18158296; http://dx.doi.org/10.1093/nar/gkm995
- Wang X. miRDB: a microRNA target prediction and functional annotation database with a wiki interface. Rna 2008; 14:1012-7; PMID:18426918; http://dx.doi.org/10.1261/rna.965408
- Grimson A, Farh KK, Johnston WK, Garrett-Engele P, Lim LP, Bartel DP. MicroRNA targeting specificity in mammals: determinants beyond seed pairing. Molecular cell 2007; 27:91-105; PMID:17612493; http://dx.doi.org/10.1016/j.molcel.2007.06.017
- Gamazon ER, Im HK, Duan S, Lussier YA, Cox NJ, Dolan ME, Zhang W. Exprtarget: an integrative approach to predicting human microRNA targets. PloS one 2010; 5:e13534; PMID:20975837; http://dx.doi.org/10.1371/journal.pone.0013534
- Machanick P, Bailey TL. MEME-ChIP: motif analysis of large DNA datasets. Bioinformatics 2011; 27:1696-7; PMID:21486936; http://dx.doi.org/10.1093/bioinformatics/btr189
- Stoppelenburg AJ, von Hegedus JH, Huis in't Veld R, Bont L, Boes M. Defective control of vitamin D receptor-mediated epithelial STAT1 signalling predisposes to severe respiratory syncytial virus bronchiolitis. J Pathol 2014; 232:57-64; PMID:24105653; http://dx.doi.org/10.1002/path.4267
- Doig CL, Singh PK, Dhiman VK, Thorne JL, Battaglia S, Sobolewski M, Maguire O, O'Neill LP, Turner BM, McCabe CJ, et al. Recruitment of NCOR1 to VDR target genes is enhanced in prostate cancer cells and associates with altered DNA methylation patterns. Carcinogenesis 2013; 34:248-56; PMID:23087083; http://dx.doi.org/10.1093/carcin/bgs331
- Ramagopalan SV, Heger A, Berlanga AJ, Maugeri NJ, Lincoln MR, Burrell A, Handunnetthi L, Handel AE, Disanto G, Orton SM, et al. A ChIP-seq defined genome-wide map of vitamin D receptor binding: associations with disease and evolution. Genome Res 2010; 20:1352-60; PMID:20736230; http://dx.doi.org/10.1101/gr.107920.110
- Heikkinen S, Väisänen S, Pehkonen P, Seuter S, Benes V, Carlberg C. Nuclear hormone 1α,25-dihydroxyvitamin D3 elicts a genome-wide shift in the locations of VDR chromatin accupancy. Nucl Acids Res 2011; 39:9181-93; PMID:21846776; http://dx.doi.org/10.1093/nar/gkr654
- Meyer MB, Goetsch PD, Pike JW. VDR/RXR and TCF4/β-catenin cistromes in colonic cells of colorectal tumor origin: iImpact on c-FOS and c-MYC gene expression. Mol Endocrinol 2012; 26:37-51; PMID:22108803; http://dx.doi.org/10.1210/me.2011-1109
- Team RC. R: A language and environment for statistical computing. R Foundation for Statistical Computing, Vienna, Austria. ISBN 3-900051-07-0, URL http://www.R-project.org/. 2013.
- Smyth GK. Linear models and empirical Bayes methods for assessing differential expression in microarray experiments. Stat Appl Genet Mol Biol 2004; 3:1-25; PMID:16646809.
- de Hoon MJ, Imoto S, Nolan J, Miyano S. Open source clustering software. Bioinformatics 2004; 20:1453-4; PMID:14871861; http://dx.doi.org/10.1093/bioinformatics/bth078
- Saldanha AJ. Java Treeview–extensible visualization of microarray data. Bioinformatics 2004; 20:3246-8; PMID:15180930; http://dx.doi.org/10.1093/bioinformatics/bth349
- Papadopoulos GL, Alexiou P, Maragkakis M, Reczko M, Hatzigeorgiou AG. DIANA-mirPath: Integrating human and mouse microRNAs in pathways. Bioinformatics 2009; 25:1991-3; PMID:19435746; http://dx.doi.org/10.1093/bioinformatics/btp299
- Ding N, Yu RT, Subramaniam N, Sherman MH, Wilson C, Rao R, Leblanc M, Coulter S, He M, Scott C, et al. A vitamin D receptor/SMAD genomic circuit gates hepatic fibrotic response. Cell 2013; 153:601-13; PMID:23622244; http://dx.doi.org/10.1016/j.cell.2013.03.028
- Goecks J, Nekrutenko A, Taylor J. Galaxy: a comprehensive approach for supporting accessible, reproducible, and transparent computational research in the life sciences. Genome Biol 2010; 11:R86; PMID:20738864; http://dx.doi.org/10.1186/gb-2010-11-8-r86
- Blankenberg D, Von Kuster G, Coraor N, Ananda G, Lazarus R, Mangan M, Nekrutenko A, Taylor J. Galaxy: a web-based genome analysis tool for experimentalists. Curr Protoc Mol Biol 2010; Chapter 19:Unit 19 0 1-21; PMID:20069535; http://dx.doi.org/10.1002/0471142727
- Giardine B, Riemer C, Hardison RC, Burhans R, Elnitski L, Shah P, Zhang Y, Blankenberg D, Albert I, Taylor J, et al. Galaxy: a platform for interactive large-scale genome analysis. Genome Res 2005; 15:1451-5; PMID:16169926; http://dx.doi.org/10.1101/gr.4086505
- Mooso B, Madhav A, Johnson S, Roy M, Moore ME, Moy C, Loredo GA, Mehta RG, Vaughan AT, Ghosh PM. Androgen Receptor regulation of Vitamin D receptor in response of castration-resistant prostate cancer cells to 1alpha-Hydroxyvitamin D5 - a calcitriol analog. Genes Cancer 2010; 1:927-40; PMID:21552398; http://dx.doi.org/10.1177/1947601910385450