
Abstract
Obesity is associated with endoplasmic reticulum (ER) stress and activation of the unfolded protein response (UPR) in adipose tissue. In this study we identify physiological triggers of ER stress and of the UPR in adipocytes in vitro. We show that two markers of adipose tissue remodelling in obesity, glucose starvation and hypoxia, cause ER stress in 3T3-F442A and 3T3-L1 adipocytes. Both conditions induced molecular markers of the IRE1α and PERK branches of the UPR, such as splicing of XBP1 mRNA and CHOP, as well as transcription of the ER stress responsive gene BiP. Hypoxia also induced an increase in phosphorylation of the PERK substrate eIF2α. By contrast, physiological triggers of ER stress in many other cell types, such as the saturated fatty acid palmitic acid, cholesterol, or several inflammatory cytokines including TNF-α, IL-1β, and IL-6, do not cause ER stress in 3T3-F442A and 3T3-L1 adipocytes. Our data suggest that physiological changes associated with remodelling of adipose tissue in obesity, such as hypoxia and glucose starvation, are more likely physiological ER stressors of adipocytes than the lipid overload or hyperinsulinemia associated with obesity.
Introduction
Obesity is the leading risk factor for type 2 diabetes, cardiovascular disease, and hypertension.Citation1,2 Obesity affects the homeostasis of the whole body but mainly the liver and the adipose tissue, and is characterized by low grade inflammation, hyperlipidemia, and insulin resistance in surrounding and peripheral tissues.Citation1,2 Adipose tissue is exposed to several stresses in obesity, including inflammation, hypoxia, and endoplasmic reticulum (ER) stress.Citation3 Limited angiogenesis, adipocyte hypertrophy and hyperplasia cause hypoxia in obese adipose tissue.Citation4 Secretion of MCP-1 by dysfunctional adipocytes attracts circulating monocytes into adipose tissue,Citation5,6 while a change in the adipokine profile, including decreased adiponectin and increased leptin secretion,Citation5 may contribute to the replacement of adipose tissue resident alternatively activated (M2) macrophages with classically activated (M1) macrophages.Citation6 While physiological causes of inflammation and hypoxia in adipose tissue have been characterized, little is known about the physiological triggers of ER stress in obese adipose tissue. At the molecular level, ER stress is caused by the build-up of misfolded proteins in the ER and activation of a signaling network called the unfolded protein response (UPR).Citation7 The UPR attempts to restore ER homeostasis by inducing expression of genes encoding molecular chaperones and protein foldases, lipid biosynthetic enzymes, and proteins involved in ER-associated protein degradation. If the ER stress cannot be resolved, the UPR promotes apoptosis. ER stress also plays key roles in both inflammation and insulin resistance in obesity and type 2 diabetes.Citation8,9
In mammalian cells, three UPR signaling cascades are initiated by the ER transmembrane proteins PERK, IRE1α, and ATF6. Phosphorylation of the translation initiation factor eIF2α by the protein kinase PERK inhibits general translation, but also stimulates translation of mRNAs harbouring several short upstream open reading frames in their 5' untranslated regions. This mechanism of translational activation results in induction of the transcription factors ATF4 and C/EBP homologous protein (CHOP).Citation10,11 CHOP reactivates protein synthesis and oxidation in the ER.Citation12 IRE1α up-regulates ER chaperone genes and genes involved in ER-associated protein degradation via endoribonuclease domain-induced splicing of X-box protein 1 (XBP1) mRNA.Citation13,14 The transcription factor ATF6 translocates to the nucleus after proteolytic release from the Golgi membrane by the Golgi proteases S1P and S2PCitation15 and induces expression of genes encoding ER resident molecular chaperones and proteins functioning in ER-associated protein degradation.Citation16,17 Upon prolonged or irremediable ER stress the UPR induces apoptosis via activation of JNKCitation18 by IRE1α and TRB3 by CHOP.Citation19
The physiological factors leading to ER stress and activation of the UPR in obese adipocytes are not well characterized. For several other cell types, including hepatocytes, pancreatic β cells, and macrophages physiological ER stressors have been reported. Saturated fatty acids (SFAs) or cholesterol loading induce an UPR in several cell types such as hepatocytes,Citation20,21 pancreatic β cells,Citation22 macrophages,Citation23 and preadipocytes.Citation24 Inflammatory cytokines such as TNF-α, IL-6 and IL-1β, which are secreted by stressed adipocytes or macrophages recruited into inflamed adipose tissue,Citation25 elicit an ER stress response in L929 myoblast cells and hepatocytes.Citation26,27 Glucose starvation is the earliest identified physiological ER stressor,Citation28,29 while the hypoxic environment of tumors induces an UPR in tumor cells.Citation30-32
The purpose of this study was to identify obesity-related physiological inducers of ER stress and the UPR in adipocytes by exposing in vitro differentiated 3T3-F442A adipocytes to several physiological ER stressors, including the SFA palmitic acid, cholesterol, inflammatory cytokines, glucose starvation, and hypoxia. We report that potent physiological ER stressors in other cell types, such as palmitic acid, cholesterol, or the inflammatory cytokines TNF-α, IL-1β, and IL-6, do not induce an ER stress response in in vitro differentiated 3T3-F442A and 3T3-L1 adipocytes. Glucose starvation and hypoxia, however, induce markers of ER stress, such as splicing of XBP1 mRNA, transcriptional activation of ER stress responsive genes including BiP and ERDJ4, CHOP and phosphorylation of eIF2α. Our results suggest that hypoxia and glucose starvation are likely physiological ER stressors for adipocytes in vivo.
Results
Palmitate does not induce ER stress in adipocytes
To identify which obesity-related physiological factors trigger the UPR in adipocytes, we exposed in vitro differentiated 3T3-F442A and 3T3-L1 adipocytes to several compounds whose plasma levels are elevated in obesity,Citation33-39 including palmitic acid, cholesterol, and the inflammatory cytokines TNF-α, IL-1β, and IL-6. 3T3-F442A adipocytes were chosen because these cells form normal adipose tissue without the addition of exogenous inducers when implanted subcutaneously into athymic mice.Citation40,41 3T3-L1 adipocytes were included to provide a second source of adipocytes. Both cell lines were differentiated for 12 d and the percentage of cells with an increased lipid content determined by flow cytometry with the fluorescent lipid probe nile red.Citation42 Flow cytometry revealed a mean fluorescence increase of 3.2 ± 0.2 fold upon differentiation of 3T3-L1 cells (). In differentiated 3T3-F442A cells 2 populations with 2.9 ± 0.1 fold and 25 ± 2 fold increases in nile red fluorescence were distinguishable (). A ∼3-fold increase in nile red fluorescence in differentiated 3T3-L1 adipocytes and the larger population of differentiated 3T3-F442A adipocytes is in good agreement with previously published increases in nile red fluorescence during differentiation of human adipocytesCitation43 and adipogenic differentiation of the murine embryonic stem cell line CGR8.Citation44 Quantitation of the histograms for the nile red fluorescence by constructing the probability distribution for the increase in nile red fluorescence upon differentiation and the constraint that the nile red fluorescence of adipocytes has to be greater by at least two standard deviations of the mean nile red fluorescence of undifferentiated cells than the nile red fluorescence of undifferentiated cells reveals that 72 ± 3% of the 3T3-L1 and 80 ± 1% of the 3T3-F442A cells acquired a lipid-laden phenotype. These degrees of differentiation are comparable to previously published data.Citation45
Figure 1. Adipocyte differentiation of 3T3-L1 and 3T3-F442A cells. (A and B) Nile red fluorescence, (C and D) side scatter (SSC-H), and (E and F) forward scatter (FSC-H) of (A, C, E) 3T3-L1 and (B, D, F) 3T3-F442A cells before (0 d, gray lines) and 12 d after induction of adipocyte differentiation (black lines). The light gray lines represent the autofluorescence of cells differentiated for 12 d. Dot plots of the side scatter SSC-H versus the forward scatter SSC-H for 3T3-L1 and 3T3-F442A cells before and 12 d after differentiation are shown in Figure S1. The mean nile red fluorescence of preadipocytes is significantly different from the mean nile red fluorescence of differentiated adipocytes in a one way analysis of variance (ANOVA) test with Dunnett's correction for multiple comparisonsCitation112,113 (P < 0.0001 for both 3T3-L1 and 3T3-F442A cells).
The granularity of cells increases during differentiation into adipocytes because of the accumulation of lipid droplets.Citation46 This increase in granularity is reflected by an increase in the side scatter of the exciting laser beamCitation47 and is also seen after differentiation of both 3T3-L1 and 3T3-F442A cells for 12 d (). The side scatter of the highly fluorescent 3T3-F442A adipocyte population (≥ 300 A.U. in ) is significantly higher than the side scatter of the weaker fluorescent population (<300 A. U., Fig. S2), suggesting that the highly fluorescent cells contain more lipid droplets than the weaker fluorescing population. Forward scatter, which is affected by cell size and shape,Citation47 decreases in 3T3-L1 cells and becomes more heterogeneous in 3T3-F442A cells (). Taken together, these data suggest that the majority of the 3T3-L1 and 3T3-F442A cells have acquired a lipid-laden phenotype 12 d after initiation of adipogenic differentiation.
To determine whether palmitic acid causes ER stress in adipocytes in vitro, 3T3-L1 and 3T3-F442A adipocytes were incubated with different concentrations (0–1 mM) of palmitate complexed to fatty acid-free bovine serum albumin (BSA) for up to 48 h. The activity of the PERK branch of the UPR was assessed by Western blotting for CHOP, while activation of IRE1α was monitored by measuring splicing of XBP1 mRNA. Exposure of adipocytes to up to 1 mM palmitate for 48 h did not elevate CHOP levels (), induce detectable levels of XBP1 splicing (, S3–7), or elevate mRNA levels for the ER stress responsive genes BiP (), CHOP (), or ERDJ4 () especially when compared to the large increases in mRNA levels of these genes and CHOP protein levels in thapsigargin-treated adipocytes ( and ). Treatment with palmitate complexed to BSA for 8 or 24 h did also not induce XBP1 splicing in 3T3-F442A adipocytes (Figs. S5–7). Palmitate did also not affect the viability of 3T3-F442A adipocytes over a period of up to 48 h, while incubation with 1 μM thapsigargin, which causes ER stress by depleting ER luminal Ca2+ stores,Citation48 for 48 h decreased viability by ∼37% (). Palmitate did also not inhibit insulin-stimulated AKT serine 473 phosphorylation in 3T3-F442A adipocytes (), which is consistent with several other reports.Citation49–56 To validate that our BSA-palmitate complexes induce ER stress, we characterized XBP1 splicing in undifferentiated preadipocytes exposed to palmitate complexed to BSA. Exposure of preadipocytes to palmitate complexed to BSA induces XBP1 splicing in these cells.Citation24 Indeed, palmitate induced XBP1 splicing in undifferentiated preadipocytes ( and S8) and also inhibited insulin action in these cells (). Collectively, these results show that the SFA palmitic acid does not induce ER stress in adipocytes.
Figure 2. Palmitate does not induce CHOP protein expression or XBP1 splicing in adipocytes. (A and B) CHOP expression in in vitro differentiated (A) 3T3-F442A adipocytes and (B) 3T3-L1 adipocytes exposed to the indicated concentrations of palmitate complexed to BSA for 48 h. Relative (rel.) CHOP signals were corrected for the loading controls GAPDH or β-actin. The bar graphs show the average and standard error of three independent repeats. Differences are not statistically significant (p = 0.42 for 3T3-F442A adipocytes and p = 0.10 for 3T3-L1 adipocytes in a repeated measures ANOVA test that compares the treated samples to the untreated sample. Equal variabilities of the differences were assumed for the treated and untreated samples and Dunnett's correction for multiple comparisonsCitation112,113 was used). 1 μM thapsigargin (Tg) was used as a positive control for induction of ER stress. Thapsigargin-treated samples were compared to untreated samples using a two-tailed, unpaired t-test. (C and D) XBP1 splicing in in vitro differentiated (C) 3T3-F442A adipocytes and (D) 3T3-L1 adipocytes incubated for 48 h with the indicated concentrations of BSA-complexed palmitate. % splicing indicates the percentage of spliced XBP1 mRNA, for which the average and standard error of three independent experiments are shown. Abbreviations: u—unspliced XBP1 mRNA, s—spliced XBP1 mRNA. (E) MTT assay on in vitro differentiated 3T3-F442A adipocytes incubated for 48 h with the indicated concentrations of BSA-complexed palmitate. A repeated measures ANOVA test was used to compare the treated samples to the untreated sample. Equal variabilities of the differences were assumed for the treated and untreated samples and Dunnett's correction for multiple comparisonsCitation112,113 was applied. (F) XBP1 splicing in 3T3-F442A preadipocytes incubated for 12 h with the indicated concentrations of BSA-complexed palmitate. Abbreviations: * – P < 0.05, ** – P < 0.01, *** – P < 0.001, and **** – P < 0.0001.
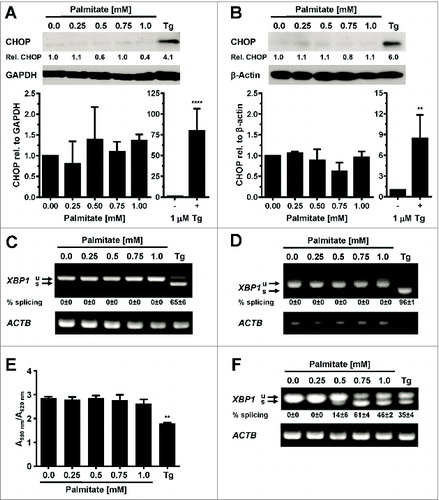
Figure 3. Palmitate does not induce BiP, CHOP, or ERDJ4 transcription in adipocytes. (A and B) BiP mRNA, (C and D) CHOP mRNA, and (E and F) ERDJ4 mRNA levels in in vitro differentiated (A, C, E) 3T3-F442A and (B, D, F) 3T3-L1 adipocytes incubated for 48 h with the indicated concentrations of BSA-complexed palmitate. The differences in BiP mRNA (p = 0.10 for 3T3-F442A adipocytes and p = 0.34 for 3T3-L1 adipocytes), CHOP mRNA (p = 0.11 for 3T3-F442A adipocytes and p = 0.41 for 3T3-L1 adipocytes), and ERDJ4 mRNA (p = 0.48 for 3T3-F442A adipocytes and p = 0.41 for 3T3-L1 adipocytes) levels in the untreated and palmitate treated samples are not statistically significant. A repeated measures ANOVA test with Dunnett's correction for multiple comparisonsCitation112,113 and assuming equal variabilities of the differences was used to compare the palmitate-treated samples to the untreated sample. Thapsigargin-treated samples were compared to untreated samples using a two-tailed, unpaired t-test.
Figure 4. Palmitate does not inhibit insulin signaling in 3T3-F442A adipocytes. (A) Serum-starved 3T3-F442A adipocytes and (B) serum-starved undifferentiated 3T3-F442A cells were treated with the indicated concentrations of BSA-complexed palmitic acid for 48 h before stimulation with 100 nM insulin for 15 min. Phosphorylation of AKT at serine 473 and total AKT levels were determined by Western blotting.
Cholesterol does not induce an UPR in adipocytes
To characterize whether cholesterol elicits ER stress in adipocytes we exposed differentiated 3T3-F442A and 3T3-L1 adipocytes to 100 μg/ml human acetylated low density lipoprotein (AcLDL) for 48 h. AcLDL did not elevate CHOP levels (), induce XBP1 splicing ( and S9A and B), or elevate BiP or CHOP mRNA levels (). We, therefore, repeated these experiments in the presence of the acyl-CoA:cholesterol acyltransferase (ACAT) inhibitor TMP-153 to inhibit cholesterol esterification and to elevate intracellular free cholesterol levels. After 24 h no changes in expression of CHOP or in XBP1 splicing were observed (data not shown). 48 h of treatment with AcLDL and TMP-153 did not increase CHOP protein levels (), induce XBP1 splicing (), or elevate the mRNA levels for BiP () or CHOP (). To validate that AcLDL can, in principle, activate the UPR, we repeated these experiments with in vitro differentiated THP-1 macrophages which are known to develop ER stress in response to cholesterol overloading.Citation57 In differentiated THP-1 macrophages AcLDL induced XBP1 splicing both in the presence and absence of TMP-153 ( and S9C). Treatment of THP-1 macrophages with TMP-153 alone also increased XBP1 splicing ∼2.6 fold ( and S9C). These results suggest that exposure of adipocytes to AcLDL does not cause ER stress.
Figure 5. Cholesterol loading does not induce CHOP protein expression or XBP1 splicing in adipocytes. (A and B) CHOP protein levels and (C and D) XBP1 splicing in in vitro differentiated (A and C) 3T3-F442A and (B and D) 3T3-L1 adipocytes incubated for 48 h with human acetylated LDL (AcLDL), AcLDL and 0.6 μM of the ACAT inhibitor TMP-153, 0.6 μM TMP-153, 1.0 μM Tg, or left untreated (‘-’). The average and standard error of 3 independent experiments are shown in the bar graphs. Differences in CHOP protein levels between the untreated sample and the samples treated with AcLDL, AcLDL and 0.6 μM TMP-153, and 0.6 μM TMP-153 are not statistically significant (p = 0.26 for 3T3-F442A adipocytes and p = 0.35 for 3T3-L1 adipocytes in a repeated measures ANOVA test with Dunnett's correction for multiple comparisonsCitation112,113 comparing the treated samples to the untreated samples and assuming equal variabilities of the differences). (E) XBP1 splicing in untreated in vitro differentiated human THP-1 macrophages and macrophages incubated for 16 h with AcLDL, AcLDL + 0.6 μM TMP-153, 0.6 μM TMP-153, or 1.0 μM Tg.
Figure 6. Cholesterol loading does not induce BiP or CHOP transcription in adipocytes. (A and B) BiP mRNA and (C and D) CHOP mRNA levels in in vitro differentiated (A and C) 3T3-F442A and (B and D) 3T3-L1 adipocytes incubated for 48 h with human acetylated LDL (AcLDL), AcLDL and 0.6 μM of the ACAT inhibitor TMP-153, 0.6 μM TMP-153, 1.0 μM Tg, or left untreated (‘-’). The average and standard error of three independent experiments are shown. Differences are not statistically significant (BiP mRNA: p = 0.34 for 3T3-F442A adipocytes and p = 0.11 for 3T3-L1 adipocytes; CHOP mRNA: p = 0.09 for 3T3-F442A adipocytes and p = 0.11 for 3T3-L1 adipocytes). p values were obtained from a repeated measures ANOVA test comparing the samples treated with AcLDL, AcLDL and 0.6 μM TMP-153, and 0.6 μM TMP-153 to the untreated samples and assuming equal variabilities of the differences. Dunnett's correction for multiple comparisonsCitation112,113 was applied. Thapsigargin-treated samples were compared to untreated samples using a two-tailed, unpaired t-test.
Proinflammatory cytokines do not induce ER stress in adipocytes
To study whether inflammatory cytokines induce ER stress in adipocytes we exposed differentiated 3T3-F442A adipocytes to various concentrations of TNF-α, IL-6, or IL-1β for up to 24 h. Incubation of adipocytes with increasing concentrations of TNF-α for 24 h did not affect the viability of these cells (), but also failed to induce XBP1 splicing ( and S10). Various concentrations of IL-6 and IL-1β also failed to induce XBP1 splicing over a period of 24 h ( and S11–12). To validate that the cytokines possess biological activity we characterized activation of the MAPK kinase JNK in preadipocytes. All three cytokines stimulated phosphorylation of JNK (), thus providing evidence that the cytokine preparations we utilized possess biological activity. Taken together, these data suggest that the inflammatory cytokines TNF-α, IL-6, and IL-1β do not cause ER stress in adipocytes.
Figure 7. The proinflammatory cytokines TNF-α, IL-6, and IL-1β do not induce ER stress in adipocytes. (A) MTT assay on in vitro differentiated 3T3-F442A adipocytes incubated for 24 h with the indicated concentrations of TNF-α. A repeated measures ANOVA test was used to compare the treated samples to the untreated sample. Equal variabilities of the differences were assumed for the treated and untreated samples and Dunnett's correction for multiple comparisonsCitation112,113 was applied. (B) XBP1 splicing in in vitro differentiated 3T3-F442A adipocytes incubated for 24 h with the indicated concentrations of TNF-α or 1.0 μM Tg. The average and standard error from three independent experiments are shown. (C) JNK phosphorylation in 3T3-F442A preadipocytes incubated for 30 min with 25 ng/ml TNF-α. (D and E) XBP1 splicing in in vitro differentiated 3T3-F442A adipocytes incubated for 24 h with the indicated concentrations of (D) IL-6 and (E) IL-1β. The average and standard error of two independent experiments are shown. (F) JNK phosphorylation in 3T3-F442A preadipocytes incubated for the indicated times with 200 ng/ml IL-6 or 200 ng/ml IL-1β.
Glucose starvation induces ER stress in adipocytes
Prolonged exposure of cells to glucose concentrations of <0.2 g/l induces the ER resident chaperones BiP and GRP94,Citation28,58 whose expression is controlled by XBP1 and ATF6. To characterize whether glucose starvation, which may be caused by the poor vascularization of the expanding adipose tissue in obesity, can induce ER stress in adipocytes, we maintained in vitro differentiated 3T3-F442A and 3T3-L1 adipocytes for up to 24 h in serum free medium supplemented with 2 mM L-glutamine but completely lacking glucose. Glutaminolysis serves as an energy source in this medium.Citation59,60 Glucose starvation for 24 h induced CHOP potently in both 3T3-F442A and 3T3-L1 adipocytes (). XBP1 splicing peaked 12 h after induction of glucose starvation (Fig. S13A) and remained elevated for the next 36 h in 3T3-F442A-adipocytes ( and S13B). 24 h of glucose starvation also induced XBP1 splicing in 3T3-L1 adipocytes and elevated the steady-state mRNA levels of CHOP, BiP, and ERDJ4, and, to a lesser extent, EDEM1 and VEGFA mRNAs in 3T3-F442A adipocytes (). Thus, glucose starvation causes ER stress in adipocytes which coincides with increased expression of the pro-angiogenic factor VEGFA.
Figure 8. Glucose starvation induces ER stress in adipocytes. (A) CHOP protein levels in in vitro differentiated 3T3-F442A and 3T3-L1 adipocytes maintained for 24 h in the presence of 4.5 g/l D-glucose (‘+ Glucose’) or without any glucose (‘- Glucose’). β-Actin was used as a loading control. (B) Quantitation of the Western blots shown in panel (A). (C) XBP1 splicing in in vitro differentiated 3T3-F442A and 3T3-L1 adipocytes maintained for 24 h in the presence of 4.5 g/l D-glucose or without any glucose. Below the images of the agarose gels the intensity of the ethidium bromide fluorescence was plotted vs. the migration distance of the PCR products. (D) Quantitation of XBP1 splicing shown in panel (C). For both cell lines the average and standard error of three independent repeats are shown. (E) Steady-state mRNA levels of CHOP, BiP, ERDJ4, EDEM1, and VEGFA mRNAs in 3T3-F442A adipocytes maintained for 24 h in the presence of 4.5 g/l D-glucose or without any glucose. p values were obtained from two-tailed, unpaired t-tests.
Hypoxia causes ER stress in adipocytes
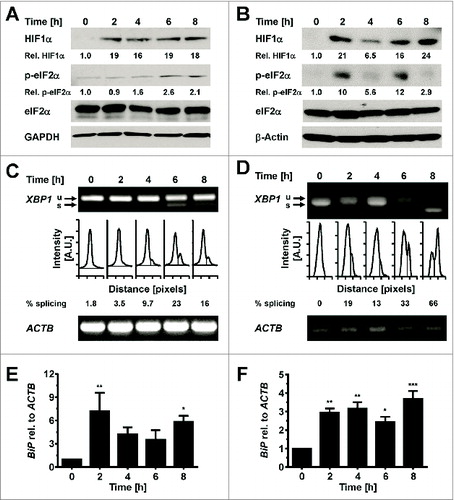
We characterized whether hypoxia causes ER stress in in vitro differentiated 3T3-F442A adipocytes, because hypoxia is another physiological alteration in poorly vascularized obese adipose tissue.Citation3 In vitro differentiated 3T3-F442A adipocytes were cultured in 0.5% O2 for up to 8 h before protein extraction and characterization of ER stress markers and the hypoxia marker HIF1αCitation61 by Western blotting. Hypoxia increased HIF1α levels within 2 h () and also led to an increase in eIF2α phosphorylation (), XBP1 splicing (), and BiP mRNA levels (). The increases in XBP1 splicing, BiP mRNA levels, and eIF2α phosphorylation, once manifested, persisted throughout the time course of the experiment. Collectively, these data show that hypoxia induces ER stress in adipocytes.
Figure 9. Hypoxia induces ER stress in adipocytes. (A and B) Induction of HIF1α and increased phosphorylation of eIF2α at serine 51 in in vitro differentiated (A) 3T3-F442A and (B) 3T3-L1 adipocytes incubated for the indicated times under 0.5% (v/v) O2. (C and D) XBP1 splicing in in vitro differentiated (C) 3T3-F442A and (D) 3T3-L1 adipocytes incubated for the indicated times under 0.5% (v/v) O2. Representative gels from three biological repeats are shown. (E and F) Steady-state BiP mRNA levels in in vitro differentiated 3T3-F442A (E) and 3T3-L1 (F) adipocytes incubated for the indicated times under 0.5% (v/v) O2 were determined by RT-qPCR. p values were obtained from a repeated measures ANOVA test comparing the treated samples to the untreated samples and assuming equal variabilities of the differences. Dunnett's correction for multiple comparisonsCitation112,113 was employed.
Discussion
We present evidence that glucose starvation and hypoxia (), but not palmitate ( and S3–7), cholesterol (, and S9), or several inflammatory cytokines ( and S10–12) cause ER stress in two in vitro adipocyte models, 3T3-F442A and 3T3-L1. These data suggest that the poor vascularization of adipose tissue in obesity causes ER stress in adipocytes, because adipose tissue expansion in obesity leads to formation of poorly vascularized, hypoxic areas.Citation3,4 Glucose starvation may contribute to the adverse effects of hypoxia on adipose tissue, because obese adipocytes reach diameters that are comparable to the maximum distance of diffusive glucose supply from a blood vessel.Citation62–64 The large overlap of the effects of hypoxia and ER stress on adipose tissue, including inflammation,Citation4 insulin resistance,Citation65 changes in adiponectin secretion,Citation66 and increased angiogenesis,Citation67-69 suggests that ER stress may contribute to or mediate the effects of hypoxia on adipocytes.
Our work also suggests that palmitate, cholesterol, and inflammatory cytokines do not elicit an ER stress response in adipocytes. The mRNA expression for two ER stress sensors, IRE1α and PERK, is similar in preadipocytes and adipocytes (Fig. S14), which suggests that increased basal activity of these ER stress signaling pathways cannot explain the protection of adipocytes from palmitate- or cholesterol-induced ER stress. A dominant feature of adipocyte differentiation is the induction of nearly all enzymes of fatty acid and triacylglycerol synthesis, including stearoyl-CoA desaturases and diacylglycerol acyltransferases.Citation70,71 Hence, adipocytes may be protected from palmitate-induced ER stress because of their greatly increased ability to dispose of excess palmitate in their triacylglycerol pool.Citation72 The expansion of the triacylglycerol pool will also increase the storage capacity of adipocytes for cholesterolCitation73,74 and thus may explain why cholesterol does not induce ER stress in adipocytes. Increased cholesterol efflux due to increased expression of the cholesterol transporter ABCA1Citation75,76 may also contribute to this cholesterol resistance. Induction of several antioxidant enzymesCitation77-79 and increased NADPH generationCitation80 may protect adipocytes against ER stress caused by inflammatory cytokines, because these cytokines cause ER stress via production of reactive oxygen species.Citation27,81,82
Our conclusions differ from conclusions drawn in other studies, which suggest that TNF-α,Citation83 free fatty acids,Citation84-87 and cholesterolCitation88 induce ER stress in adipocytes in vitro. Koh et al.Citation83 and Jeon et al.Citation85 have reported that TNF-α and palmitate elevate phosphorylation of eIF2α, induce ATF3 mRNA and activate JNK in 3T3-L1 adipocytes and, on the basis of these changes, concluded that TNF-α and palmitate cause ER stress in adipocytes. eIF2α phosphorylation and the increase in ATF3 mRNA downstream of eIF2α phosphorylation are controlled by four protein kinasesCitation89 of which only PERK directly responds to ER stress.Citation90 JNK is activated by many stresses.Citation91 The absence of an increase in XBP1 splicing (, , S3–7, and S10), which is a more specific marker for ER stress, suggests that other stresses are responsible for the increase in the stress markers monitored by Koh et al.Citation83 and Jeon et al.Citation85 Kawasaki et al.Citation86 have reported that exposure of 3T3-L1 adipocytes to 50 μg/ml of a free fatty acid mixture derived from human serum induces XBP1 splicing, ATF4, BiP, CHOP, EDEM, ERDJ4, and PDI mRNAs. Palmitic acid is considered to be the fatty acid with the greatest potential for cell injury,Citation92 but elicits ER stress, insulin resistance, or cell injury only at much higher concentrations in several cell types ( and refs. 21, 22, 24, 93) and does not induce ER stress in 3T3-F442A or 3T3-L1 adipocytes (, and S3–7). Therefore, compounds other than the SFAs present in the fatty acid mixture used by Kawasaki et al.Citation86 seem to be causing ER stress in adipocytes. Jiao et al.Citation87 reported that a mixture of lauric, myristic, oleic, linoleic, and arachidonic acids induces ER stress and potently inhibits insulin-stimulated AKT serine 473 and threonine 308 phosphorylation in in vitro differentiated 3T3-L1 adipocytes. These results contradict not only our observations (, and S3–7) but also several other papers which have reported that the unsaturated fatty acids oleic and linoleic acid protect cells from the negative effects of SFAs,Citation94–100 that the medium-chain fatty acids lauric and myristic acid do not induce insulin resistance,Citation52 and that palmitate does not affect insulin-stimulated AKT phosphorylation in adipocytes.Citation49–56 Chen et al.Citation88 reported that oxidized LDL (oxLDL) induces BiP and CHOP in 3T3-L1 adipocytes and suggested that intracellular cholesterol overload may be partially responsible for this ER stress response. Both AcLDL and oxLDL are taken up via the scavenger receptor A by adipocytes.Citation101 We have not observed activation of XBP1 splicing in 3T3-F442A or 3T3-L1 adipocytes exposed to AcLDL ( and S9), which suggests that an oxidized lipid or oxidized protein component of oxLDL,Citation102 but not cholesterol, induces ER stress in adipocytes in vitro.
In conclusion, our work shows that glucose and oxygen deprivation cause ER stress in adipocytes in vitro. In obesity, the rapid expansion of the adipose tissue rather than elevated SFAs, cholesterol, or proinflammatory cytokine levels, may be responsible for ER stress in adipocytes. Future work should address whether improved vascularization of obese adipose tissue, either through genetic or pharmacologic means, can mitigate ER stress in this tissue.
Materials and Methods
Antibodies and reagents
Antibodies against AKT (cat. no. 4691), phosphoserine 473-AKT (cat. no. 4060), CHOP (cat. no. 2895), phospho-JNK (cat. no. 4668), JNK (cat. no. 9258), and phospho-eIF2α (cat. no. 9721) were purchased from Cell Signaling Technology Inc. The anti-eIF2α antibody (cat. no. sc-11386) was purchased from Santa Cruz Biotechnology Inc., the anti-HIF1α antibody (cat. no. AF1935) from R&D Systems, the anti-GAPDH antibody (cat. no. G8795) and the monoclonal anti-β-actin antibody (cat. no. A2228) from Sigma-Aldrich. The goat anti-rabbit-IgG (H+L)-horseradish peroxidase (HRP)-conjugated secondary antibody (cat. no. 7074S) was bought from Cell Signaling Technology Inc. The goat anti-mouse IgG (H+L)-HRP-conjugated antibody (cat. no. 31432) and the mouse anti-goat IgG (H+L)-HRP-conjugated antibody (cat. no. 31400) were purchased from Thermo Fisher Scientific. Thapsigargin, dexamethasone (cat. no. D4902), 3-isobutyl-1-methylxanthine (IBMX, cat. no. I5879), insulin (cat. no. I0516), palmitic acid (cat. no. P5585), fatty acid free bovine serum albumin (BSA, cat. no. A3803), BSA (cat. no. A2153), and thiazolyl blue tetrazolium bromide (MTT, cat. no. M5655), and 9-diethylamino-5H-benzo[α]phenoxazine-5-one (nile red, cat. no. N3013) were purchased from Sigma-Aldrich. TMP-153 was purchased from Enzo Life Sciences. AcLDL (cat. no. 5685–3404) was purchased from AbD Serotec, IL-1β (cat. no. RIL1BI) from Thermo Fisher Scientific, IL-6 (cat. no. PHC0066) from Life Technologies, and human TNF-α (cat. no. 8902) from Cell Signaling Technology Inc.
Cell culture
3T3-L1 murine preadipocytesCitation103 were obtained from the ATCC and were maintained as subconfluent cultures in Dulbecco's modified Eagle's medium (DMEM) supplemented with 4.5 g/l D-glucose, 2 mM L-glutamine and 10% (v/v) bovine calf serum. 3T3-F442A murine preadipocytesCitation104 were maintained in DMEM supplemented with 4.5 g/l D-glucose, 2 mM L-glutamine and 10% (v/v) foetal bovine serum (FBS). For differentiation,Citation45 both cell lines were grown to confluence. Two days post-confluency, differentiation was induced by addition of 1 μg/ml insulin, 0.5 mM IBMX, and 0.25 μM dexamethasone. The cells were maintained in this medium for 3 d and then for 2 more days in medium containing 1 μg/ml insulin. After five days of differentiation insulin was omitted from the medium and the cells were maintained for another 7 d. In all experiments both 3T3-F442A and 3T3-L1 adipocytes were used 12 d after induction of differentiation. The THP-1 human monocytic leukemia cell lineCitation105 was maintained in RPMI 1640 medium containing 10% (v/v) foetal bovine serum (FBS) and 2 mM L-glutamine. The cells were differentiated into macrophages by incubation with 50 nM phorbol-12-myristate 13-acetate (PMA) for 3 d, followed by incubation for 1 d without PMA.Citation106 Before addition of AcLDL or TMP-153 the cells were serum-starved for 7 h.
Flow cytometry
Cells were stained with nile red and analyzed by flow cytometry essentially as described before.Citation42 In brief, cells were trypsinized, washed once with DMEM supplemented with 4.5 g/l D-glucose, 2 mM L-glutamine and 10% (v/v) bovine calf serum, and then with phosphate-buffered saline (PBS, 4.3 mM Na2HPO4, 1.47 mM KH2PO4, 27 mM KCl, 137 mM NaCl, pH 7.4), stained for 5 min with 100 ng/ml nile red in PBS, washed once with PBS and immediately analyzed by flow cytometry on a BD FACSCalibur Flow Cytometer (BD Biosciences) at a LO flow rate. For each sample ∼50,000 gated events were collected. Nile red fluorescence was excited at 488 nm and its fluorescence emission collected using the FL-1 (530/30 nm) band pass filter set. The instrument settings for 3T3-L1 cells were FSC—E-1 (lin, Amp gain = 4.50), SSC—326 V (lin, Amp gain = 1.00), and FL1—275 V (log, Amp gain = 1.00), and for 3T3-F442A cells FSC—E-1 (lin, Amp gain = 4.50), SSC—280 V (lin, Amp gain = 1.00), and FL1—275 V (log, Amp gain = 1.00). No thresholds were applied. Data were analyzed in WinMDI 2.9 and graphs prepared in GraphPad Prism 6.04 (GraphPad Software). Three biological replicates were analyzed for each sample and results are represented as the average and standard error of these three repeats.
Cell viability was determined using the MTT assay.Citation107 In short, after TNF-α or palmitate treatment cells were incubated for 4 h at 37°C with 0.5 g/l MTT in phenol-red free DMEM containing 4.5 g/l D-glucose, and 2 mM L-glutamine or 2% (w/v) BSA, respectively. Insoluble formazan crystals were dissolved for 15 min in isopropanol containing 4 mM HCl and 0.1% (v/v) Nonidet P-40. The absorbance of the formazan solution was read at a wavelength of 590 nm and a reference wavelength of 620 nm and the formazan absorbance expressed as the ratio of the absorbance at 590 nm to the absorbance at 620 nm.
Palmitate treatment
In vitro differentiated 3T3-F442A adipocytes were serum-starved overnight in DMEM containing 4.5 g/l D-glucose, and 2 mM L-glutamine and then incubated in serum-free medium containing 2% (w/v) fatty acid-free BSA and 0.05—1 mM palmitic acid. These palmitate concentrations are in the physiological range reported for rodents and humans.Citation108 Palmitic acid was complexed to fatty acid-free BSA as follows. In brief, palmitic acid was dissolved in ethanol and diluted 1:100 in DMEM containing 4.5 g/l D-glucose and 2% (w/v) fatty acid-free BSA before addition to the cells. Control cells received ethanol diluted 1:100 into DMEM containing 4.5 g/l D-glucose and 2% (w/v) fatty acid-free BSA.Citation109
Cholesterol and cytokine treatments
In vitro differentiated adipocytes were incubated in DMEM containing 4.5 g/l D-glucose, 2 mM L-glutamine, and 100 μg/ml AcLDL in the presence or absence of the ACAT inhibitor TMP-153 at a final concentration of 0.6 μM. The cells were incubated with cytokines in serum-free medium.
D-Glucose starvation experiments were performed by incubating the cells for the indicated times in D-glucose-free DMEM supplemented with 2 mM L-glutamine. Control cells ‘+ D-glucose’ were incubated for the same time in DMEM containing 4.5 g/l D-glucose and 2 mM L-glutamine.
Hypoxia experiments were performed using a Billups-Rotenberg hypoxia chamber. A pre-analyzed gas mixture of 0.5% (v/v) O2, 5% (v/v) CO2 and nitrogen (BOC Industrial Gases) was flushed through the chamber at a flow rate of 25 l/min for 5 min to completely replace air inside the chamber with the gas mixture. The hypoxia chamber was incubated at 37°C for the indicated times. Cells were rapidly harvested and lysed at 4ºC using degassed buffers as described before.Citation110
RNA analysis
RNA was extracted and analyzed by reverse transcriptase (RT) PCR as described before.Citation110 Primers for quantitative PCR (qPCR) are listed in . RT-qPCR data were standardized to ACTB as loading control. The percentage of XBP1 splicing was calculated by dividing the signal for spliced XBP1 mRNA by the sums of the signals for spliced and unspliced XBP1 mRNAs. Band intensities were quantitated using ImageJ.
Table 1. Oligodeoxynucleotides. The HUGO Gene Nomenclature Committee gene names are given in brackets where these deviate from the commonly used gene names.
Protein extraction and Western blotting
Cells were washed 3 times with ice-cold PBS and lysed in RIPA buffer [50 mM Tris-HCl, pH 8.0, 150 mM NaCl, 0.5% (w/v) sodium deoxycholate, 0.1% (v/v) Triton X-100, 0.1% (w/v) SDS] containing Roche complete protease inhibitors (cat. no. 11836153001, Roche Applied Science) and phosphatase inhibitors (cat. no. 04 906 837 001, Roche Applied Science) as described before.Citation110
Proteins were separated by SDS-PAGE on 4–20% Criterion TGX Precast gels (cat. no. 567–1094, Bio-Rad Laboratories) and transferred to polyvinylidene difluoride (PVDF) membranes (Amersham HyBondTM-P, pore size 0.45 μm, cat. no. RPN303F, GE Healthcare) by semi-dry electrotransfer in 0.1 M Tris, 0.192 M glycine, and 5% (v/v) methanol at 2 mA/cm2 for 60–75 min. Membranes were then blocked for 1 h in 5% (w/v) skimmed milk powder in TBST [20 mM Tris-HCl, pH 7.6, 137 mM NaCl, and 0.1% (v/v) Tween-20] for antibodies against non-phosphorylated proteins and 5% BSA in TBST for antibodies against phosphorylated proteins. Incubations with antibodies were performed over night at 4°C with gentle agitation. Blots were washed three times with TBST and then probed with secondary antibody for 1 hour at room temperature. The rabbit anti-AKT, anti-phospho-S473-AKT, anti-phospho-S51-eIF2α, anti-JNK and anti-phospho-JNK antibodies were used at a 1:1,000 dilution in TBST + 5% (w/v) BSA. The rabbit anti-eIF2α antibody was used at a 1:500 dilution in TBST + 5% (w/v) skimmed milk powder. Membranes were developed with goat anti-rabbit-IgG (H+L)-horseradish peroxidase (HRP)-conjugated secondary antibody at a 1:1,000 dilution in TBST + 5% (w/v) skimmed milk powder for 1 h at room temperature. The mouse anti-CHOP antibody and anti-β-actin antibodies were used at a 1:1,000 dilution in TBST + 5% (w/v) skimmed milk powder, and the mouse anti-GAPDH antibody at a 1:30,000 dilution in TBST + 5% (w/v) skimmed milk powder. These antibodies were developed with goat anti-mouse IgG (H+L)-horseradish peroxidase (HRP)-conjugated secondary antibody at a 1:20,000 dilution in TBST +5% (w/v) skimmed milk powder for 1 h at room temperature. The goat anti-HIF1α antibody was used at a dilution of 1:500 in TBST + 5% (w/v) skimmed milk powder and developed with mouse anti-goat IgG (H+L)-HRP-conjugated antibody at a dilution of 1:30,000 in TBST + 5% (w/v) skimmed milk powder for 1 h at room temperature. To reprobe blots for detection of nonphosphorylated proteins, membranes were stripped using Restore Western Blot Stripping Buffer (Thermo Fisher Scientific, Loughborough, UK, cat. no. 21059) and blocked with 5% (w/v) skimmed milk powder in TBST.
For signal detection, Pierce ECL Western Blotting Substrate (cat. no. 32209) or Pierce ECL Plus Western Blotting Substrate (cat. no. 32132) from Thermo Fisher Scientific were used. Blots were exposed to CL-X PosureTM film (cat. no. 34091, Thermo Fisher Scientific). Exposure times were adjusted on the basis of previous exposures to obtain exposures in the linear range of the film. Films were scanned on a CanoScan LiDE 600F scanner (Canon) and saved as tif files. Bands were quantified using ImageJ exactly as described under the heading “Gels Submenu” on the ImageJ web site (http://rsb.info.nih.gov/ij/docs/menus/analyze.html#plot). Peak intensities for the experimental antibody were then divided by the peak intensities obtained with the antibody for the loading control in the corresponding lane to correct for differences in loading between individual lanes. All loading control-corrected peak intensities obtained for one Western blot were then expressed relative to the loading control-corrected peak intensity of the 0 h sample.
Statistical analysis
All data are presented as the average and standard error of three independently differentiated adipocyte cultures. Errors were propagated using the law of error propagation for random, independent errors.Citation111 Statistical analyses were performed in GraphPad Prism 6.04. The statistical tests and corrections for multiple comparison used to analyze the data are described in detail in the figure legends.
Disclosure of Potential Conflicts of Interest
No potential conflicts of interest were disclosed.
Supplemental Material
Supplemental data for this article can be accessed on the publisher's website.
989728_Supplementary_Materials.zip
Download Zip (968.6 KB)Acknowledgments
ADM and MS devised the study, analyzed the data, designed the experiments and wrote the manuscript. We thank A Benham (Durham University) for providing the human THP-1 cells and C. Hutchison (Durham University) for providing the 3T3-F442A preadipocytes. We thank O Alainis and C Manning for help with the flow cytometry, and N Hole for use of the hypoxia chamber.
Funding
This work was supported by Diabetes UK BDA 09/0003949 grant.
References
- Hotamisligil GS. Inflammation and metabolic disorders. Nature 2006; 444:860-7; PMID:17167474; http://dx.doi.org/10.1038/nature05485
- Van Gaal LF, Mertens IL, De Block CE. Mechanisms linking obesity with cardiovascular disease. Nature 2006; 444:875-80; PMID:17167476; http://dx.doi.org/10.1038/nature05487
- Sun K, Kusminski CM, Scherer PE. Adipose tissue remodeling and obesity. J Clin Invest 2011; 121:2094-101; PMID:21633177; http://dx.doi.org/10.1172/JCI45887
- Ye J, Gao Z, Yin J, He Q. Hypoxia is a potential risk factor for chronic inflammation and adiponectin reduction in adipose tissue of ob/ob and dietary obese mice. Am J Physiol Endocrinol Metab 2007; 293: E1118-28; PMID:17666485; http://dx.doi.org/10.1152/ajpendo.00435.2007
- Coenen KR, Gruen ML, Chait A, Hasty AH. Diet-induced increases in adiposity, but not plasma lipids, promote macrophage infiltration into white adipose tissue. Diabetes 2007; 56:564-73; PMID:17327423; http://dx.doi.org/10.2337/db06-1375
- Lumeng CN, Bodzin JL, Saltiel AR. Obesity induces a phenotypic switch in adipose tissue macrophage polarization. J Clin Invest 2007; 117:175-84; PMID:17200717; http://dx.doi.org/10.1172/JCI29881
- Schröder M. Endoplasmic reticulum stress responses. Cell Mol Life Sci 2008; 65:862-94; PMID:18038217; http://dx.doi.org/10.1007/s00018-007-7383-5
- Zhang K, Kaufman RJ. From endoplasmic-reticulum stress to the inflammatory response. Nature 2008; 454:455-62; PMID:18650916; http://dx.doi.org/10.1038/nature07203
- Samuel VT, Shulman GI. Mechanisms for insulin resistance: common threads and missing links. Cell 2012; 148:852-71; PMID:22385956; http://dx.doi.org/10.1016/j.cell.2012.02.017
- Gregor MF, Hotamisligil GS. Adipocyte stress: the endoplasmic reticulum and metabolic disease. J Lipid Res 2007; 48:1905-14; PMID:17699733; http://dx.doi.org/10.1194/jlr.R700007-JLR200
- Schröder M, Kaufman RJ. ER stress and the unfolded protein response. Mutat Res 2005; 569:29-63; PMID:15603751; http://dx.doi.org/10.1016/j.mrfmmm.2004.06.056
- Marciniak SJ, Yun CY, Oyadomari S, Novoa I, Zhang Y, Jungreis R, Nagata K, Harding HP, Ron D. CHOP induces death by promoting protein synthesis and oxidation in the stressed endoplasmic reticulum. Genes Dev 2004; 18:3066-77; PMID:15601821; http://dx.doi.org/10.1101/gad.1250704
- Calfon M, Zeng H, Urano F, Till JH, Hubbard SR, Harding HP, Clark SG, Ron D. IRE1 couples endoplasmic reticulum load to secretory capacity by processing the XBP-1 mRNA. Nature 2002; 415:92-6; PMID:11780124; http://dx.doi.org/10.1038/415092a
- Yoshida H, Matsui T, Yamamoto A, Okada T, Mori K. XBP1 mRNA is induced by ATF6 and spliced by IRE1 in response to ER stress to produce a highly active transcription factor. Cell 2001; 107:881-91; PMID:11779464; http://dx.doi.org/10.1016/S0092-8674(01)00611-0
- Ye J, Rawson RB, Komuro R, Chen X, Dave UP, Prywes R, Brown MS, Goldstein JL. ER stress induces cleavage of membrane-bound ATF6 by the same proteases that process SREBPs. Mol Cell 2000; 6:1355-64; PMID:11163209; http://dx.doi.org/10.1016/S1097-2765(00)00133-7
- Wu J, Rutkowski DT, Dubois M, Swathirajan J, Saunders T, Wang J, Song B, Yau GD-Y, Kaufman RJ. ATF6α optimizes long-term endoplasmic reticulum function to protect cells from chronic stress. Dev Cell 2007; 13:351-64; PMID:17765679; http://dx.doi.org/10.1016/j.devcel.2007.07.005
- Yamamoto K, Sato T, Matsui T, Sato M, Okada T, Yoshida H, Harada A, Mori K. Transcriptional induction of mammalian ER quality control proteins is mediated by single or combined action of ATF6α and XBP1. Dev Cell 2007; 13:365-76; PMID:17765680; http://dx.doi.org/10.1016/j.devcel.2007.07.018
- Nishitoh H, Matsuzawa A, Tobiume K, Saegusa K, Takeda K, Inoue K, Hori S, Kakizuka A, Ichijo H. ASK1 is essential for endoplasmic reticulum stress-induced neuronal cell death triggered by expanded polyglutamine repeats. Genes Dev 2002; 16:1345-55; PMID:12050113; http://dx.doi.org/10.1101/gad.992302
- Ohoka N, Yoshii S, Hattori T, Onozaki K, Hayashi H. TRB3, a novel ER stress-inducible gene, is induced via ATF4-CHOP pathway and is involved in cell death. EMBO J 2005; 24:1243-55; PMID:15775988; http://dx.doi.org/10.1038/sj.emboj.7600596
- Özcan U, Cao Q, Yilmaz E, Lee A-H, Iwakoshi NN, Ozdelen E, Tuncman G, Görgün C, Glimcher LH, Hotamisligil GS. Endoplasmic reticulum stress links obesity, insulin action, and type 2 diabetes. Science 2004; 306:457-61; PMID:15486293; http://dx.doi.org/10.1126/science.1103160
- Wei Y, Wang D, Topczewski F, Pagliassotti MJ. Saturated fatty acids induce endoplasmic reticulum stress and apoptosis independently of ceramide in liver cells. Am J Physiol Endocrinol Metab 2006; 291:E275-81; PMID:16492686; http://dx.doi.org/10.1152/ajpendo.00644.2005
- Laybutt DR, Preston AM, Åkerfeldt MC, Kench JG, Busch AK, Biankin AV, Biden TJ. Endoplasmic reticulum stress contributes to beta cell apoptosis in type 2 diabetes. Diabetologia 2007; 50:752-63; PMID:17268797; http://dx.doi.org/10.1007/s00125-006-0590-z
- DeVries-Seimon T, Li Y, Yao PM, Stone E, Wang Y, Davis RJ, Flavell R, Tabas I. Cholesterol-induced macrophage apoptosis requires ER stress pathways and engagement of the type A scavenger receptor. J Cell Biol 2005; 171:61-73; PMID:16203857; http://dx.doi.org/10.1083/jcb.200502078
- Guo W, Wong S, Xie W, Lei T, Luo Z. Palmitate modulates intracellular signaling, induces endoplasmic reticulum stress, and causes apoptosis in mouse 3T3-L1 and rat primary preadipocytes. Am J Physiol Endocrinol Metab 2007; 293:E576-86; PMID:17519282; http://dx.doi.org/10.1152/ajpendo.00523.2006
- Antuna-Puente B, Feve B, Fellahi S, Bastard J-P. Adipokines: the missing link between insulin resistance and obesity. Diabetes Metab 2008; 34:2-11; PMID:18093861; http://dx.doi.org/10.1016/j.diabet.2007.09.004
- Zhang K, Shen X, Wu J, Sakaki K, Saunders T, Rutkowski DT, Back SH, Kaufman RJ. Endoplasmic reticulum stress activates cleavage of CREBH to induce a systemic inflammatory response. Cell 2006; 124:587-99; PMID:16469704; http://dx.doi.org/10.1016/j.cell.2005.11.040
- Xue X, Piao J-H, Nakajima A, Sakon-Komazawa S, Kojima Y, Mori K, Yagita H, Okumura K, Harding H, Nakano H. Tumor necrosis factor α (TNFα) induces the unfolded protein response (UPR) in a reactive oxygen species (ROS)-dependent fashion, and the UPR counteracts ROS accumulation by TNFα. J Biol Chem 2005; 280:33917-25; PMID:16107336; http://dx.doi.org/10.1074/jbc.M505818200
- Shiu RP, Pouyssegur J, Pastan I. Glucose depletion accounts for the induction of two transformation-sensitive membrane proteins in Rous sarcoma virus-transformed chick embryo fibroblasts. Proc Natl Acad Sci U S A 1977; 74:3840-4; PMID:198809; http://dx.doi.org/10.1073/pnas.74.9.3840
- Lin AY, Lee AS. Induction of two genes by glucose starvation in hamster fibroblasts. Proc Natl Acad Sci U S A 1984; 81:988-92; PMID:6583707; http://dx.doi.org/10.1073/pnas.81.4.988
- Romero-Ramirez L, Cao H, Nelson D, Hammond E, Lee A-H, Yoshida H, Mori K, Glimcher LH, Denko NC, Giaccia AJ, et al. XBP1 is essential for survival under hypoxic conditions and is required for tumor growth. Cancer Res 2004; 64:5943-7; PMID:15342372; http://dx.doi.org/10.1158/0008-5472.CAN-04-1606
- Koumenis C, Naczki C, Koritzinsky M, Rastani S, Diehl A, Sonenberg N, Koromilas A, Wouters BG. Regulation of protein synthesis by hypoxia via activation of the endoplasmic reticulum kinase PERK and phosphorylation of the translation initiation factor eIF2α. Mol Cell Biol 2002; 22:7405-16; PMID:12370288; http://dx.doi.org/10.1128/MCB.22.21.7405-7416.2002
- Bi MX, Naczki C, Koritzinsky M, Fels D, Blais J, Hu NP, Harding H, Novoa I, Varia M, Raleigh J, et al. ER stress-regulated translation increases tolerance to extreme hypoxia and promotes tumor growth. EMBO J 2005; 24:3470-81; PMID:16148948; http://dx.doi.org/10.1038/sj.emboj.7600777
- Hotamisligil GS, Arner P, Caro JF, Atkinson RL, Spiegelman BM. Increased adipose tissue expression of tumor necrosis factor-α in human obesity and insulin resistance. J Clin Invest 1995; 95:2409-15; PMID:7738205; http://dx.doi.org/10.1172/JCI117936
- Kern PA, Ranganathan S, Li C, Wood L, Ranganathan G. Adipose tissue tumor necrosis factor and interleukin-6 expression in human obesity and insulin resistance. Am J Physiol Endocrinol Metab 2001; 280:E745-51; PMID:11287357
- Misaki Y, Miyauchi R, Mochizuki K, Takabe S, Shimada M, Ichikawa Y, Goda T. Plasma interleukin-1β concentrations are closely associated with fasting blood glucose levels in healthy and preclinical middle-aged nonoverweight and overweight Japanese men. Metabolism 2010; 59:1465-71; PMID:20170929; http://dx.doi.org/10.1016/j.metabol.2010.01.011
- Spranger J, Kroke A, Möhlig M, Hoffmann K, Bergmann MM, Ristow M, Boeing H, Pfeiffer AFH. Inflammatory cytokines and the risk to develop type 2 diabetes: results of the prospective population-based European Prospective Investigation into Cancer and Nutrition (EPIC)-Potsdam Study. Diabetes 2003; 52:812-7; PMID:12606524; http://dx.doi.org/10.2337/diabetes.52.3.812
- Tremblay AJ, Després JP, Piché ME, Nadeau A, Bergeron J, Alméras N, Tremblay A, Lemieux S. Associations between the fatty acid content of triglyceride, visceral adipose tissue accumulation, and components of the insulin resistance syndrome. Metabolism 2004; 53:310-7; PMID:15015142; http://dx.doi.org/10.1016/j.metabol.2003.10.011
- Sorensen TI, Andersen B, Kam-Hansen L. Total plasma cholesterol in obesity after jejunoileal bypass with 3:1 or 1:3 jejunoileal ratio. A randomized trial. Scand J Gastroenterol 1979; 14:865-8; PMID:395631; http://dx.doi.org/10.3109/00365527909181417
- Dobrea GM, Wieland RG, Johnson MW. The effect of rapid weight loss due to jejunoileal bypass on total cholesterol and high-density lipoprotein. Am J Clin Nutr 1981; 34:1994-6; PMID:7293931
- Green H, Kehinde O. Formation of normally differentiated subcutaneous fat pads by an established preadipose cell line. J Cell Physiol 1979; 101:169-71; PMID:541350; http://dx.doi.org/10.1002/jcp.1041010119
- Mandrup S, Loftus TM, MacDougald OA, Kuhajda FP, Lane MD. Obese gene expression at in vivo levels by fat pads derived from s.c. implanted 3T3-F442A preadipocytes. Proc Natl Acad Sci U S A 1997; 94:4300-5; PMID:9113984; http://dx.doi.org/10.1073/pnas.94.9.4300
- Greenspan P, Mayer EP, Fowler SD. Nile red: a selective fluorescent stain for intracellular lipid droplets. J Cell Biol 1985; 100:965-73; PMID:3972906; http://dx.doi.org/10.1083/jcb.100.3.965
- Crandall DL, Quinet EM, Morgan GA, Busler DE, McHendry-Rinde B, Kral JG. Synthesis and secretion of plasminogen activator inhibitor-1 by human preadipocytes. J Clin Endocrinol Metab 1999; 84:3222-7; PMID:10487691; http://dx.doi.org/10.1210/jcem.84.9.5987
- Schaedlich K, Knelangen JM, Santos AN, Fischer B. A simple method to sort ESC-derived adipocytes. Cytometry A 2010; 77:990-5; PMID:21290474; http://dx.doi.org/10.1002/cyto.a.20953
- Rubin CS, Hirsch A, Fung C, Rosen OM. Development of hormone receptors and hormonal responsiveness in vitro. Insulin receptors and insulin sensitivity in the preadipocyte and adipocyte forms of 3T3-L1 cells. J Biol Chem 1978; 253:7570-8; PMID:81205.
- Lee YH, Chen SY, Wiesner RJ, Huang YF. Simple flow cytometric method used to assess lipid accumulation in fat cells. J Lipid Res 2004; 45:1162-7; PMID:14993237; http://dx.doi.org/10.1194/jlr.D300028-JLR200
- Rothe G. Technical background and methodological principles of flow cytometry. In: Sack U, Tárnok A, Rothe G, eds. Cellular Diagnostics Basics, Methods and Clinical Applications of Flow Cytometry. Basel: Taylor & Francis, 2009:53-88.
- Back SH, Schröder M, Lee K, Zhang K, Kaufman RJ. ER stress signaling by regulated splicing: IRE1/HAC1/XBP1. Methods 2005; 35:395-416; PMID:15804613; http://dx.doi.org/10.1016/j.ymeth.2005.03.001
- Yang L, Qian Z, Ji H, Yang R, Wang Y, Xi L, Sheng L, Zhao B, Zhang X. Inhibitory effect on protein kinase Cθ by crocetin attenuates palmitate-induced insulin insensitivity in 3T3-L1 adipocytes. Eur J Pharmacol 2010; 642:47-55; PMID:20541543; http://dx.doi.org/10.1016/j.ejphar.2010.05.061
- Dasgupta S, Bhattacharya S, Biswas A, Majumdar SS, Mukhopadhyay S, Ray S, Bhattacharya S. NF-κB mediates lipid-induced fetuin-A expression in hepatocytes that impairs adipocyte function effecting insulin resistance. Biochem J 2010; 429:451-62; PMID:20482516; http://dx.doi.org/10.1042/BJ20100330
- Xi L, Qian Z, Xu G, Zhou C, Sun S. Crocetin attenuates palmitate-induced insulin insensitivity and disordered tumor necrosis factor-α and adiponectin expression in rat adipocytes. Br J Pharmacol 2007; 151:610-7; PMID:17471172; http://dx.doi.org/10.1038/sj.bjp.0707276
- Chavez JA, Summers SA. Characterizing the effects of saturated fatty acids on insulin signaling and ceramide and diacylglycerol accumulation in 3T3-L1 adipocytes and C2C12 myotubes. Arch Biochem Biophys 2003; 419:101-9; PMID:14592453; http://dx.doi.org/10.1016/j.abb.2003.08.020
- Usui I, Haruta T, Takata Y, Iwata M, Uno T, Takano A, Ueno E, Ishibashi O, Ishihara H, Wada T, et al. Differential effects of palmitate on glucose uptake in rat-1 fibroblasts and 3T3-L1 adipocytes. Horm Metab Res 1999; 31:546-52; PMID:10596963; http://dx.doi.org/10.1055/s-2007-978793
- Hunnicutt JW, Hardy RW, Williford J, McDonald JM. Saturated fatty acid-induced insulin resistance in rat adipocytes. Diabetes 1994; 43:540-5; PMID:8138059; http://dx.doi.org/10.2337/diab.43.4.540
- Van Epps-Fung M, Williford J, Wells A, Hardy RW. Fatty acid-induced insulin resistance in adipocytes. Endocrinology 1997; 138:4338-45; PMID:9322948
- Lundgren M, Eriksson JW. No in vitro effects of fatty acids on glucose uptake, lipolysis or insulin signaling in rat adipocytes. Horm Metab Res 2004; 36:203-9; PMID:15114517; http://dx.doi.org/10.1055/s-2004-814446
- Tao J-L, Ruan X-Z, Li H, Li X-M, Moorhead JF, Varghese Z, Li X-W. Endoplasmic reticulum stress is involved in acetylated low-density lipoprotein induced apoptosis in THP-1 differentiated macrophages. Chin Med J (Engl) 2009; 122:1794-9; PMID:19781328
- Kasambalides EJ, Lanks KW. Effects of low molecular weight nutrients on the pattern of proteins synthesized by non-proliferating murine L cells. Exp Cell Res 1981; 132:31-9; PMID:7202562; http://dx.doi.org/10.1016/0014-4827(81)90079-3
- Kowalchuk JM, Curi R, Newsholme EA. Glutamine metabolism in isolated incubated adipocytes of the rat. Biochem J 1988; 249:705-8; PMID:2895633
- Yoo H, Antoniewicz MR, Stephanopoulos G, Kelleher JK. Quantifying reductive carboxylation flux of glutamine to lipid in a brown adipocyte cell line. J Biol Chem 2008; 283:20621-7; PMID:18364355; http://dx.doi.org/10.1074/jbc.M706494200
- Semenza GL. HIF-1: mediator of physiological and pathophysiological responses to hypoxia. J Appl Physiol 2000; 88:1474-80; PMID:10749844
- Kallinowski F, Runkel S, Fortmeyer HP, Förster H, Vaupel P. L-glutamine: a major substrate for tumor cells in vivo? J Cancer Res Clin Oncol 1987; 113:209-15; PMID:3584211; http://dx.doi.org/10.1007/BF00396375
- Chandramouli V, Carter JR Jr. Metabolic effects of 2-deoxy-D-glucose in isolated fat cells. Biochim Biophys Acta 1977; 496:278-91; PMID:836900; http://dx.doi.org/10.1016/0304-4165(77)90310-5
- Skurk T, Alberti-Huber C, Herder C, Hauner H. Relationship between adipocyte size and adipokine expression and secretion. J Clin Endocrinol Metab 2007; 92:1023-33; PMID:17164304; http://dx.doi.org/10.1210/jc.2006-1055
- Yin J, Gao Z, He Q, Zhou D, Guo Z, Ye J. Role of hypoxia in obesity-induced disorders of glucose and lipid metabolism in adipose tissue. Am J Physiol Endocrinol Metab 2009; 296:E333-42; PMID:19066318; http://dx.doi.org/10.1152/ajpendo.90760.2008
- Hosogai N, Fukuhara A, Oshima K, Miyata Y, Tanaka S, Segawa K, Furukawa S, Tochino Y, Komuro R, Matsuda M, et al. Adipose tissue hypoxia in obesity and its impact on adipocytokine dysregulation. Diabetes 2007; 56:901-11; PMID:17395738; http://dx.doi.org/10.2337/db06-0911
- Michailidou Z, Turban S, Miller E, Zou X, Schrader J, Ratcliffe PJ, Hadoke PW, Walker BR, Iredale JP, Morton NM, et al. Increased angiogenesis protects against adipose hypoxia and fibrosis in metabolic disease-resistant 11β-hydroxysteroid dehydrogenase type 1 (HSD1)-deficient mice. J Biol Chem 2012; 287:4188-97; PMID:22158867; http://dx.doi.org/10.1074/jbc.M111.259325
- Sung H-K, Doh K-O, Son JE, Park JG, Bae Y, Choi S, Nelson SM, Cowling R, Nagy K, Michael IP, et al. Adipose vascular endothelial growth factor regulates metabolic homeostasis through angiogenesis. Cell Metab 2013; 17:61-72; PMID:23312284; http://dx.doi.org/10.1016/j.cmet.2012.12.010
- Sun K, Wernstedt Asterholm I, Kusminski CM, Bueno AC, Wang ZV, Pollard JW, Brekken RA, Scherer PE. Dichotomous effects of VEGF-A on adipose tissue dysfunction. Proc Natl Acad Sci U S A 2012; 109:5874-9; PMID:22451920; http://dx.doi.org/10.1073/pnas.1200447109
- Cornelius P, MacDougald OA, Lane MD. Regulation of adipocyte development. Annu Rev Nutr 1994; 14:99-129; PMID:7946535; http://dx.doi.org/10.1146/annurev.nu.14.070194.000531
- Gregoire FM, Smas CM, Sul HS. Understanding adipocyte differentiation. Physiol Rev 1998; 78:783-809; PMID:9674695
- Bosma M, Dapito DH, Drosatos-Tampakaki Z, Huiping-Son N, Huang L-S, Kersten S, Drosatos K, Goldberg IJ. Sequestration of fatty acids in triglycerides prevents endoplasmic reticulum stress in an in vitro model of cardiomyocyte lipotoxicity. Biochim Biophys Acta 2014; 1841:1648-55; PMID:25251292; http://dx.doi.org/10.1016/j.bbalip.2014.09.012
- Kovanen PT, Nikkilä EA, Miettinen TA. Regulation of cholesterol synthesis and storage in fat cells. J Lipid Res 1975; 16:211-23; PMID:1127358
- Prattes S, Hörl G, Hammer A, Blaschitz A, Graier WF, Sattler W, Zechner R, Steyrer E. Intracellular distribution and mobilization of unesterified cholesterol in adipocytes: triglyceride droplets are surrounded by cholesterol-rich ER-like surface layer structures. J Cell Sci 2000; 113:2977-89; PMID:10934037
- Ross SE, Erickson RL, Gerin I, DeRose PM, Bajnok L, Longo KA, Misek DE, Kuick R, Hanash SM, Atkins KB, et al. Microarray analyses during adipogenesis: understanding the effects of Wnt signaling on adipogenesis and the roles of liver X receptor a in adipocyte metabolism. Mol Cell Biol 2002; 22:5989-99; PMID:12138207; http://dx.doi.org/10.1128/MCB.22.16.5989-5999.2002
- Burton GR, Nagarajan R, Peterson CA, McGehee RE Jr. Microarray analysis of differentiation-specific gene expression during 3T3-L1 adipogenesis. Gene 2004; 329:167-85; PMID:15033539; http://dx.doi.org/10.1016/j.gene.2003.12.012
- Higuchi M, Dusting GJ, Peshavariya H, Jiang F, Hsiao ST, Chan EC, Liu GS. Differentiation of human adipose-derived stem cells into fat involves reactive oxygen species and Forkhead box O1 mediated upregulation of antioxidant enzymes. Stem Cells Dev 2013; 22:878-88; PMID:23025577; http://dx.doi.org/10.1089/scd.2012.0306
- Qiang L, Farmer SR. C/EBPa-dependent induction of glutathione S-transferase ζ/maleylacetoacetate isomerase (GSTζ/MAAI) expression during the differentiation of mouse fibroblasts into adipocytes. Biochem Biophys Res Commun 2006; 340:845-51; PMID:16376852; http://dx.doi.org/10.1016/j.bbrc.2005.12.067
- Jowsey IR, Smith SA, Hayes JD. Expression of the murine glutathione S-transferase α3 (GSTA3) subunit is markedly induced during adipocyte differentiation: activation of the GSTA3 gene promoter by the pro-adipogenic eicosanoid 15-deoxy-Δ12,14-prostaglandin J2. Biochem Biophys Res Commun 2003; 312:1226-35; PMID:14652005; http://dx.doi.org/10.1016/j.bbrc.2003.11.068
- Si Y, Yoon J, Lee K. Flux profile and modularity analysis of time-dependent metabolic changes of de novo adipocyte formation. Am J Physiol Endocrinol Metab 2007; 292:E1637-46; PMID:17284573; http://dx.doi.org/10.1152/ajpendo.00670.2006
- Oyadomari S, Takeda K, Takiguchi M, Gotoh T, Matsumoto M, Wada I, Akira S, Araki E, Mori M. Nitric oxide-induced apoptosis in pancreatic β cells is mediated by the endoplasmic reticulum stress pathway. Proc Natl Acad Sci U S A 2001; 98:10845-50; PMID:11526215; http://dx.doi.org/10.1073/pnas.191207498
- Chambers KT, Unverferth JA, Weber SM, Wek RC, Urano F, Corbett JA. The role of nitric oxide and the unfolded protein response in cytokine induced β-cell death. Diabetes 2008; 57:124-32; PMID:17928398; http://dx.doi.org/10.2337/db07-0944
- Koh EH, Park J-Y, Park H-S, Jeon MJ, Ryu JW, Kim M, Kim SY, Kim M-S, Kim S-W, Park IS, et al. Essential role of mitochondrial function in adiponectin synthesis in adipocytes. Diabetes 2007; 56:2973-81; PMID:17827403; http://dx.doi.org/10.2337/db07-0510
- Alhusaini S, McGee K, Schisano B, Harte A, McTernan P, Kumar S, Tripathi G. Lipopolysaccharide, high glucose and saturated fatty acids induce endoplasmic reticulum stress in cultured primary human adipocytes: salicylate alleviates this stress. Biochem Biophys Res Commun 2010; 397:472-8; PMID:20515657; http://dx.doi.org/10.1016/j.bbrc.2010.05.138
- Jeon MJ, Leem J, Ko MS, Jang JE, Park H-S, Kim HS, Kim M, Kim EH, Yoo HJ, Lee C-H, et al. Mitochondrial dysfunction and activation of iNOS are responsible for the palmitate-induced decrease in adiponectin synthesis in 3T3L1 adipocytes. Exp Mol Med 2012; 44:562-70; PMID:22809900; http://dx.doi.org/10.3858/emm.2012.44.9.064
- Kawasaki N, Asada R, Saito A, Kanemoto S, Imaizumi K. Obesity-induced endoplasmic reticulum stress causes chronic inflammation in adipose tissue. Sci Rep 2012; 2:799; PMID:23150771; http://dx.doi.org/10.1038/srep00799
- Jiao P, Ma J, Feng B, Zhang H, Alan Diehl J, Eugene Chin Y, Yan W, Xu H. FFA-induced adipocyte inflammation and insulin resistance: involvement of ER stress and IKKβ pathways. Obesity (Silver Spring) 2011; 19:483-91; PMID:20829802; http://dx.doi.org/10.1038/oby.2010.200
- Chen Y, Chen M, Wu Z, Zhao S. Ox-LDL induces ER stress and promotes the adipokines secretion in 3T3-L1 adipocytes. PLoS One 2013; 8:e81379; PMID:24278099; http://dx.doi.org/10.1371/journal.pone.0081379
- Dever TE, Chen JJ, Barber GN, Cigan AM, Feng L, Donahue TF, London IM, Katze MG, Hinnebusch AG. Mammalian eukaryotic initiation factor 2α kinases functionally substitute for GCN2 protein kinase in the GCN4 translational control mechanism of yeast. Proc Natl Acad Sci U S A 1993; 90:4616-20; PMID:8099443; http://dx.doi.org/10.1073/pnas.90.10.4616
- Harding HP, Zhang Y, Ron D. Protein translation and folding are coupled by an endoplasmic-reticulum-resident kinase. Nature 1999; 397:271-4; PMID:9930704; http://dx.doi.org/10.1038/16729
- Kyriakis JM, Banerjee P, Nikolakaki E, Dai T, Rubie EA, Ahmad MF, Avruch J, Woodgett JR. The stress-activated protein kinase subfamily of c-Jun kinases. Nature 1994; 369:156-60; PMID:8177321; http://dx.doi.org/10.1038/369156a0
- Li LO, Klett EL, Coleman RA. Acyl-CoA synthesis, lipid metabolism and lipotoxicity. Biochim Biophys Acta 2010; 1801:246-51; PMID:19818872; http://dx.doi.org/10.1016/j.bbalip.2009.09.024
- Hassan RH, Hainault I, Vilquin J-T, Samama C, Lasnier F, Ferré P, Foufelle F, Hajduch E. Endoplasmic reticulum stress does not mediate palmitate-induced insulin resistance in mouse and human muscle cells. Diabetologia 2012; 55:204-14; PMID:22006247; http://dx.doi.org/10.1007/s00125-011-2328-9
- Weigert C, Brodbeck K, Staiger H, Kausch C, Machicao F, Haring HU, Schleicher ED. Palmitate, but not unsaturated fatty acids, induces the expression of interleukin-6 in human myotubes through proteasome-dependent activation of nuclear factor-κB. J Biol Chem 2004; 279:23942-52; PMID:15028733; http://dx.doi.org/10.1074/jbc.M312692200
- Miller TA, LeBrasseur NK, Cote GM, Trucillo MP, Pimentel DR, Ido Y, Ruderman NB, Sawyer DB. Oleate prevents palmitate-induced cytotoxic stress in cardiac myocytes. Biochem Biophys Res Commun 2005; 336:309-15; PMID:16126172; http://dx.doi.org/10.1016/j.bbrc.2005.08.088
- Diakogiannaki E, Welters HJ, Morgan NG. Differential regulation of the endoplasmic reticulum stress response in pancreatic β-cells exposed to long-chain saturated and monounsaturated fatty acids. J Endocrinol 2008; 197:553-63; PMID:18492819; http://dx.doi.org/10.1677/JOE-08-0041
- Katsoulieris E, Mabley JG, Samai M, Green IC, Chatterjee PK. α-Linolenic acid protects renal cells against palmitic acid lipotoxicity via inhibition of endoplasmic reticulum stress. Eur J Pharmacol 2009; 623:107-12; PMID:19765573; http://dx.doi.org/10.1016/j.ejphar.2009.09.015
- Akazawa Y, Cazanave S, Mott JL, Elmi N, Bronk SF, Kohno S, Charlton MR, Gores GJ. Palmitoleate attenuates palmitate-induced Bim and PUMA up-regulation and hepatocyte lipoapoptosis. J Hepatol 2010; 52:586-93; PMID:20206402; http://dx.doi.org/10.1016/j.jhep.2010.01.003
- Salvadó L, Coll T, Gómez-Foix AM, Salmerón E, Barroso E, Palomer X, Vázquez-Carrera M. Oleate prevents saturated-fatty-acid-induced ER stress, inflammation and insulin resistance in skeletal muscle cells through an AMPK-dependent mechanism. Diabetologia 2013; 56:1372-82; PMID:23460021; http://dx.doi.org/10.1007/s00125-013-2867-3
- Sommerweiß D, Gorski T, Richter S, Garten A, Kiess W. Oleate rescues INS-1E β-cells from palmitate induced apoptosis by preventing activation of the unfolded protein response. Biochem Biophys Res Commun 2013; 441:770-6; PMID:24189472; http://dx.doi.org/10.1016/j.bbrc.2013.10.130
- Steinberg D. Low density lipoprotein oxidation and its pathobiological significance. J Biol Chem 1997; 272:20963-6; PMID:9261091; http://dx.doi.org/10.1074/jbc.272.34.20963
- Schroepfer GJ Jr. Oxysterols: modulators of cholesterol metabolism and other processes. Physiol Rev 2000; 80:361-554; PMID:10617772
- Green H, Kehinde O. Sublines of mouse 3T3 cells that accumulate lipid. Cell 1974; 1:113-6; http://dx.doi.org/10.1016/0092-8674(74)90126-3
- Green H, Kehinde O. Spontaneous heritable changes leading to increased adipose conversion in 3T3 cells. Cell 1976; 7:105-13; PMID:949738; http://dx.doi.org/10.1016/0092-8674(76)90260-9
- Tsuchiya S, Yamabe M, Yamaguchi Y, Kobayashi Y, Konno T, Tada K. Establishment and characterization of a human acute monocytic leukemia cell line (THP-1). Int J Cancer 1980; 26:171-6; PMID:6970727; http://dx.doi.org/10.1002/ijc.2910260208
- Daigneault M, Preston JA, Marriott HM, Whyte MK, Dockrell DH. The identification of markers of macrophage differentiation in PMA-stimulated THP-1 cells and monocyte-derived macrophages. PLoS One 2010; 5:e8668; PMID:20084270; http://dx.doi.org/10.1371/journal.pone.0008668
- Mosmann T. Rapid colorimetric assay for cellular growth and survival: application to proliferation and cytotoxicity assays. J Immunol Methods 1983; 65:55-63; PMID:6606682; http://dx.doi.org/10.1016/0022-1759(83)90303-4
- Bradley RL, Fisher FF, Maratos-Flier E. Dietary fatty acids differentially regulate production of TNF-α and IL-10 by murine 3T3-L1 adipocytes. Obesity (Silver Spring) 2008; 16:938-44; PMID:18356844; http://dx.doi.org/10.1038/oby.2008.39
- Chavez JA, Knotts TA, Wang LP, Li G, Dobrowsky RT, Florant GL, Summers SA. A role for ceramide, but not diacylglycerol, in the antagonism of insulin signal transduction by saturated fatty acids. J Biol Chem 2003; 278:10297-303; PMID:12525490; http://dx.doi.org/10.1074/jbc.M212307200
- Cox DJ, Strudwick N, Ali AA, Paton AW, Paton JC, Schröder M. Measuring signaling by the unfolded protein response. Methods Enzymol 2011; 491:261-92; PMID:21329805; http://dx.doi.org/10.1016/B978-0-12-385928-0.00015-8
- Ku HH. Notes on use of propagation of error formulas. J Res Nat Bureau Standards Sect C — Eng Instrumentat 1966; 70:263-73; http://dx.doi.org/10.6028/jres.070C.025
- Dunnett CW. New tables for multiple comparisons with control. Biometrics 1964; 20:482-91; http://dx.doi.org/10.2307/2528490
- Dunnett CW. A multiple comparison procedure for comparing several treatments with a control. J Am Stat Assoc 1955; 50:1096-121; PMID:9252830; http://dx.doi.org/10.1080/01621459.1955.10501294