Abstract
Autophagy is an important cellular catabolic process that plays a variety of important roles, including maintenance of the amino acid pool during starvation, recycling of damaged proteins and organelles, and clearance of intracellular microbes. Currently employed autophagy detection methods include fluorescence microscopy, biochemical measurement, SDS-PAGE and western blotting, but they are time consuming, labor intensive, and require much experience for accurate interpretation. More recently, development of novel fluorescent probes have allowed the investigation of autophagy via standard flow cytometry. However, flow cytometers remain relatively expensive and require a considerable amount of maintenance. Previously, image-based cytometry has been shown to perform automated fluorescence-based cellular analysis comparable to flow cytometry. In this study, we developed a novel method using the Cellometer image-based cytometer in combination with Cyto-ID® Green dye for autophagy detection in live cells. The method is compared with flow cytometry by measuring macroautophagy in nutrient-starved Jurkat cells. Results demonstrate similar trends of autophagic response, but different magnitude of fluorescence signal increases, which may arise from different analysis approaches characteristic of the two instrument platforms. The possibility of using this method for drug discovery applications is also demonstrated through the measurement of dose-response kinetics upon induction of autophagy with rapamycin and tamoxifen. The described image-based cytometry/fluorescent dye method should serve as a useful addition to the current arsenal of techniques available in support of autophagy-based drug discovery relating to various pathological disorders.
Introduction
Autophagy is an important evolutionarily conserved cellular catabolic process characterized by a set of complex and highly regulated events that lead to the engulfment of misfolded proteins, protein complexes, and entire organelles in double-membrane sequestering vesicles referred to as autophagosomes.Citation1,Citation2 The process is involved in diverse biological events including starvation, protein and organelle turnover, development, aging and cell death. Under physiological conditions, autophagy plays a variety of important roles including maintenance of the amino acid pool during starvation, damaged protein and organelle turnover, prevention of neurodegeneration, tumor suppression, cellular differentiation, clearance of intracellular microbes and regulation of innate and adaptive immunity.Citation1,Citation3–Citation6 Autophagic activity is typically low under basal conditions, but can be markedly upregulated by a variety of physiological stimuli. The most well-known autophagy inducer is nutrient starvation, both in cultured cells and in intact organisms, ranging from yeast to mammals. Besides starvation, autophagy can also be activated by physiological stress stimuli such as hypoxia, energy depletion, endoplasmic reticulum stress, elevated temperature, high density growth conditions, hormonal stimulation, pharmacological agent treatment and innate immune signaling. In addition, diseases such as viral, bacterial, or parasitic infections as well as various protein aggregopathies (e.g., Alzheimer, Huntington and Parkinson diseases), heart disease, acute pancreatitis and cancer also lead to the activation of autophagy.Citation7,Citation8
Morphological and biochemical studies have shown that autophagy is a multiple-step process, where the autophagosome is delivered to the lysosome, degraded into its essential constituents, and recycled back to the cytoplasm. First, a signal that induces the formation of double-membrane structures (phagophores) is believed to originate from both the endoplasmic reticulum and the mitochondrion. The phagophore can sequester portions of the cytoplasm along with proteins or damaged cellular organelles for degradation, during which the ATG12–ATG5-ATG16L1 complex and ATG8 (LC3) are localized to the formation region. Upon completion of autophagosome formation, the ATG12–ATG5-ATG16L1 complex dissociates from the double-membrane leaving phosphatidyl ethanolamine modified LC3 and LC3-II. The autophagosome ultimately fuses with the lysosome to form an autolysosome and its contents are degraded by various hydrolytic enzymes, including glycosidases, proteases and sulfatases.Citation9–Citation11
Our understanding of autophagy has expanded tremendously in recent years, largely due to the identification of the many genes involved in the process, and the use of GFP-LC3 fusion proteins to visually monitor autophagosomes and autophagic activity both biochemically and microscopically.Citation12,Citation13 Identification of genes involved in the process and visualization of autophagosomes using GFP-LC3 have become commonplace methods to study autophagy. However, quantification with fluorescence microscopy using monodasylcadaverine,Citation13–Citation15 biochemical methods, and detection of protein modifications through SDS-PAGE and western blotting are time consuming, labor intensive, and require much experience for accurate interpretation.Citation12 Recently, a novel fluorescent probe, Cyto-ID® Green autophagy dye, has been developed to facilitate the investigation of the autophagic process.Citation16–Citation18 The fluorescent probe has been shown to generate comparable autophagic detection as conventional western blotting, and the specificity of the dye has been validated using flow cytometry.Citation16 However, flow cytometers remain relatively expensive, large in size, and require considerable effort to maintain in good working order. In addition, conventional flow cytometers do not provide imaging capabilities, which may lead to some uncertainties in the measurements, such as artifacts arising from nonspecific dye binding or autofluorescence. Recently, a flow cytometer with imaging capability (Amnis, ImageStream) has been implemented for the detection of autophagy,Citation19 but the relative high instrument cost may be a barrier for adoption by smaller research laboratories.
Previously, Cellometer image-based cytometry () has been shown to perform rapid fluorescence-based cellular analysis comparable to flow cytometry, specifically with respect to the measurement of apoptosis.Citation20–Citation23 In this study, a novel method using the Cellometer image cytometry in combination with Cyto-ID® Green autophagy dye is presented for detecting autophagy in live cells (). First, Cyto-ID® Green autophagy dye was validated by observing co-localization of the dye and RFP-LC3 in HeLa cells using fluorescence microscopy. Next, image-based and flow cytometry-based methods are benchmarked for measuring macroautophagic signals in nutrient-starved Jurkat cells. Autophagic signals of starved Jurkat cells induced with an autophagy inhibitor were also quantified and compared using the two instrument platforms.Citation24 In order to establish the feasibility of employing the imaging-based workflow for drug discovery applications, a time-course study of the induction of autophagy in Jurkat (suspension) and PC-3 (adherent) cells treated with rapamycin was undertaken,Citation25,Citation26 demonstrating the ability to detect autophagy with a similar sensitivity as the starvation model. Finally, direct dose-response comparisons of two small molecule autophagy inducers, rapamycin and tamoxifen, were performed using image-based cytometry.Citation27 The described combination of automated fluorescence imaging and data processing allows rapid analysis of autophagic flux and addresses some of the limitations encountered using other detection methods.Citation20 The image-based cytometry/fluorescent dye workflow provides useful advantages compared with other commonly implemented techniques used in the field and should find application in performance of autophagy-based drug discovery studies relating to a variety of pathological disorders.
Figure 1. Optical block diagram of the Cellometer Vision. The Cellometer Vision contains three signal acquisition/detection features: (1) Bright-field light source allows transmission light microscopy image analysis. (2) Fluorescence excitation light source in combination with excitation, dichroic and emission filter set allows epi-fluorescence imaging analysis. (3) Cellometer imaging software allows analysis of cell concentration, size and fluorescence intensity measurement.
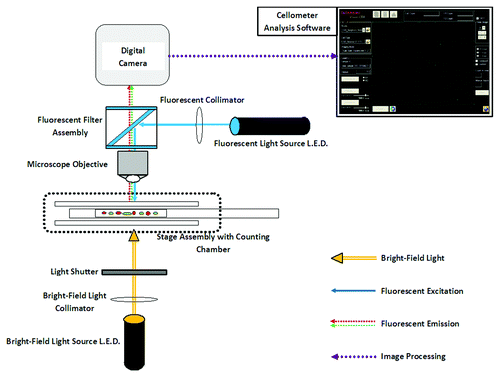
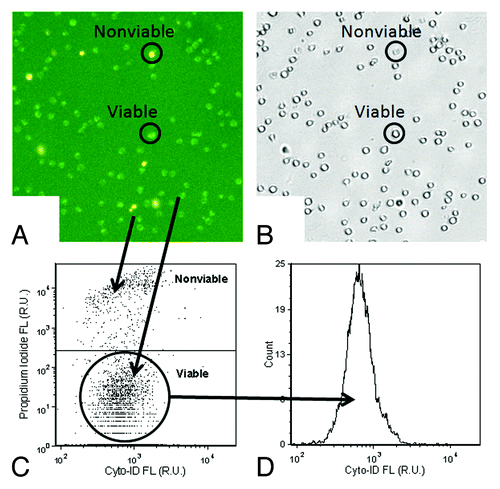
Figure 2. Data analysis method for autophagy detection. (A and B) The fluorescent and bright-field images showed bright green fluorescent spots inside the Jurkat cells that represented Cyto-ID® Green autophagy dye stained autophagosomes/autolysosomes. In addition, samples were stained with propidium iodide, shown in the fluorescent image as orange signal, which facilitated identification of dead cells and allowing for their elimination from data analysis. (C) The fluorescence of propidium iodide was plotted with respect to Cyto-ID® Green autophagy dye signal, and the nonviable propidium iodide-positive Jurkat cell signals were removed to allow analysis of only the viable cells in (D) the Cyto-ID® Green autophagy dye fluorescence histogram.
Results
Validation of Cyto-ID® Green autophagy dye using fluorescence microscopy
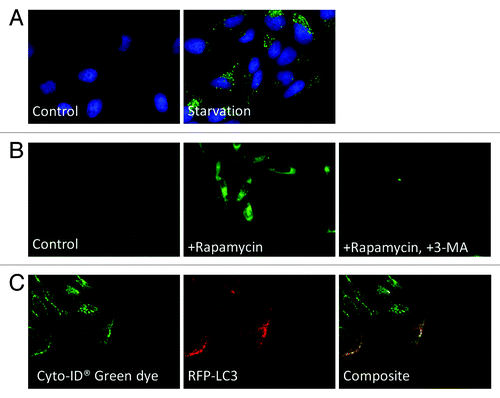
To validate the staining capability of Cyto-ID® Green autophagy dye, fluorescence microscopy images of starvation- and drug-treated HeLa cells were captured digitally as shown in . The starvation experiment with HeLa cells () showed an obvious increase in the Cyto-ID® fluorescence signals. For the rapamycin treatment experiment (), the control and the sample with 3-MA displayed low green fluorescence signal as expected, while the sample treated with rapamycin in the absence of 3-MA showed an increase in green fluorescence signal, which indicated higher levels of autophagy. To validate the specificity of the dye, HeLa cells were transfected with RFP-LC3 and treated with tamoxifen (). Under fluorescence microscopy, the green fluorescence was found to be associated with punctate structures that colocalized with the red fluorescence of RFP-LC3. Note that RFP-LC3 was not uniformly expressed in all cells, due to the limited transfection efficiency.
Figure 3. Fluorescence microscopy images of autophagy-induced HeLa cells. (A) HeLa cells were incubated in EMEM (normal) or EBSS (minimal) medium at 37°C for 1 h. Following the incubation, both starved and control cells were stained with Cyto-ID® Green autophagy dye and Hoechst 33342 (pseudo color green and blue). A clear increase in green fluorescence was observed in nutrient-starved HeLa cells. Importantly, little to no staining of lysosomes in the control cells was observed. (B) HeLa cells were incubated in EMEM medium with 3 µM of rapamycin in the presence or absence of 10 mM of 3-MA at 37°C overnight. After overnight incubation, the cells were stained with Cyto-ID® Green autophagy dye. The rapamycin-induced accumulation of the dye was noticeably inhibited by the presence of 3-MA. (C) Transfected HeLa cells expressing RFP-LC3 (pseudo color red) were treated with 10 µM tamoxifen at 37°C overnight. After overnight incubation, the cells were stained with Cyto-ID® Green autophagy dye. The accumulation of green fluorescence mostly colocalized with the RFP-LC3 protein signal, indicating the specificity for autophagy detection.
Comparison of starvation and recovery assay using image-based and flow cytometry
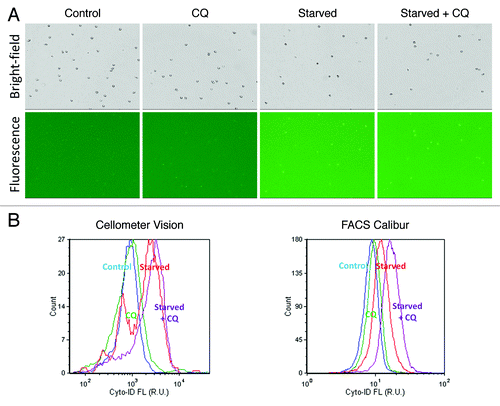
Perhaps the most well-characterized autophagy inducer is nutrient starvation, having been investigated both in cultured cells and in intact organisms, ranging from yeasts to mammals. In response to starvation, autophagy mediates generation of vital nutrients, such as amino acids, by degrading nonessential or damaged subcellular components. Starvation was induced by incubating Jurkat cells in EBSS media for 2 h, and then the cells were allowed to recover in RPMI media for 1 h. The bright-field and fluorescence images are shown in , where noticeable fluorescence can be visually confirmed with nutrient-starved Jurkat cells compared with the low background signal in control and recovery samples. A comparison of fluorescence histogram results obtained with the Cellometer and FACS Calibur cytometers is shown in . Profiles from the three samples were overlaid on the same histogram plot to facilitate identification of changes in fluorescence. The peaks in the plot showed comparable response trends using both instrumentations, where the control group showed the lowest fluorescence intensity, followed by the recovery group, while the nutrient-starved group displayed the highest fluorescence intensity values. The calculation for autophagy activity factor (AAF) values is described in Equation 1 in the Materials and Methods section,Citation28 where the calculated AAF values are shown in with noticeable differences observed between the two detection methods. The increase in autophagic fluorescent signal for nutrient starvation was approximately 7.8 and 1.7 times for image-based and flow cytometry, respectively. Jurkat cells did not completely recover to control fluorescence intensity values after 1 h incubation in RPMI media, with AAF values of approximately 1.5 and 1.2 determined for image-based and flow cytometry, respectively.
Figure 4. Starvation and recovery assay. (A) Bright-field and fluorescent images of control, recovery and nutrient-starved Jurkat cells. The fluorescent images show strong fluorescence in the nutrient-starved Jurkat cells compared with the control and recovered samples. However, it was difficult to visually distinguish the fluorescence intensities between the control and recovered samples without examining the fluorescence histograms. (B) Fluorescence histograms measured using the Cellometer Vision and FACS Calibur instruments showed comparable trends, wherein nutrient-starved Jurkat cells displayed the highest fluorescence peak, followed by recovery and control samples.
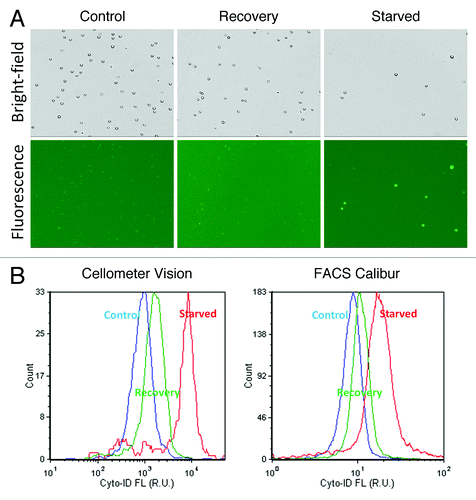
Table 1. Comparison of calculated AAF values between the Cellometer Vision and FACS Calibur cytometers
Comparison of autophagic flux detection by image-based and flow cytometry
Autophagic flux refers to the progression and resolution of autophagy, which is a dynamic, multistep process that can be modulated at several steps. It is essential to distinguish autophagosome formation that indicates the induction of autophagy, and autophagic flux, which also determines whether the process of autophagy goes to completion. While complete cycles of autophagy will generally exert a cytoprotective effect, inhibition of the autophagy process can lead to the accumulation of autophagosomes, therefore contributing to physiological dysfunction. Chloroquine is a known autophagy degradation inhibitor, which increases the pH of the lysosome, therefore preventing the activity of lysosomal acid proteases and causing autophagosomes to accumulate. In this study, Jurkat cells were incubated with chloroquine for 2 h under conditions of nutrient starvation as well as the control conditions in order to observe differences in autophagic signals. shows the bright-field and fluorescence images of the control, control + CQ, nutrient-starved and nutrient-starved + CQ Jurkat cells. The increase in fluorescence intensities could be visually and analytically confirmed in the fluorescence histogram plots (). The calculated AAF values are displayed in . For image-based cytometry, the increase in autophagic signal was approximately 1.1, 2.0 and 2.6 for CQ only, nutrient-starved and nutrient-starved + CQ groups, respectively. For flow cytometry, the increase in autophagic signal was approximately 1.1, 1.2 and 1.6 for CQ only, nutrient-starved and nutrient-starved + CQ groups, respectively. Nutrient starvation in combination with chloroquine treatment, compared with nutrient starvation alone, resulted in a stronger increase in autophagic signal, in agreement with the known effects of chloroquine.
Figure 5. Autophagic flux measurements. (A) Bright-field and fluorescent images of control, CQ only, nutrient-starved and nutrient-starved + CQ Jurkat cells. Visually, the fluorescence signals of control and nutrient-starved vs. their respective CQ counterparts did not show noticeable increases in signal. (B) By observing the fluorescence histograms, however, similar trends were observed using the Cellometer Vision and FACS Calibur instruments, wherein nutrient-starved + CQ treatment samples showed the highest signals, followed by nutrient-starved treatment samples, CQ only treatment samples and control samples.
Time-dependent dose response effects in rapamycin-induced autophagy
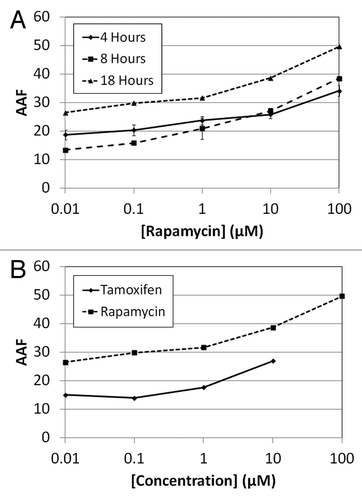
Time-dependent dose response measurements are important for determining the suitability of target drugs or chemical compounds. In this experiment, rapamycin was selected to demonstrate the capability of image-based cytometry in measuring an autophagic dose response effect. Rapamycin was incubated at various concentrations with Jurkat cells in suspension for 18 h and the autophagic fluorescence signals were measured at various time points (4, 8 and 18 h). The fluorescent images associated with each concentration of rapamycin as a function of incubation time are shown in . By fluorescence imaging, the appearance of autophagosomes is most noticeable after 100 µM treatment for 18 h incubation with no observable cytotoxicity. The time-dependent dose response AAF values are summarized in , where the autophagy level at 4 and 8 h showed comparable signals, but increased by approximately 1.5 times when incubation time reached 18 h.
Figure 6. Combined fluorescent images of Cyto-ID® Green autophagy dye and propidium iodide stained Jurkat cells. (A) Time-dependent dose response analysis of rapamycin-induced autophagy stained with Cyto-ID Green autophagy dye (pseudo color green) and propidium iodide (pseudo color orange). The green fluorescent autophagosomes inside the Jurkat cells increased as the rapamycin concentration increased, demonstrating the brightest fluorescence intensity after 18 h treatment with 100 µM of drug. (B) As for the dose response comparison at 18 h between rapamycin and tamoxifen, it was noticeable in the images that rapamycin (shown in ) induced higher fluorescence signals in the Jurkat cells. In addition, tamoxifen was found to be highly cytotoxic at 100 µM, with most of the Jurkat cells losing viability at this concentration of drug.
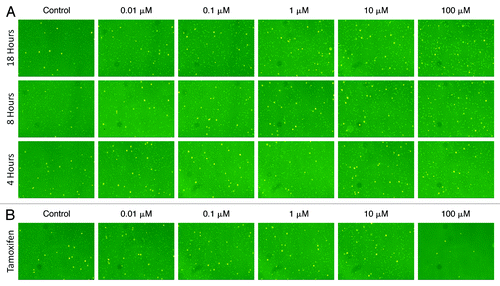
Figure 7. Calculated AAF values for drug dose response effects in Jurkat cells. (A) The calculated AAF values for rapamycin showed approximately 20% increase in autophagy at 18 h incubation. The 4 and 8 h samples were comparable, indicating rapamycin required more than 8 h of incubation in order to induce noticeable autophagy. (B) Both visually and analytically, rapamycin showed higher autophagic signals than tamoxifen after 18 h incubation. It was interesting to note that tamoxifen induced cytotoxicity at the highest concentration in contrast to rapamycin.
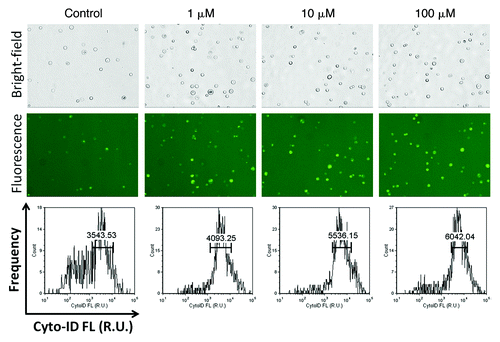
Autophagy was also induced in PC-3 adherent cells by incubating in 1, 10 and 100 µM rapamycin for 4 h. The bright-field and fluorescent images are shown in , documenting an obvious increase in fluorescence signal intensity as well as Cyto-ID® positive cell populations. The calculated AAF increased from 13.43 to 35.99, and finally 41.35 for 1, 10 and 100 µM treatments, respectively.
Figure 8. Rapamycin-induced autophagy in PC-3 cells. Bright-field (top) and fluorescent (middle) images of PC-3 cells induced with 0, 1, 10 and 100 µM of rapamycin for 4 h. The fluorescent images clearly showed the increase in fluorescence and population of Cyto-ID® Green autophagy dye-stained PC-3 cells, confirmed by the fluorescence histogram (bottom), showing increase in average fluorescence intensity as rapamycin concentration increased.
Comparison of rapamycin and tamoxifen dose response effects
In order to show the capability of utilizing image-based cytometry as a screening tool for drug discovery applications, dose response measurements of rapamycin and tamoxifen were compared. The Jurkat cells were incubated with various concentrations of rapamycin and tamoxifen for 18 h. The fluorescent images at each concentration of compounds are shown in , and the dose response AAF values as a function of concentration are summarized in , demonstrating that rapamycin induced noticeably higher autophagy response compared with tamoxifen. Although rapamycin induced higher autophagy levels in the Jurkat cells, the compound did not induce cytotoxicity. On the other hand, tamoxifen displayed lower AAF values at each concentration, but induced cytotoxicity and disintegration of all cells at 100 µM.
Discussion
The ability to efficiently measure and analyze autophagy in living cells is of particular importance when screening for compounds that can potentially modify disease state, such as promoting clearance of misfolded proteins associated with neurodegeneration, or inhibiting drug resistance associated with cancer. In order to develop a novel and efficient method for autophagy detection, new technologies, both in instrumentation and reagents, must be considered to overcome liabilities associated with standard methods. The Cellometer Vision has previously been used for advanced fluorescent cell-based assay,Citation20,Citation21,Citation23 providing a powerful tool for method development. In addition, Cyto-ID® Green autophagy dye has previously been shown to specifically stain autophagosomes in live cells and further confirmed in this work using fluorescence microscopy to demonstrate the colocalization of RFP-LC3 and Cyto-ID® Green autophagy dye in a starvation model using HeLa cells. In order to develop the novel autophagy detection method, image-based cytometry was compared with conventional flow cytometry in the measurement of autophagy in nutrient-starved Jurkat cells. The increase in Cyto-ID® Green autophagy dye fluorescence signals represents the formation of autophagosomes. Both methods showed a strong increase in autophagy in nutrient-starved cells, which decreased for cells that had been allowed to recover by returning them to standard media, but the calculated AAF values obtained with the two analytical platforms differed considerably. The differences may be attributed to the different detection systems implemented in image-based vs. flow cytometry. The FACS Calibur flow cytometer uses a photo-multiplier tube (PMT) while the Cellometer Vision instrument uses a charge coupled device (CCD) for fluorescence measurement. Another reason for the observed differences in quantitative values obtained may arise from differences in data analysis methods. The flow cytometer measures total fluorescence signals from each cell, while the image-based system capture images and measure specific fluorescent intracellular vacuoles, such as autophagosomes, within the cells, which could potentially provide a more accurate representation of the detected signals. The Cellometer software can analyze fluorescence of cells using two methods. The first method involves a summation of the fluorescent pixels in each cell to generate total fluorescence similar to a flow cytometry. The second method involves summation of high intensity fluorescent pixels within each cell which, given the resolution of the system (~1.30 µm2/pixel), would potentially compare only the fluorescence of stained autophagosomes within the cell. In addition, it has been previously shown that sheer stress of flow cytometry may have some adverse effects on target cells.Citation21 It is important to note that flow cytometry can analyze a much higher number of cells than image-based cytometry, which can improve statistical analysis of the data generated.
The ability to monitor autophagic flux was also an important benchmark for the validation of the novel detection workflow. Besides nutrient starvation, chloroquine was employed to inhibit lysosomal degradation of autophagosomes. The expectation was that autophagic signal would be the greatest for nutrient-starved Jurkat cells in the presence of CQ due to synergistic interaction between the treatments, followed by starvation in the absence of CQ. Jurkat cells in the presence of CQ were expected to display an increase in autophagic signal relative to the control sample, as any autolysosomes generated by basal autophagy would accumulate due to blockage of the distal portion of the autophagic pathway. Experimentally, the addition of CQ showed only a small increase in the fluorescence signal, which likely indicates very low basal autophagy in the unstressed Jurkat cells. Results obtained from both the Cellometer Vision and FACS Calibur showed similar trends, as described above, but the AAF values differed between the two systems, possibly due to the instrumentation differences as detailed above. Despite the quantitative differences in the AAF values, which appear to be instrumentation-specific, these results demonstrated that the image-based cytometric detection method could readily be implemented to examine autophagy.
An essential aspect in developing a rapid autophagy detection method is to demonstrate its ability to analyze samples under multiple conditions, which could potentially be utilized for drug discovery applications. This capability was established using image-based cytometry to measure autophagic levels of Jurkat cells induced with rapamycin at various concentrations, as rapamycin is a small molecule that induces autophagy in an analogous manner as nutrient starvation. Since rapamycin required at least 12 h of incubation in order to observe autophagy induction, the goal was to demonstrate the ability for image-based cytometry to measure dose response effects as a function of incubation period over a relatively long time period. Overall, image-based cytometry was able to detect the differences in autophagic levels across the various incubation periods. In , the autophagic signals (as measured by AAF values) were obviously the highest after 18 h of incubation. However, a slight decrease in AAF values at shorter incubation periods of 8 h was observed compared with 4 h. This could be due to the failure to allow the cells to fully recover after the initial drug treatment. Since many autophagy studies involve the use of adherent cells, the human prostate cancer cell line, PC-3 was selected to benchmark the capability of the image-based cytometry workflow. The resolution of Cellometer Vision was sufficient to image and measure fluorescent autophagosomes (puncta), as indicated in both fluorescent images captured by the system and fluorescence intensity histograms generated.
In addition to measuring time-dependent dose response of rapamycin, it was also important to demonstrate the ability to compare autophagic effects of multiple compounds, which can prove useful in a drug discovery campaigns wherein lead compounds are being selected. Tamoxifen was employed as an alternative to rapamycin in this context. Previously, we determined that 18 h incubation generated a robust tamoxifen response, thus both small molecule compounds were examined for this period of time. The analysis revealed that at the same concentration, rapamycin induced a higher level of autophagy than tamoxifen. However, 100 µM tamoxifen actually proved to be somewhat cytotoxic, leading to Jurkat cell death after 18 h incubation. In this experiment, image-based cytometry was able to verify the cytotoxicity effect of tamoxifen at high concentration, which proved to be useful in eliminating uncertainties from results that only plotted as scatter plots or histograms.
Image-based cytometry has been shown to generate comparable results as standard flow cytometry for fluorescence-based cellular analysis.Citation20,Citation21 Image-based cytometry may offer certain advantages in detection and analysis of response in cell-based assays. For example, cell sample volume requirements typically ranges from 10 to 40 µl for image-based cytometers, which means the number of cells used are significantly reduced compared with a typical flow cytometer, requiring volumes of 300 to 500 µl. Unlike flow cytometer, where the initial setup of PMT voltages or compensation requires running precious cell samples, image-based cytometers generally utilize disposable slides that hold the cells in a stationary state, thus samples are not wasted during initial calibration of signal detection, such as optimization of exposure time adjustment or focusing. More importantly, the ability to capture images allows researchers to visually inspect acquired fluorescence data, such as data generated from starvation and recovery experiments. This can prove useful in order to identify cytotoxicity as a complicating side-effect of a drug treatment regime that leads to autophagy. Since the disposable counting slides are plastic, autofluorescence can occur with the excitation and emission of Cyto-ID® Green autophagy dye, which may give rise to high background signals. However, the software can automatically remove the background signal to obtain the actual target fluorescence without compromising the AAF calculation. While the fluorescence exposure times used with the Cellometer Vision are longer than instruments using high power lasers or LEDs, fluorescence photobleaching becomes less of an issue when performing cell-based assays. One future improvement to the Cellometer image-based cytometer would be to develop a higher throughput automated system that can analyze more cells for better statistical analysis, as well as the ability to analyze multiple samples, facilitating higher-throughput cell-based drug screening of inhibitors and activators of autophagy, apoptosis, necrosis and other physiological phenomena of interest.
Materials and Methods
Image-based cytometry instrumentation and disposable counting chamber
The Cellometer Vision instrumentation has been described previously.Citation20 The system utilizes bright-field (BR) and dual-fluorescent (FL1 and FL2) imaging modes to quantitatively analyze and measure the fluorescence intensities of target cells (). Bright-field imaging uses a white light-emitting diode (LED) and fluorescent imaging uses two different monochromatic LEDs (470 and 525 nm) as the excitation light sources. The monochromatic LEDs are combined with two specific filter optics modules (excitation/emission), VB-535-402 (475/535 nm) and VB-595-502 (525/595 nm). The overall resolution of the Cellometer Vision is a combination of optical magnification and camera resolution, which results in a digital imaging capability of ~1.30 μm2/pixel. Typically, the fluorescently stained cell sample is pipetted into Nexcelom’s disposable counting chambers, which hold precisely 20 µl volume and have a fixed height of less than 100 µm. The counting chamber is held in position by a stage, which automatically moves to four locations on the chamber for cellular analysis by the Cellometer software. The software analyzes three image channels (BR, FL1 and FL2) and generates a fluorescent data set that is automatically exported to FCS Express 4 Flow Cytometry (De Novo Software). In this work, FL1 and FL2 images were specifically analyzed for Cyto-ID® Green autophagy dye and propidium iodide fluorescence, respectively. The concentration dynamic range of Cellometer Vision is 1 × 10⁵–7 × 10⁷ cells/ml. Acquisition of the images and cell analysis requires less than 2 min, depending on the exposure time of the two fluorescent channels.
Cell lines and reagents preparation
The Jurkat cell line (ATCC, TIB-152) was cultured and grown to log phase in RPMI medium (30-2001) supplemented with 10% fetal bovine serum (FBS, ATCC, 30-2020) and 1% pen/strep antibiotics (Sigma-Aldrich, P4458). PC-3 cells (ATCC, CRL-1435) were cultured and grown to 70% confluence in F-12K medium (ATCC, 30-2004) supplemented with 10% fetal bovine serum and 1% pen/strep antibiotics in a 24-well plate (BD, 353047). Human cervical adenocarcinoma epithelial HeLa cells (ATCC, CCL-2) were cultured in Eagle’s minimum essential medium (EMEM, Sigma-Aldrich, M2279) with low glucose, supplemented with 10% fetal bovine serum and 1% of pen/strep. The cell culture was maintained in an incubator at 37°C and 5% CO2.
The Cyto-ID® Green autophagy dye was provided as a component of a kit by Enzo Life Sciences, Farmingdale, NY (ENZ-51031-K200). The kit also included Hoechst 33342, tamoxifen (50 mM) and 10× assay buffer. The probe is a cationic amphiphilic tracer (CAT) dye that rapidly partitions into cells in a similar manner as many cationic drugs. The dye is taken up by passive diffusion across the plasma membrane bilayer and does not require protein binding or transporter activity. Careful selection of titratable functional moieties on the dye prevents its accumulation within lysosomes, but enables labeling of vacuoles associated with the autophagy pathway. Additionally, an enhancement in the fluorescence emission intensity of the dye likely occurs upon compartmentalization with the lamellar membrane structures associated with autophagic vesicles. We and others have generated data documenting the dye’s selectivity for autophagic vesicles. The excitation and emission maxima of the dye are 463 and 534 nm, respectively. Propidium iodide was acquired from Nexcelom Bioscience (CS1-0109-5ML) and used as is for fluorescently staining nonviable Jurkat cells, in order to exclude the necrotic cells during data analysis.
For performance of starvation and recovery experiments, Earle’s balanced salts solution (EBSS, E2888) was obtained from Sigma-Aldrich and used as the nutrients-deprived media. For autophagic flux experiments, chloroquine (CQ, C6628) and dimethyl sulfoxide (DMSO, D8418) were obtained from Sigma-Aldrich, and the CQ was diluted directly into the DMSO to a concentration of 30 mM before use. For drug treatment, rapamycin and ethanol were obtained from Sigma-Aldrich (R0395), and the rapamycin was diluted directly into ethanol to a final concentration of 20 mM.
Cyto-ID® Green autophagy dye staining procedure for autophagy detection
The Cyto-ID® Green autophagy dye was prepared following the protocol from the manufacturer. The 10× assay buffer was allowed to warm to room temperature and then diluted to 1× with 9 ml of deionized H2O and 1 ml of the buffer. The Cyto-ID® Green autophagy dye solution was prepared by mixing 8 µl of the dye and 4 ml of 1× assay buffer. The collected suspension cells should be adjusted to a final concentration of approximately 1 × 10⁶ cells/ml. The cell sample is centrifuged for 5 min at 1400 rpm, and 100 or 500 µl of the dye is pipetted in for image-based or flow cytometry, respectively. The sample is shielded from exposure to direct light and incubated for 30 min at 37°C, followed by a wash and resuspension with 100 or 500 µl of 1× assay buffer before imaged-based or flow cytometric analysis, respectively. A slight modification was made in the standard protocol, wherein instead of using live cell-permeable Hoechst 33342 dye for total cells detection, live cell impermeable propidium iodide (10 µl) was used to facilitate exclusion of the nonviable cells in the sample during data analysis.
Validation of Cyto-ID® Green autophagy dye
The Cyto-ID® Green autophagy dye has been shown previously to specifically detect autophagy in live cells.Citation16 In order to validate the staining capability of the dye, two experiments were performed using HeLa cells. First, HeLa cells were incubated overnight in EMEM medium, and 3 µM of rapamycin in the absence or presence of 10 mM 3-methyladenine (3-MA, Sigma-Aldrich, M9281), a known autophagy inhibitor. After overnight incubation, the treated HeLa cells are stained with Cyto-ID® Green autophagy dye for 10 min at 37°C. In addition, HeLa cells were incubated in EBSS or EMEM medium for 1 h at 37°C. Following the incubation, both starved and control samples were incubated with Cyto-ID® Green autophagy dye and 10 µM of Hoechst 33342 for 15 min at 37°C before analysis.
In order to demonstrate colocalization of the dye with another autophagy marker, HeLa cells at 70% confluence were transfected using PremoTM Autophagy Sensor LC3B-RFP (Invitrogen, P36236) following manufacturer's instruction. HeLa cells cells were then incubated overnight in EMEM medium with 10 µM of tamoxifen. After overnight incubation, the treated HeLa cells were stained with Cyto-ID® Green autophagy dye for 10 min at 37°C.
The stained HeLa cells were analyzed using a fluorescence microscope (Carl Zeiss) with a 63× magnification. Cyto-ID® Green autophagy dye, Hoechst 33342 and RFP were examined using the FITC, DAPI and Texas Red filter set, respectively.
Starvation and recovery experiments
Jurkat cells were collected from the culture media and centrifuged in two centrifuge tubes with equal volume. The control tube was resuspended in RPMI cell culture media, while the cells in the second tube were washed three times and incubated with EBSS media to induce amino acid starvation. The cells in both tubes were transferred to cell culture flasks for 2 h incubation at 37°C. After 2 h, each cell sample was collected and stained following the procedure described above. The stained cells were then analyzed by image-based and flow cytometry. Nutrient-starved Jurkat cells were then centrifuged and resuspended in RPMI media for a 1-h recovery period. After recovery, the staining procedure was repeated and the cells were analyzed again by image-based and flow cytometry.
Autophagic flux assay
An autophagic flux assay was performed to further compare image-based and flow cytometry. The experiment utilized an autophagy inhibitor compound, chloroquine, to prevent the degradation of autophagosomes. Jurkat cells were collected and used to prepare four samples: control, nutrient-starved, control + CQ and nutrient-starved + CQ. The final concentration of CQ was approximately 30 µM with ~1% of DMSO in all samples. The cells are incubated in each condition for 2 h and analyzed with image-based and flow cytometry for comparison.
Time-course measurement of rapamycin-induced autophagy
In order to show the capability of image-based cytometry for dose-response analysis, rapamycin was selected to induce autophagy in the Jurkat cells. Five rapamycin solutions were prepared using RPMI media at 0.01, 0.1, 1, 10 and 100 µM final concentration with ~1% ethanol. The Jurkat cells were centrifuged and resuspended in each rapamycin solution, including a control with only RPMI medium and ~1% ethanol. Each sample was incubated in cell culture flasks before Cyto-ID® Green autophagy dye and propidium iodide staining. Analysis was performed at 4, 8 and 18 h using the image-based cytometer.
To demonstrate the capability of image-based cytometry for autophagy detection in adherent cells, PC-3 cells were treated with rapamycin at 1, 10 and 100 µM for 4 h. After 4 h treatment, rapamycin-containing media was aspirated off and trypsin-EDTA 1× solution (ATCC, 30-2101) was added for trypsinization at 37°C and 5% CO2 for 20 min. Cells were then centrifuged at 2000 rpm and resuspended in the Cyto-ID® Assay buffer before performing autophagy staining. Fluorescence measurements were performed after 4 h treatment using the image-based cytometer.
Comparison of dose-response profiles of rapamycin and tamoxifen
The dose response effects of rapamycin and tamoxifen were analyzed using image-based cytometry to demonstrate the ability of screening small molecule modulators in a drug discovery context. Five solutions were prepared using RPMI media 0.01, 0.1, 1, 10 and 100 µM final concentration of rapamycin and tamoxifen. The Jurkat cells were centrifuged and resuspended in each solution, including controls with only RPMI medium supplemented with ~1% ethanol or DMSO (vehicle controls for rapamycin or tamoxifen, respectively). Each sample was incubated in cell culture flasks before Cyto-ID® Green autophagy dye and propidium iodide staining. Fluorescence analysis was performed after 18 h of incubation using image-based cytometry.
Image-based cytometric analysis
To measure the fluorescent autophagic signals of each cell sample, the appropriate fluorescence optics modules were selected for the Cyto-ID® Green autophagy dye and propidium iodide. VB-535-402 and VB-595-502 were used to detect Cyto-ID® Green autophagy dye and propidium iodide, respectively. The imaging exposure times for Cyto-ID® Green autophagy dye and propidium iodide were 6000 and 1000 ms, respectively. The Cellometer Vision software automatically analyzes the captured images and exports the fluorescent data into FCS Express 4 Flow Cytometry for population analysis. Each sample analysis was performed in duplicate. It is important to note that image-based cytometry is used to analyze the fluorescence differently than flow cytometry, since only the fluorescent signal from autophagosomes are measured, instead of total cellular fluorescence from the latter method. shows the data analysis method employed for drug-induced autophagy measurement, where the captured fluorescent images are analyzed with the Cellometer software and the propidium iodide fluorescence is plotted with respect to the Cyto-ID® Green autophagy dye fluorescence. Since propidium iodide is an indicator of nonviable cells, the data can be gated to analyze only viable cells stained with Cyto-ID® Green autophagy dye in the fluorescence histogram.
Flow cytometric analysis
Flow cytometry was used for comparison with the image-based cytometry method for autophagy detection. In the starvation and recovery assay as well as the autophagic flux assay, the stained Jurkat cells were collected at a concentration of 1 × 10⁶ cells/ml and protected from exposure to direct light after staining. Experiments were performed using a FACS Calibur benchtop flow cytometer (BD Biosciences) equipped with a blue (488 nm) and violet (407 nm) laser. Cyto-ID® Green autophagy dye fluorescence was measured in the FL1 channel (530 nm) with blue laser excitation. The flow cytometry data was exported and analyzed in FCS Express 4 Flow Cytometry software and each sample was analyzed in duplicate.
Statistical analysis
Image-based and flow cytometry data were analyzed by comparison of mean fluorescence, through the calculation of the autophagy activity factor (AAF) shown in Equation 1:
wherein MFItreated and MFIcontrol are the mean fluorescence intensity values from treated and control samples. This metric is based upon a similar approach that is commonly employed in the assessment of fluorescent signal between control and treated groups in multidrug resistance experiments, using a term referred to as multidrug resistance activity factor (MAF).Citation28 AAF is a unitless term measured as the difference between the amount of the Cyto-ID® Green autophagy dye accumulated within cells in the presence and absence of an autophagy inducer. The fluorescence measurement in the presence of the autophagy inducer constitutes the maximal potential fluorescence for the given cell population when autophagic vesicles have been generated. This can represent a standardization method, which eliminates unknown cell type-specific variables that may influence dye accumulation, such as cell size, morphology and volume, allowing the potential for intra- and interlaboratory comparison of results.
| Abbreviations: | ||
| AAF | = | autophagy activity factor |
| BR | = | bright field |
| CQ | = | chloroquine |
| DMSO | = | dimethyl sulfoxide |
| EBSS | = | Earle’s balanced salt solution |
| FL | = | fluorescence |
| FL1 | = | fluorescence channel 1 |
| FL2 | = | fluorescence channel 2 |
| GFP | = | green fluorescent protein |
| IBC | = | image-based cytometry |
| RFP | = | red fluorescent protein |
Disclosure of Potential Conflicts of Interest
The authors, L.L.C., W.P., N.L., D.K., B.L. and J.Q. declare competing financial interests, and the work performed in this manuscript is for reporting on product performance of Nexcelom Bioscience, LLC. The performance of the instrumentation has been compared with standard approaches currently used in the biomedical research institutions.
References
- Shintani T, Klionsky DJ. Autophagy in health and disease: a double-edged sword. Science 2004; 306:990 - 5; http://dx.doi.org/10.1126/science.1099993; PMID: 15528435
- Kondo Y, Kanzawa T, Sawaya R, Kondo S. The role of autophagy in cancer development and response to therapy. Nat Rev Cancer 2005; 5:726 - 34; http://dx.doi.org/10.1038/nrc1692; PMID: 16148885
- Huang J, Klionsky DJ. Autophagy and human disease. Cell Cycle 2007; 6:1837 - 49; http://dx.doi.org/10.4161/cc.6.15.4511; PMID: 17671424
- Hippert MM, O’Toole PS, Thorburn A. Autophagy in cancer: good, bad, or both?. Cancer Res 2006; 66:9349 - 51; http://dx.doi.org/10.1158/0008-5472.CAN-06-1597; PMID: 17018585
- Lee HK, Iwasaki A. Autophagy and antiviral immunity. Curr Opin Immunol 2008; 20:23 - 9; http://dx.doi.org/10.1016/j.coi.2008.01.001; PMID: 18262399
- White EJ, Martin V, Liu J-L, Klein SR, Piya S, Gomez-Manzano C, et al. Autophagy regulation in cancer development and therapy. Am J Cancer Res 2011; 1:362 - 72; PMID: 21969237
- Chen N, Karantza-Wadsworth V. Role and regulation of autophagy in cancer. Biochim Biophys Acta 2009; 1793:1516 - 23; http://dx.doi.org/10.1016/j.bbamcr.2008.12.013; PMID: 19167434
- He C, Klionsky DJ. Regulation mechanisms and signaling pathways of autophagy. Annu Rev Genet 2009; 43:67 - 93; http://dx.doi.org/10.1146/annurev-genet-102808-114910; PMID: 19653858
- Kundu M, Thompson CB. Autophagy: basic principles and relevance to disease. Annu Rev Pathol 2008; 3:427 - 55; http://dx.doi.org/10.1146/annurev.pathmechdis.2.010506.091842; PMID: 18039129
- Deretic V. Autophagosome and phagosome. Totowa, NJ: Humana Press; 2008. 9 p.
- Thorburn A. Apoptosis and autophagy: regulatory connections between two supposedly different processes. Apoptosis 2008; 13:1 - 9; http://dx.doi.org/10.1007/s10495-007-0154-9; PMID: 17990121
- Klionsky DJ, Cuervo AM, Seglen PO. Methods for monitoring autophagy from yeast to human. Autophagy 2007; 3:181 - 206; PMID: 17224625
- Mizushima N, Yoshimori T, Levine B. Methods in mammalian autophagy research. Cell 2010; 140:313 - 26; http://dx.doi.org/10.1016/j.cell.2010.01.028; PMID: 20144757
- Klionsky DJ, Abeliovich H, Agostinis P, Agrawal DK, Aliev G, Askew DS, et al. Guidelines for the use and interpretation of assays for monitoring autophagy in higher eukaryotes. Autophagy 2008; 4:151 - 75; PMID: 18188003
- Vázquez CL, Colombo MI. Assays to assess autophagy induction and fusion of autophagic vacuoles with a degradative compartment, using monodansylcadaverine (MDC) and DQ-BSA. Methods Enzymol 2009; 452:85 - 95; http://dx.doi.org/10.1016/S0076-6879(08)03606-9; PMID: 19200877
- Lee JS, Lee GM. Monitoring of autophagy in Chinese hamster ovary cells using flow cytometry. Methods 2012; 56:375 - 82; http://dx.doi.org/10.1016/j.ymeth.2011.11.006; PMID: 22142658
- Klappan AK, Hones S, Mylonas I, Brüning A. Proteasome inhibition by quercetin triggers macroautophagy and blocks mTOR activity. Histochem Cell Biol 2012; 137:25 - 36; http://dx.doi.org/10.1007/s00418-011-0869-0; PMID: 21993664
- Warenius HM, Kilburn JD, Essex JW, Maurer RI, Blaydes JP, Agarwala U, et al. Selective anticancer activity of a hexapeptide with sequence homology to a non-kinase domain of Cyclin Dependent Kinase 4. Mol Cancer 2011; 10:72; http://dx.doi.org/10.1186/1476-4598-10-72; PMID: 21668989
- Phadwal K, Alegre-Abarrategui J, Watson AS, Pike L, Anbalagan S, Hammond EM, et al. A novel method for autophagy detection in primary cells: Impaired levels of macroautophagy in immunosenescent T cells. Autophagy 2012; 8; http://dx.doi.org/10.4161/auto.18935; PMID: 22302009
- Chan LL, Zhong X, Qiu J, Li PY, Lin B. Cellometer vision as an alternative to flow cytometry for cell cycle analysis, mitochondrial potential, and immunophenotyping. Cytometry A 2011; 79:507 - 17; http://dx.doi.org/10.1002/cyto.a.21071; PMID: 21538841
- Chan LL-Y, Lai N, Wang E, Smith T, Yang X, Lin B. A rapid detection method for apoptosis and necrosis measurement using the Cellometer imaging cytometry. Apoptosis 2011; 16:1295 - 303; http://dx.doi.org/10.1007/s10495-011-0651-8; PMID: 21910006
- Robey RW, Lin B, Qiu J, Chan LL, Bates SE. Rapid detection of ABC transporter interaction: potential utility in pharmacology. J Pharmacol Toxicol Methods 2011; 63:217 - 22; http://dx.doi.org/10.1016/j.vascn.2010.11.003; PMID: 21112407
- Chan LL, Zhong X, Pirani A, Lin B. A novel method for kinetic measurements of rare cell proliferation using Cellometer image-based cytometry. J Immunol Methods 2012; 377:8 - 14; http://dx.doi.org/10.1016/j.jim.2012.01.006; PMID: 22265885
- Levy JMM, Thorburn A. Targeting autophagy during cancer therapy to improve clinical outcomes. Pharmacol Ther 2011; 131:130 - 41; http://dx.doi.org/10.1016/j.pharmthera.2011.03.009; PMID: 21440002
- Tallóczy Z, Jiang W, Virgin HW 4th, Leib DA, Scheuner D, Kaufman RJ, et al. Regulation of starvation- and virus-induced autophagy by the eIF2α kinase signaling pathway. Proc Natl Acad Sci U S A 2002; 99:190 - 5; http://dx.doi.org/10.1073/pnas.012485299; PMID: 11756670
- Tanemura M, Saga A, Kawamoto K, Machida T, Deguchi T, Nishida T, et al. Rapamycin induces autophagy in islets: relevance in islet transplantation. Transplant Proc 2009; 41:334 - 8; http://dx.doi.org/10.1016/j.transproceed.2008.10.032; PMID: 19249550
- Gozuacik D, Kimchi A. Autophagy as a cell death and tumor suppressor mechanism. Oncogene 2004; 23:2891 - 906; http://dx.doi.org/10.1038/sj.onc.1207521; PMID: 15077152
- Holló Z, Homolya L, Davis CW, Sarkadi B. Calcein accumulation as a fluorometric functional assay of the multidrug transporter. Biochim Biophys Acta 1994; 1191:384 - 8; http://dx.doi.org/10.1016/0005-2736(94)90190-2; PMID: 7909692