
Abstract
Pancreatic cancer is one of the most lethal of human malignancies, and potent therapeutic options are lacking. Inhibition of cell cycle progression through pharmacological blockade of cyclin-dependent kinases (CDK) has been suggested as a potential treatment option for human cancers with deregulated cell cycle control. Dinaciclib (SCH727965) is a novel small molecule multi-CDK inhibitor with low nanomolar potency against CDK1, CDK2, CDK5 and CDK9 that has shown favorable toxicity and efficacy in preliminary mouse experiments, and has been well tolerated in Phase I clinical trials. In the current study, the therapeutic efficacy of SCH727965 on human pancreatic cancer cells was tested using in vitro and in vivo model systems. Treatment with SCH727965 significantly reduced in vitro cell growth, motility and colony formation in soft agar of MIAPaCa-2 and Pa20C cells. These phenotypic changes were accompanied by marked reduction of phosphorylation of Retinoblastoma (Rb) and reduced activation of RalA. Single agent therapy with SCH727965 (40 mg/kg i.p. twice weekly) for 4 weeks significantly reduced subcutaneous tumor growth in 10/10 (100%) of tested low-passage human pancreatic cancer xenografts. Treatment of low passage pancreatic cancer xenografts with a combination of SCH727965 and gemcitabine was significantly more effective than either agent alone. Gene Set Enrichment Analysis identified overrepresentation of the Notch and Transforming Growth Factor-beta (TGF-beta) signaling pathways in the xenografts least responsive to SCH727965 treatment. Treatment with the cyclin-dependent kinase inhibitor SCH727965 alone or in combination is a highly promising novel experimental therapeutic strategy against pancreatic cancer.
Disclosure of Potential Conflicts of Interest
R.B. is an employee of Merck Research Laboratories, Kenilworth, NJ.
Acknowledgments
The authors thank Schering-Plough Biopharma (Palo Alto, CA) for synthesizing the cyclin-dependent kinase inhibitor Dinaciclib for this study.
This work was supported by NIH R01CA134767 to B.D.N. and A.M. B.D.N. was supported by NIH R01CA085567, and grants from the Flight Attendant Medical Research Foundation (FAMRI) and the National Pancreas Foundation. A.M. was supported by the Sol Goldman Pancreatic Cancer Research Center, the Michael Rolfe Foundation for Pancreatic Cancer Research, and NIH R01CA113669. G.F. was supported by BONFOR grant number O-111.0001.2, by the German Cancer Foundation (Deutsche Krebshilfe) grant number 109215 and by the European Community's Seventh Framework Program (FP7-2007–2013) under grant agreement HEALTH-F2-2011-256986. H.A. received generous support from the D'Amato Family.
Figures and Tables
Figure 1 Cyclin dependent kinase inhibitor SCH727965 reduces growth, colony formation and motility of pancreatic cancer cells in vitro. (A) Treatment with SCH727965 causes dose-dependent growth retardation of pancreatic cancer cells in vitro as observed in MTT assays. (B) SCH727965 significantly reduced colony formation of MIAPaCa-2 cells in soft agar at concentrations of 5 and 10 nM, respectively. Incubation with SCH727965 inhibited migration of MIAPaCa-2 and Pa20C cells in BD FluoroBlok migration assays (C), and Pa20C cells in wound healing assays (D).
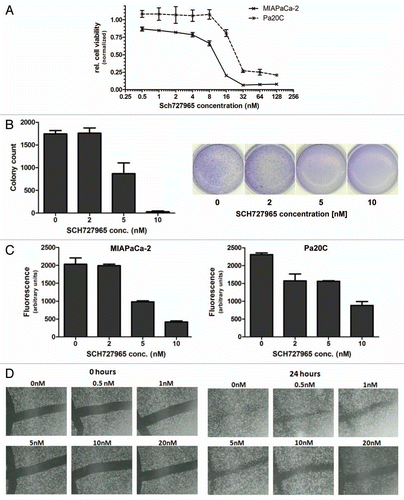
Figure 2 Modified Boyden chamber assays show decreased in vitro cell motility of Pa20C cells after treatment with SCH727965 for 72 h.
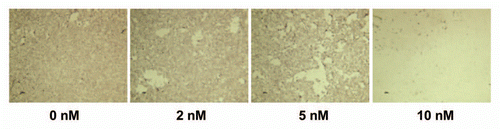
Figure 3 In vitro inhibition of RalA activation and Rb-phosphorylation by SCH727965. SCH727965-treatment for 30 min blocks activation of RalA in MIAPaCa-2 cells; RalA activation is partially rescued by enforced expression of Rgl2-CAAX (A). SCH727965 incubation for 16 h reduces phosphorylation of Rb in a dose-dependent manner as shown using protein gel blot analysis (B).
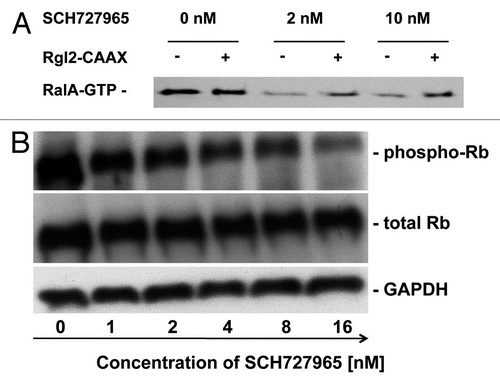
Figure 4 Spectrum of in vivo growth inhibition by SCH727965 in a panel of ten subcutaneous low-passage pancreatic cancer xenografts. Ten low-passage subcutaneous pancreatic cancer xenografts were treated with SCH727965 (n = 10 per line) or solvent only (n = 10 in each line) for 4 weeks. Growth curves show varying degrees of xenograft growth inhibition upon SCH727965-treatment. The figure shows an example with little (A) and another case with high (B) sensitivity toward SCH727965. Representative examples of xenograft tumors harvested at the end of treatment are shown for the respective lines (left tumors: controls; right tumors: SCH727965-treated). Representative histologies of control (left) and SCH727965-treated tumors (right) are shown as H&E stained tissue sections. (C) Mean inhibition of xenograft growth upon treatment with SCH727965 as compared with mock-treated controls in 10 individual xenograft lines. The diagram represents means and standard deviations of growth inhibition for each respective xenograft line.
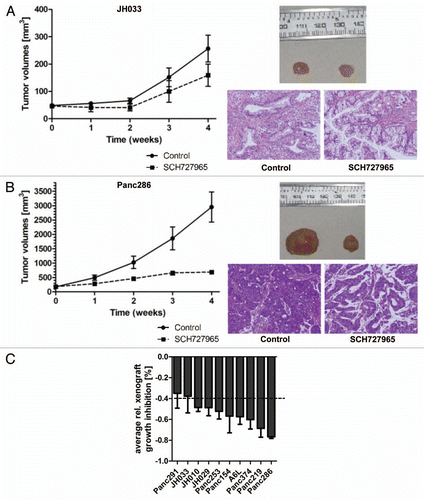
Figure 5 Surrogate biomarker of growth retardation in pancreatic cancer xenografts treated with SCH727965. (A) Tissue specimens from xenografts that showed most vs. least pronounced growth retardation upon treatment with SCH727965 in vivo were stained for Ki67 expression by immunohistochemistry. The figure shows representative sections of mock-treated controls and SCH727965-treated xenografts for each case. (B) Phospho-Rb(Ser807/811) staining of xenograft tissue specimens by IHC at cessation of treatment.
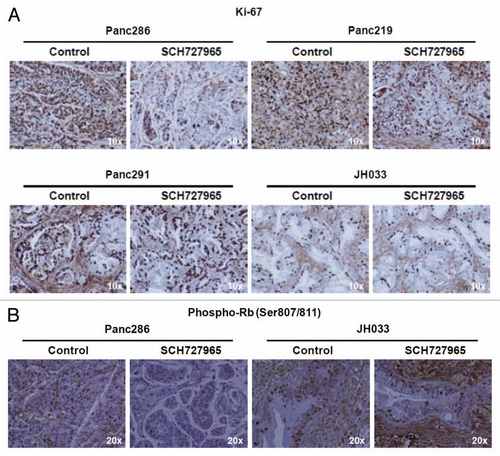
Figure 6 Combination treatment of orthotopic pancreatic cancer xenografts with SCH727965 and gemcitabine. The low passage pancreatic cancer xenograft Panc265 was implanted orthotopically into nude mice. Ten days later, tumor volume was measured by ultrasound, and mice (eight per group) were randomized into four treatment groups (vehicle-only control, SCH727965 only, gemcitabine only, and combination SCH727965 and gemcitabine), and treatment was initiated. SCH727965 (40 mg/kg) and gemcitabine (20 mg/kg) were each given twice weekly, as described in Materials and Methods. After 3 weeks of treatment, tumors were harvested and weighed. (A) relative tumor growth, calculated as (final tumor volume minus initial tumor volume/initial tumor volume); (B) average tumor weight (in grams) upon culmination of therapy. *p < 0.05; **p < 0.01; ***p < 0.001. (C) Representative macroscopic picture of mock treated intrapancreatic xenograft tumor (white arrowheads) at the end of treatment as compared with (D) combination treatment with SCH727965 plus gemcitabine. Note the different scales (indicated in mm at the right side of each image) in (C and D).
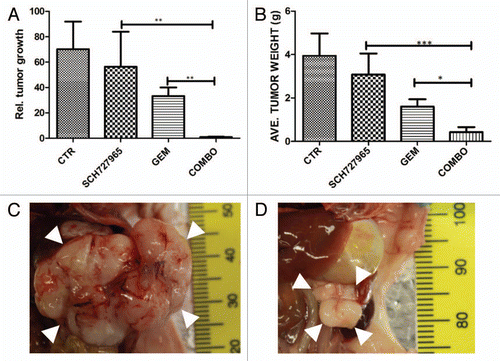
Figure 7 Gen Set Enrichment Analysis (GSEA) shows enrichment of the Notch and TGFβ pathways in SCH727965-resistant xenografts. Top, the primary result of the gene set enrichment analysis is the enrichment score (ES). GSEA calculates the ES by walking down the ranked-ordered list of genes, increasing a running-sum statistic when a gene is in the gene set and decreasing it when it is not. Middle, rank ordered list of genes (horizontal line in red and blue color). The top of this list (red color) contains genes upregulated in resistant cases. The bottom of the list (blue color) contains downregulated genes in sensitive cases. Anytime a gene from the gene set is found along the list, a vertical black bar is plotted (hit). If most of the hits are at the top of the list, then this gene set is enriched in resistant cases, if they are found at the bottom of the list then they are enriched in sensitive cases; if, however, they are distributed homogenously across the rank ordered list of genes, then that gene set is not enriched in any of the gene expression profiles (resistant vs. sensitive). These figures show enrichment of the TGFβ and Notch pathways in resistant cases. Bottom, value of the ranking metric along the list of the ranked genes.
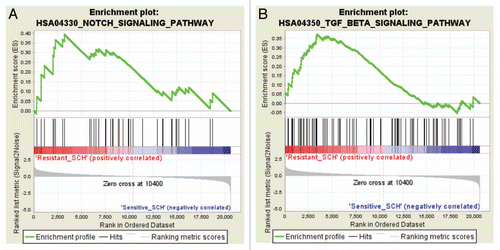
Figure 8 SMAD4 mRNA expression in xenograft tissue specimens at the end of treatment. (A) Steady-state SMAD4 mRNA levels were significantly higher in mock-treated xenografts that were resistant to SCH727965 (Panc291 and JH033) as compared with xenografts that were SCH727965 sensitive (Panc286 and Panc219). Ten tissue samples from each xenograft line were included in the analysis and mRNA expression levels were determined by means of quantitative real-time RT-PCR. (B) SMAD4 mRNA expression levels in sensitive and (C) resistant xenografts after treatment with SCH727965 or solvent, respectively.
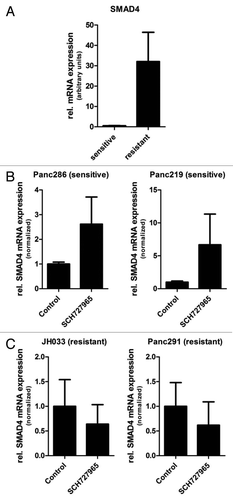
Table 1 Relative growth inhibition at the end of treatment caused by SCH727965 treatment in low-passage xenografts
Table 2 Top ten signaling pathways overrepresented in pancreatic cancer xenograft lines sensitive to SCH727965
Table 3 Top ten signaling pathways overrepresented in pancreatic cancer xenograft lines resistant to SCH727965