Abstract
The epidermal growth factor receptor (EGFR) is widely expressed in head and neck squamous cell carcinomas (HNSCC) and can activate many growth and survival pathways within tumor cells. Despite ubiquitous EGFR expression, therapies targeting the receptor are only modestly effective in the treatment of HNSCC. A consistent mechanism of resistance to EGFR targeting agents has not yet been identified in HNSCC likely due, in part, to the paucity of preclinical models. We assessed the in vitro and in vivo responses of a panel of 10 genotypically validated HNSCC cell lines to the EGFR inhibitors erlotinib and cetuximab to determine their validity as models of resistance to these agents. We defined a narrow range of response to erlotinib in HNSCC cells in vitro and found a positive correlation between EGFR protein expression and erlotinib response. We observed cross-sensitivity in one HNSCC cell line, 686LN, between erlotinib and cetuximab in vivo. We attempted to generate models of cetuximab resistance in HNSCC cell line-derived xenografts and heterotopic tumorgrafts generated directly from primary patient tumors. While all 10 HNSCC cell line xenografts tested were sensitive to cetuximab in vivo, heterotopic patient tumorgrafts varied in response to cetuximab indicating that these models may be more representative of clinical responses. These studies demonstrate the limitations of using HNSCC cell lines to reflect the heterogeneous clinical responses to erlotinib and cetuximab, and suggest that different approaches including heterotopic tumorgrafts may prove more valuable to elucidate mechanisms of clinical resistance to EGFR inhibitors in HNSCC.
Introduction
Head and neck cancer accounts for approximately 4% of all malignancies in the United StatesCitation1 and it is the sixth most common cancer worldwide.Citation2 The five year survival rate for squamous cell carcinoma of the head and neck (HNSCC) is approximately 50%Citation3 despite aggressive multimodality therapy. Wild type EGFR protein is expressed at moderate to high levels in up to 90 percent of HNSCC where EGFR expression levels have been reported to correlate with decreased survival.Citation4,Citation5 There are currently two primary approaches to targeting EGFR, monoclonal antibodies against EGFR (mAb) and small molecule tyrosine kinase inhibitors (TKI) specific for EGFR.
The EGFR antibody cetuximab was FDA-approved for the treatment of primary HNSCC in 2006 in combination with radiation and in 2011 in combination with platinum for recurrent or metastatic disease, based on positive clinical trial results.Citation6 However, despite some evidence of clinical activity, many patients remain resistant to these agents. EGFR TKIs have been studied and despite demonstrated clinical response rates of about 5–10% there are no positive phase III trials.Citation7 Elucidating mechanisms of intrinsic resistance has proven challenging, partially due to the lack of preclinical models available with which to study EGFR inhibitor resistance in HNSCC.
Cetuximab is currently the only EGFR targeting agent approved by the Food and Drug Administration for the treatment of head and neck cancer. Data suggests that approximately 85% of heavily pre-treated HNSCC patients have primary resistance to cetuximab when used as a monotherapy.Citation8 There are currently no models of this type of resistance in HNSCC that have been published to date. This may be due to challenges of detecting growth inhibition with cetuximab treatment in vitro.Citation9,Citation10
Estimates from other cancers suggest that acquired resistance to cetuximab is a common phenomenon.Citation11 Acquired resistance to cetuximab is traditionally modeled by growing cells in vitro under chronic exposure to increasing concentrations of drug to select for cells that can grow in the presence of cetuximab. This approach has been used to generate a model of resistance to cetuximab in HNSCC, although the reproducibility of cetuximab resistance has been challenging.Citation12
Efforts to generate models of cetuximab resistance from xenograft tumors in vivo have been limited to date. One group was able to generate xenografts derived from a colon cancer cell line that re-grew in the presence of cetuximab, but these tumors were generated from a cell line known to harbor an activating K-Ras mutation.Citation13,Citation14 Others reported an in vivo model of cetuximab resistance but were unable to propagate the model.Citation9 We previously generated an in vivo model of cetuximab resistance using a bladder cancer cell line known to harbor an H-Ras mutation.Citation12
EGFR is also targeted clinically with erlotinib, a TKI, and several groups have generated models of acquired resistance to the EGFR TKI erlotinib using HNSCC cell lines.Citation15,Citation16 Like with cetuximab, these models have been created by exposing an erlotinib-sensitive cancer cell line to increasing concentrations of erlotinib in vitro over an extended period of time. These models can theoretically be used to study acquired resistance to erlotinib, a phenomenon which is thought to occur eventually in nearly all patients who are treated with TKI. Studies in other cancer types suggest that the majority of EGFR-expressing tumors, however, demonstrate primary resistance to EGFR TKIs.Citation17 Modeling primary resistance to erlotinib in preclinical models is challenging due to the relatively arbitrary nature of establishing dose thresholds for erlotinib response using in vitro cell systems. Many breast and lung cancer cell lines demonstrate IC50s that are below 10 μM for erlotinib, where acquired models of erlotinib resistance typically have IC50s exceeding 10 μM.Citation18,Citation19
In the current study, we attempted to generate in vivo models of cetuximab resistance in HNSCC. We also sought to assess the range of responses of a panel of HNSCC cell lines to erlotinib and cetuximab to establish the role of HNSCC cell lines as models of resistance to EGFR inhibitors.
Results
HNSCC cell lines have a narrow range of sensitivity to erlotinib
Because many HNSCC tumors are initially resistant to erlotinib treatment, we chose to focus our studies on models of primary resistance. We obtained the previously published isogenic cell pair consisting of the HNSCC cell line 686LN and its subclone with acquired resistance to erlotinib, 686LNR30.Citation20 However, cellular genotyping to confirm the isogenicity of these cell lines determined that the resistant subclone was not an HNSCC cell line but rather a type of cervical cancer cell line, HeLa. These erlotinib-resistant HeLa cells were thus included as an erlotinib resistant control cell line while we determined responses to erlotinib across a panel of HNSCC cell lines with the goal of identifying primary resistance to erlotinib in HNSCC.
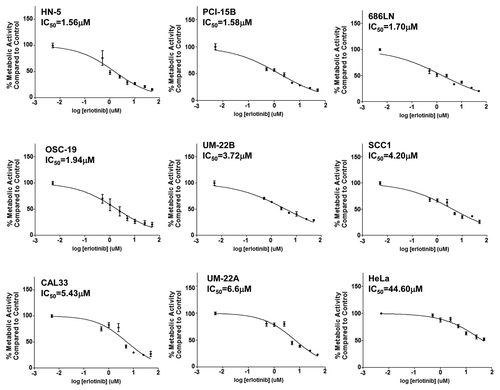
We performed cell viability assays on a panel of eight HNSCC cell lines after 72 h of growth in the presence of erlotinib or vehicle control to determine erlotinib sensitivity. There was a narrow range of erlotinib IC50s from 1.56 μM (HN-5) to 6.6 μM (UM-22A, ). One published report describes the response of 27 cell lines to erlotinib,Citation21 but these cell lines were not genotypically validated so the authenticity of these models cannot be verified. Because all of the validated HNSCC cell lines that we tested demonstrated IC50s to erlotinib below 10 μM, we included HeLa cells as an erlotinib-resistant control (IC50 = 44.60 μM). The narrow range of IC50s to erlotinib in HNSCC cell lines, coupled with the scarcity of information regarding intratumoral erlotinib concentrations in head and neck cancer, underscores the challenges of delineating sensitivity vs. resistance based on in vitro data.
Figure 1. HNSCC cells demonstrate a relatively narrow range of sensitivity to erlotinib. A panel of 8 HNSCC cell lines (HN-5, PCI-15B, 686LN, OSC-19, UM-22B, SCC1, CAL33, UM-22A) were treated in triplicate with erlotinib for 72 h followed by MTT assay. Relative IC50s were calculated from three independent experiments. IC50 values range from 1.56 μM to 6.6μM in HNSCC cell lines. HeLa cells were used as a control to demonstrate in vitro resistance to erlotinib (IC50 = 44.60 μM).
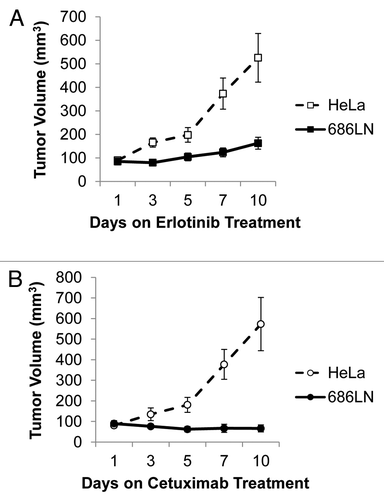
To determine erlotinib sensitivity in vivo, we used 686LN as a representative HNSCC cell line since the range of sensitivities to erlotinib was relatively narrow. HeLa cells were employed to generate an EGFR-inhibitor resistant model in vivo. Nine mice were inoculated with equal numbers of 686LN and HeLa cells on opposite flanks and we observed a significant difference in tumor volumes following 10 d of erlotinib treatment (p = 0.0036, ). Tumors derived from HeLa cells were not sensitive to erlotinib in vivo, while 686LN cells were significantly growth inhibited by erlotinib treatment. We next tested these models for cetuximab responses in vivo, to determine if cross-sensitivity to EGFR inhibitors occurs using HNSCC cell line-derived xenografts. To that end, nine mice were inoculated with equal numbers of 686LN and HeLa cells on opposite flanks and following 10 d of cetuximab treatment we observed a significant difference in tumor volumes between 686LN and HeLa cells (p = 0.0013, ). These data demonstrate that 686LN cells are sensitive to EGFR inhibition in vivo, and that response to EGFR inhibition is consistent for both cetuximab and erlotinib, implying a shared mechanism of sensitivity to these inhibitors.
Figure 2. 686LN cells are sensitive to erlotinib in vivo. (A) The HNSCC cell line 686LN was used to create xenografts in nude mice from one million cells per xenograft with Matrigel (n = 9). HeLa cells were used as an erlotinib-resistant control at a rate of one million cells per inoculation to create erlotinib-resistant control xenografts (n = 9). Animals were treated with 50 mg/kg erlotinib five times per week by oral gavage and a significant difference in tumor volumes was observed between the two cell lines on day 10 (p = 0.0036). (B) The 686LN cell line was used to create xenografts in nude mice from one million cells per xenograft with Matrigel (n = 9). HeLa cells were used as a cetuximab-resistant control at a rate of one million cells per inoculation to create xenografts (n = 9). Animals were treated with a higher than therapeutic dose of cetuximab, 2 mg weekly, by intraperitoneal injection and a significant difference in tumor volumes was observed between the two cell lines on day 10 (p = 0.0013).
Sensitivity to erlotinib correlates with EGFR protein expression levels
High EGFR expression levels have been reported to correlate with enhanced clinical responses to erlotinib in head and neck cancer and non-small cell lung cancer patients.Citation22-Citation26 This suggests that erlotinib-resistant cells may not be dependent on EGFR signaling. To test this in our models, we first determined the cell surface levels of EGFR in 686LN cells, which we have shown to be sensitive to both erlotinib and cetuximab in vitro and in vivo, compared with HeLa cells, which we have shown to be resistant to both erlotinib and cetuximab in vitro and in vivo. We detected a lower number of EGFR-negative cells in 686LN vs. HeLa (0.20 ± 0.01% for 686LN cells and 14.85 ± 0.24% for HeLa cells, p = 0.0003, ).
Figure 3. EGFR protein levels correlate with sensitivity to erlotinib.(A) 686LN cells have higher levels of EGFR on the cell surface compared with the EGFR-inhibitor resistant HeLa cell line. Live cell sorting was used on 686LN cells and HeLa cells with gating to exclude cells that uptake propidium iodine and to identify a population of low-EGFR expressing cells (0.20 ± 0.01% for 686LN cells and 14.85 ± 0.24% for HeLa cells). (B) Whole cell lysates were created from cells plated at 70% confluency in standard media and proteins were resolved and immunostained (α-EGFR, BD Transduction Labs). Densitometry was calculated as an average from three independent experiments. C. Spearman correlation of EGFR protein level with erlotinib IC50.
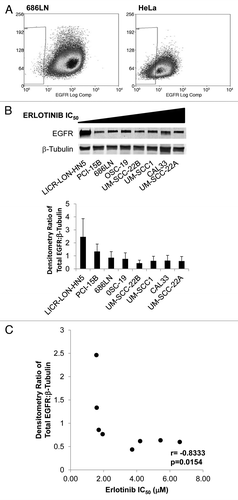
We attempted to extrapolate this finding to our panel of eight HNSCC cell lines by assessing EGFR protein expression levels from whole cell lysates normalized it to β-tubulin expression levels in the same lysates (). A Spearman correlation analysis of densitometry from three representative experiments showed a statistically significant correlation between EGFR protein level and erlotinib response in vitro (r = -0.8333, p = 0.0154, ).
HNSCC cell line-derived xenografts are uniformly sensitive to therapeutic doses of cetuximab in vivo
Based on our previous success in generating a model of cetuximab resistance using bladder cancer cells,Citation12 we attempted to generate models of cetuximab resistance using a similar approach in a panel of HNSCC cell lines. Our previous study was conducted using a starting dose of cetuximab that is equivalent to four times the human dose of cetuximab (1.6mg/week dosed as 0.8mg twice per week) and that study only yielded resistant tumors from the bladder cancer cell line. In this study, we decided to decrease the starting dose of cetuximab to mimic the therapeutic dose used in humans (0.4mg/week). We attempted to generate six xenografts each from eight HNSCC cell lines: PCI-52, UM-22A, HN-5, 1483, CAL27, OSC-19, SCC1 and SCC1c8. Each of these cell lines has been reported previously in the literature to form tumors in mice.Citation27 The SCC1c8 cell line is the reported model of cetuximab resistance generated in vitro from the HNSCC cell line SCC1.Citation28 Neither SCC1 nor SCCc8 were resistant to cetuximab in our previous study.Citation12
Treatment was initiated when tumors were palpable (generally 5–7 d post-inoculation) with low doses of cetuximab (0.4 mg weekly dosed as 0.2 mg twice per week) with the rationale that treating smaller tumors with lower doses of cetuximab would facilitate the selection of resistant tumor cells. When treatment began, the median tumor volume was < 40 mm3 across all tumor types. All but three tumors responded to treatment with this low dose of cetuximab (). We maintained cetuximab treatment for a total of 2–3 mo for each cell line xenograft model to determine the incidence of spontaneous tumor recurrence as was observed for in vivo generated models of trastuzumab resistance.Citation29 However, no HNSCC cell line-derived xenograft recurrence was observed; all but three cell line-derived xenografts were sensitive to cetuximab.
Figure 4. HNSCC cell lines are sensitive to cetuximab at therapeutic doses in vivo. Xenografts were created in nude mice from 8 HNSCC cell lines (PCI-52, UM-22A, CAL27, HN-5, 1483, OSC-19, SCC1, SCC1c8) using two million cells per inoculation. Animals were treated with 0.2mg of cetuximab 2x/week by i.p. injection using, for 7–11 weeks as indicated. Treatment was initiated upon tumor palpitation, generally 7–14 d following inoculation. Median tumor volume at the start of treatment is less than 40mm3 for all cell lines.
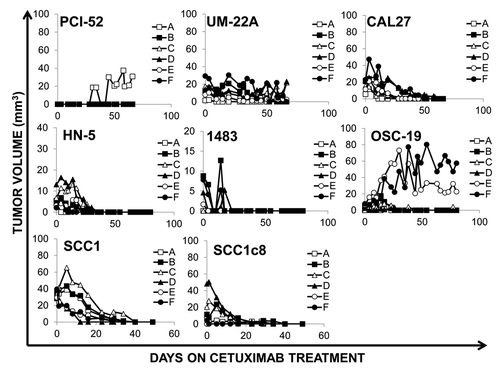
Three tumors demonstrated persistent growth in the presence of cetuximab treatment, one xenograft from the PCI-52 cell line (PCI-52A) and two xenografts from the OSC-19 cell line (OSC-19E and OSC-19F, ). We were unable to isolate any epidermal cells in culture from the PCI-52A xenograft; only fibroblasts were grown from this tumor in culture and differential digestion methods were unsuccessful to remove contaminating fibroblasts. Further, cells isolated in vitro from PCI-52A did not generate new xenografts when inoculated into another athymic nude mouse. Likewise, cells from the OSC-19E tumor did not propagate in culture or as a xenograft when inoculated into another athymic nude mouse. Cells from OSC-19F failed initially to grow in culture, but they did form another small xenograft that never exceeded 15mm3. Efforts to propagate this secondary tumor were unsuccessful in culture or as another xenograft suggesting a paucity of viable tumor cells in this tumor.
HNSCC cell line-derived xenografts are sensitive to sub-therapeutic doses of cetuximab in vivo
In an attempt to generate models of cetuximab resistance from HNSCC cell-line derived xenografts, we used larger starting tumor volumes and lower doses of cetuximab. Increases in gross tumor volume have been shown to decrease response to cetuximab in HNSCC patients,Citation30 so we hypothesized that increasing tumor volumes concurrently with decreasing the starting dose of cetuximab may permit the selection of cetuximab resistant cells. We generated six xenografts using UM-22B cells, and we did not begin treatment of the animals until the median tumor volume exceeded 50mm3 (). A summary of the treatment regimens used in this experiment can be found in . Animals were treated initially with approximately one-tenth the therapeutic dose of cetuximab, administered as 0.02 mg twice weekly by i.p. injection. The xenografts did not respond to cetuximab at this dose during the first week of treatment. We then increased the dose of cetuximab to 0.04 mg five times per week. There was a mixed response to this sub-therapeutic dose, but after two weeks at this dose no tumors had regressed completely (). Finally, we increased treatments to the therapeutic dose of cetuximab, 0.2 mg twice per week. All tumors had dramatic responses to this dose of cetuximab () but tumor regression was delayed by up to 14 d in UM-22B-derived xenografts () compared with the other HNSCC cell line xenografts (), suggesting that larger tumor volumes and sub-therapeutic doses of cetuximab may facilitate the selection of cetuximab-resistant cells.
Figure 5. HNSCC cell lines are sensitive to cetuximab at sub-therapeutic doses in vivo. (A) Xenografts were created in nude mice from UM-22B cells using two million cells per inoculation. Treatment was initiated when tumors reached a median tumor volume of approximately 50 mm3, generally 7–14 d post inoculation. Animals received cetuximab as 0.02 mg 2 x/week by i.p. injection. After one week of treatment (dashed line) the dose was increased to 0.4mg 5x/week for two weeks and then raised to 0.2 mg 2 x/week (dashed line). (B) Xenografts were created in nude mice from CAL33 cells using two million cells per inoculation. Treatment was initiated when tumors reached a median tumor volume of approximately 300 mm3, generally 7–14 d post inoculation. Animals initially received cetuximab as 0.02mg 2x/week by i.p. injection. After one week of treatment (dashed line), the dose was increased to 0.04mg 2x/week. After another week (dashed line), the dose was increased to 0.08 mg 2 x/week. After two more weeks (dashed line) the animals began one month of treatment at the therapeutic dose, 0.2 mg 2x/week. (C) Xenografts were created in nude mice from the resistant CAL33 tumor cell line (Cal33AR1) and the parental CAL33 cell line (n = 5 tumors per cell line). Two million cells were used per inoculation, and animals were treated once median tumor volume reached 50 mm3. Animals were treated for two weeks with the therapeutic dose of cetuximab, 0.2 mg 2 x/week. No significant differences were observed in tumor volumes (p = 0.732).
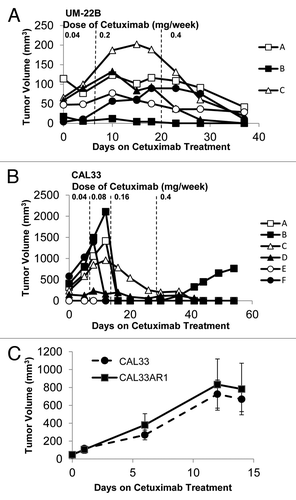
Table 1. Summary of cetuximab dosing in HNSCC xenograft model generation. The dosing schemes for the animal studies in and are listed here
In order to enhance the selection of cetuximab-resistant cells, we further increased tumor starting volumes and the amount of time during which animals were treated with sub-therapeutic doses of cetuximab. We did not begin treatment on the CAL33 xenografts until the median tumor volume exceeded 300 mm3. One xenograft (CAL33F) was nearly 600 mm3 when treatment began (). Further, we allowed four weeks of sub-therapeutic cetuximab administration to mice harboring CAL33-derived xenografts.
During the first seven days on treatment, animals with xenografts from CAL33 cells received 0.02 mg of cetuximab twice weekly. No tumors responded to treatment at this dose. During days 7–14 of treatment, animals received 0.04mg of cetuximab twice weekly. No tumors responded to this dose of cetuximab. Animals were then given 0.08 mg of cetuximab twice weekly during days 14–28 of treatment. During this two-week period, we observed dramatic reductions in tumor volume for all xenografts (). Following this month of treatment at sub-therapeutic doses, we treated animals with a therapeutic dose of cetuximab, 0.2 mg twice weekly for an additional month. During this time, all tumors regressed but one tumor subsequently had spontaneous re-growth (CAL33B, ). A summary of the treatment regimens used in this experiment can be found in .
To determine if this spontaneous re-growth was indicative of acquired cetuximab resistance, the CAL33B tumor was disaggregated and grown under cetuximab selection pressure in vitro. This cell strain was labeled CAL33AR1. Equal numbers of CAL33AR1 and CAL33 parental cells were used to generate xenografts in athymic nude mice (n = 5 per cell line). Once tumor volumes exceeded 50 mm3, animals were treated with 0.2 mg of cetuximab twice weekly for two weeks. After 15 d, no significant differences in tumor volumes were observed (), suggesting that this model of cetuximab resistance is not reproducible.
HNSCC heterotopic tumorgrafts may serve as models of cetuximab resistance
Others have reported that therapeutic results in preclinical cell line xenograft models of cancer may not accurately predict for human response to the same agents.Citation31 A more translational model system that may be more representative of human responses to anti-cancer agents is “ex”plant xenografts, or tumor grafts.Citation32,Citation33 This model is sometimes also referred to as heterotopic xenografts. Tumorgrafts are tumors that are surgically transplanted directly from human patients into severe combined immunodeficiency (SCID) mice. Mice bearing the SCID mutation have impaired T and B cell lymphocytes, as compared with the immunocompromised athymic nude mice that lack only T cells. The combined immunodeficiency of SCID mice provides enhanced abrogation of the immune system compared with nude mice.
Because our attempts to generate cetuximab resistance models with HNSCC cell lines in nude mice were not reproducible, we next attempted to generate cetuximab resistance models with HNSCC tumorgrafts. Tumorgrafts from three HNSCC patient tumors were created by implanting approximately 25 mm of each human tumor into the flanks of anesthetized SCID mice. Once tumor volume reached 50 mm3, animals were treated with sub-therapeutic doses of cetuximab (0.02 mg twice weekly). All tumors progressed at these doses to the maximum allowable tumor volume under IACUC guidelines. Once maximum tumor volume was reached, tumorgrafts were passaged into new SCID mice and the dose of cetuximab was increased with each subsequent passage of the tumors. During the third passage of these tumorgrafts, we started treatment at a sub-therapeutic dose of cetuximab (0.08 mg twice weekly) and increased to the therapeutic dose of cetuximab (0.2 mg twice weekly) in non-responsive tumorgrafts. A summary of this treatment can be found in .
Table 2. HNSCC explant xenografts may serve as models of cetuximab resistance.
We created tumorgrafts from three HNSCC patient tumors, identified as 11-6031, 11-5845, 11-5822 and at least 30% of tumorgrafts from each patient tumor demonstrated growth in the presence of therapeutic doses of cetuximab (0.2 mg twice weekly, ). From the 11-6031 tumor, 2/2 tumorgrafts (100%) demonstrated growth during treatment with 0.2mg of cetuximab twice weekly. The final volume of these tumorgrafts after 18 d of treatment was 240% greater, on average, than their starting volumes. From the 11-5845 tumor, 11/15 tumorgrafts (73%) demonstrated growth during treatment with 0.2 mg of cetuximab twice weekly. The final volume of these 11 tumorgrafts after an average of 14 d on treatment was a 270% increase, on average, relative to the starting tumor volumes. From the 11–5822 tumor, 5/16 tumorgrafts (31%) demonstrated growth during treatment with the therapeutic dose of cetuximab, 0.2 mg twice weekly. The final volume of these 5 tumorgrafts after an average of 16 d on treatment was an 89% increase, on average, relative to the starting tumor volumes. These rates of resistance (31–100%) are much more representative of HNSCC patient response rates to cetuximab, suggesting the translational relevance of tumorgrafts for modeling cetuximab resistance.
Discussion
Resistance to EGFR inhibitors remains a challenging clinical problem, and validated models of resistance to EGFR targeting agents are necessary but underdeveloped tools for studying such resistance. The work presented here has described the response of HNSCC cell lines to erlotinib and cetuximab to elucidate the role that HNSCC cell lines play in modeling response to EGFR inhibitors.
Defining primary resistance to erlotinib is challenging because the physiological concentration of intratumoral erlotinib has not been reported in HNSCC. The maximum plasma concentration, Cmax, of erlotinib in cancer patients receiving the standard oral dose of 150 mg/day has been reported in non-smokers as 950 ng/mL (2.45 μmol/L) and in smokers as 1055 ng/mL (2.2 μmol/L).Citation34 A study using carbon-labeled erlotinib to detect tissue distribution of erlotinib in mice with lung cancer xenografts suggested that erlotinib concentrations in the tumor can be up to 4-fold higher than blood concentrations. This effect is correlated with erlotinib sensitivity, i.e., erlotinib-sensitive tumors can have up to 4-fold higher intratumoral erlotinib concentrations where erlotinib-resistant tumors have intratumoral erlotinib concentrations similar to those of the blood.Citation35 There is only one study reporting clinical concentrations of intratumoral erlotinib and this was performed in a cohort of four patients with aerodigestive tract tumors. This study corroborates the preclinical findings and reports higher intratumoral erlotinib concentrations in patients who responded to erlotinib treatment. Erlotinib-responding tumors had intratumoral erlotinib concentrations of 4.1 μM and 4.8 μM, where erlotinib-resistant tumors had lower intratumoral erlotinib concentrations, 1.7 μM and 0.3 μM.Citation36 This suggests that concentrations higher than the maximum blood plasma concentration are achievable intratumorally in erlotinib-sensitive tumor tissues, but studies examining this in large cohorts of patients have not yet been reported.
The in vitro range of response to erlotinib in HNSCC cell lines has been reported previously by one group. The study shows a broad range of response to erlotinib with IC50s ranging from 10nM-10μM.Citation21 However, this report uses cell lines that were not genotypically validated. The misidentification and cross-contamination of HNSCC cell lines has recently been documented and a panel of 85 HNSCC cell lines have been genotyped and published.Citation37 Only 6 of the 27 cell lines for which erlotinib response was originally reported have been subsequently genotypically validated and recommended for future studies, making ours the largest study to date describing erlotinib response across a panel of HNSCC cell lines.
We have shown previously that EGFR is downregulated in cetuximab resistant preclinical models compared with cetuximab sensitive cells.Citation12 Data from recent trials in NSCLC and in vitro work in HNSCC suggests that high EGFR expression may correlate with response to cetuximab.Citation38,Citation39 This trend is also observed in non-small cell lung cancer for EGFR TKI responseCitation22-Citation25 and high EGFR copy number has also been reported to correlate with erlotinib response in HNSCC patients.Citation26 One trial of clinical erlotinib use in HNSCC reports that EGFR protein levels are not indicative of erlotinib response.Citation7 Because of this conflicting data, we examined EGFR expression levels in our cell lines and found that total levels of EGFR protein correlate with EGFR inhibitor sensitivity (). Reduced levels of EGFR at the cell surface are thought to play a role in both erlotinib and cetuximab resistance,Citation40,Citation41 and here we observed decreased EGFR levels both on the cell surface and in the whole cell lysates of EGFR inhibitor resistant cells.
Our attempts to generate models of resistance using genotypically validated HNSCC cell lines were unsuccessful across all ten cell lines. Alterations in tumor size, cetuximab dose, and dosing frequency were all performed in attempts to optimize the conditions under which resistant models may be generated. Unfortunately, none of these alterations managed to yield a cell line that was less sensitive to cetuximab than the original parental cell line from which they were generated.
Literature has shown that tumor size correlates with decreased sensitivity to chemotherapy and EGFR inhibitor response in mice.Citation42,Citation43 Gross tumor volume is also correlated with worse outcome for head and neck cancer patients receiving cetuximab with radiation.Citation30 We hypothesized that increasing tumor size may decrease the responsiveness of tumors to cetuximab. Our data did not support this hypothesis, however, since even greater than 10-fold increases in tumor volume did not seem to affect response to cetuximab in the HNSCC cell line xenografts ().
We were met with more success in terms of model generation by using the explant xenograft model from human tumor tissues. Our efforts at generating cell strains from these tumorgrafts have been unsuccessful to date, but the fact that 25–100% of tumorgrafts are resistant to cetuximab is much more representative to human response rates to cetuximab than our cell line xenograft results (0% cetuximab resistance). There was a range of tumorgraft response rates to cetuximab at the therapeutic dose (25%, 53%, and 100% for our three tumors). While these are interesting data that may correlate with variations in patient response or molecular pathogenesis determinants such as the presence of HPV or EGFRvIII, our sample size in the current study is too limited to perform these types of correlations. The data we have presented on this model suggests that larger sample sizes are warranted for future studies in which clinical correlations can be addressed. Our study is the first study to treat a large number of HNSCC tumorgrafts (n = 33) with the targeted anti-cancer agent cetuximab, suggesting a novel use for this model in assessing response to therapeutic agents in HNSCC. Further, our detailed report of specific tumor volumes for each replicate tumorgraft exemplify the variability inherent to tumorgraft assays and underscores the need for a large number of biological replicates in tumorgraft assays when testing the response of therapeutic agents.
In conclusion, we determined the response of a panel of HNSCC cell lines to erlotinib and correlated this sensitivity with EGFR expression levels. We also examined antitumor responses to cetuximab using a panel of HNSCC cell line xenografts as well as tumorgrafts from human tumor tissues. In accordance with literature for other tumor types, we find that tumorgrafts are potentially more representative of patient response to cetuximab than HNSCC cell line xenografts.
Materials and Methods
Cells and reagents
SCC1 was derived from a primary HNSCC tumor and both SCC1 and the cetuximab-resistant clone SCC1c8 were maintained in Dulbecco’s Modified Eagle Medium (DMEM) with 10% fetal bovine serum (FBS) and 0.4ug/mL hydrocortisone.Citation28 HN-5, OSC-19, PCI-52, UM-22A, CAL33, 1483 and CAL27 are primary HNSCC cell lines and UM-22B, 686LN and PCI-15B are derived from metastatic cervical lymph nodes from patients with HNSCC.Citation27 OSC-19 cells were maintained in Modified Eagle Medium (MEM) with 10% FBS and 1% non-essential amino acids. HN-5 and 686LN cells were maintained in DMEM/F-12 + 10% FBS. PCI-52, PCI-15B, UM-22A, UM-22B, CAL33, 1483, CAL27, T24 and A431 cells were maintained in DMEM + 10% FBS. T24 is derived from a transitional bladder carcinomaCitation44 and A431 is an epidermoid carcinoma of the vulva.Citation45 UM-22A and UM-22B cells were a generous gift from Dr. Tom Carey (University of Michigan) and PCI-52 and PCI-15B cells were a generous gift from Dr. Theresa Whiteside (University of Pittsburgh). HeLa cells are a cervical cancer cell line maintained in DMEM + 10% FBS.Citation46 All cell lines were validated by genotyping within 6 mo of their use using the AmpFISTR Identifiler System (Applied Biosystems). Cetuximab-resistant clones were maintained in media with 100nM cetuximab. Cetuximab (Erbitux, ImClone Systems and Bristol-Myers Squibb) was purchased from the University of Pittsburgh Pharmacy. Erlotinib was purchased from Chemietek and resuspended in DMSO for cell studies and methyl cellulose for animal studies.
Animal studies
Animal use and care was in strict compliance with institutional guidelines established by the Institutional Animal Care and Use Committee at the University of Pittsburgh. For the HNSCC cetuximab model generation, subcutaneous xenografts were created from PCI-52, UM-22A, UM-22B, CAL27, HN-5, 1483, OSC-19, SCC1, SCC1c8 and CAL33 cell lines. Two million cells were inoculated subcutaneously onto each flank of athymic nude mice (n = 6 xenografts per cell line). Cetuximab treatment was initiated at 0.2mg twice weekly by i.p. injection immediately following tumor formation (generally 7–14 d post-inoculation) for PCI-52, UM-22A, CAL27, HN-5, 1483, OSC-19, SCC1 and SCC1c8 cells. Cetuximab treatment was initiated by i.p. injection at 0.02 mg twice weekly in UM-22B cells once median tumor volume exceeded 50 mm3 (generally 7–14 d post-inoculation). After the first week at these doses, cetuximab dose was increased to 0.04 mg five times per week. After two weeks at this dose, cetuximab dose was increased to 0.2 mg twice weekly for the remainder of the study. Cetuximab treatment was initiated at 0.02 mg twice weekly by i.p. injection in CAL33 cells once the median tumor volume exceeded 300 mm3 (generally 10–14 d post-inoculation). Cetuximab dosing was increased to 0.04mg twice weekly after one the first week of treatment and 0.08 mg twice weekly after the second week of treatment. Following two weeks of treatment at 0.08 mg twice weekly, cetuximab dose was increased to 0.2 mg twice weekly for the remainder of the study.
Heterotopic tumorgrafts
For HNSCC tumorgraft model generation, tumors were generated as follows. Following HNSCC tumor resection, patient samples were quality controlled by the University of Pittsburgh Medical Center’s Department of Pathology for 70% tumor composition, de-identified, and delivered in antibiotic/antimycotic solution. Surgical patients who were treated with curative intent for pathologically-confirmed HNSCC of the oral cavity, oropharynx, hypopharyx, or larynx gave written informed consent and donated tumor tissues for study. All tissues were collected under a tissue bank protocol approved by the University of Pittsburgh Institutional Review Board.
Tumor samples were cut into 25 mg pieces and fresh frozen or used for implantation. NOD/SCID gamma mice (Jackson Laboratories) were anesthetized using isofluorane and a small incision made in the flank. 25 mg of patient tumor was placed in the pocket of the incision site and the wound closed with surgical adhesive. Analgesic was administered and the animals were monitored until fully ambulatory. Mice were kept in isolation for 7–10 d and checked daily for wound healing. Mice were checked weekly for tumor formation.
Once tumor size reached approximately 50 mm3, generally 4–6 weeks after surgery, mice were treated with 0.02mg of cetuximab by i.p. injection twice weekly. These tumors can be referred to as passage 1. When tumor size increased beyond the maximum allowable size under IACUC guidelines, the animals were sacrificed and 25 mg of the tumor was used to create new tumorgrafts in 2–4 animals as described above, this time termed passage 2. This process was repeated and the data shown here are from passage 3. Passage 2 tumors received cetuximab at 0.04 mg of cetuximab twice weekly. Passage 3 tumors received cetuximab initially at 0.08mg twice weekly, and then this dose was increased to 0.2 mg twice weekly.
Metabolic activity assays
Cells were plated to 50% confluency a 24-well plate. Media was changed to contain new media and the appropriate drug or control at 24 h. 3-(4,5-Dimethylthiazol-2-Yl)-2,5-Diphenyltetrazolium Bromide (MTT) was added for 30 min 72 h following drug treatment. Cells were rinsed with PBS and lysed with DMSO. DMSO extracts were measured at 570 nm in an uQuant spectrophotometer to determine formazan production vs. standard controls. Each drug treatment or control was run in triplicate wells.
Flow cytometry
Flow cytometry was conducted at the UPCI Flow Cytometry Core Facility using a Beckman Coulter MoFlo High Speed Sorter. Cells were stained with Alexafluor488 anti-EGFR (Millipore) and counter-stained with Propidium Iodine. Propidium-Iodine labeled cells were excluded from analysis, and then cells were bracketed to capture a low percentage tail population of EGFR-null cells on 686LN. These same brackets were applied to the HeLa cell line and gated events were calculated from 50,000 live events for each cell line.
Immunoblotting
Immunoblots were performed on cell lysates collected at 70–80% confluency in normal growth media. Lysates were resolved on SDS-Page gels and transferred to nitrocellulose membranes prior to antibody staining (EGFR, BD Transduction Lab 60017s). Densitometry was performed using Image J.
Statistical analysis
Statistical analyses for the animal experiments using 686LN and HeLa cells are non-paired, two-tailed student’s t-tests. For measuring erlotinib response in metabolic activity assays, relative IC50 with associated 95% Confidence Intervals were calculated using GraphPad Prism v5.0. All nonlinear regression curves had an R2 value greater than 0.70. A Spearman Correlation was used to determine the relationship between erlotinib IC50 and EGFR protein expression levels.
Disclosure of Potential Conflicts of Interest
The authors have no conflicts of interest to disclose.
Acknowledgments
This project used UPCI shared resources that are supported in part by award P30CA047904. The authors wish to thank E. Michael Meyer in the UPCI Flow Cytometry Core for his assistance with the live cell sorting conducted here.
This work was funded by grants from the National Institutes of Health (F31DE020947, T32GM08424, P50CA097190, R01CA098372, P30CA047904) and the American Cancer Society.
References
- Jemal A, Siegel R, Ward E, Hao Y, Xu J, Murray T, et al. Cancer statistics, 2008. CA Cancer J Clin 2008; 58:71 - 96; http://dx.doi.org/10.3322/CA.2007.0010; PMID: 18287387
- Hunter KD, Parkinson EK, Harrison PR. Profiling early head and neck cancer. Nat Rev Cancer 2005; 5:127 - 35; http://dx.doi.org/10.1038/nrc1549; PMID: 15685196
- Marur S, Forastiere AA. Head and neck cancer: changing epidemiology, diagnosis, and treatment. Mayo Clin Proc 2008; 83:489 - 501; http://dx.doi.org/10.4065/83.4.489; PMID: 18380996
- Mrhalova M, Plzak J, Betka J, Kodet R. Epidermal growth factor receptor--its expression and copy numbers of EGFR gene in patients with head and neck squamous cell carcinomas. Neoplasma 2005; 52:338 - 43; PMID: 16059652
- Grandis JR, Tweardy DJ. Elevated levels of transforming growth factor alpha and epidermal growth factor receptor messenger RNA are early markers of carcinogenesis in head and neck cancer. Cancer Res 1993; 53:3579 - 84; PMID: 8339264
- Vermorken JB, Mesia R, Rivera F, Remenar E, Kawecki A, Rottey S, et al. Platinum-based chemotherapy plus cetuximab in head and neck cancer. N Engl J Med 2008; 359:1116 - 27; http://dx.doi.org/10.1056/NEJMoa0802656; PMID: 18784101
- Soulieres D, Senzer NN, Vokes EE, Hidalgo M, Agarwala SS, Siu LL. Multicenter phase II study of erlotinib, an oral epidermal growth factor receptor tyrosine kinase inhibitor, in patients with recurrent or metastatic squamous cell cancer of the head and neck. J Clin Oncol 2004; 22:77 - 85; http://dx.doi.org/10.1200/JCO.2004.06.075; PMID: 14701768
- Vermorken JB, Trigo J, Hitt R, Koralewski P, Diaz-Rubio E, Rolland F, et al. Open-label, uncontrolled, multicenter phase II study to evaluate the efficacy and toxicity of cetuximab as a single agent in patients with recurrent and/or metastatic squamous cell carcinoma of the head and neck who failed to respond to platinum-based therapy. J Clin Oncol 2007; 25:2171 - 7; http://dx.doi.org/10.1200/JCO.2006.06.7447; PMID: 17538161
- Viloria-Petit A, Crombet T, Jothy S, Hicklin D, Bohlen P, Schlaeppi JM, et al. Acquired resistance to the antitumor effect of epidermal growth factor receptor-blocking antibodies in vivo: a role for altered tumor angiogenesis. Cancer Res 2001; 61:5090 - 101; PMID: 11431346
- Niu G, Sun X, Cao Q, Courter D, Koong A, Le QT, et al. Cetuximab-based immunotherapy and radioimmunotherapy of head and neck squamous cell carcinoma. Clin Cancer Res 2010; 16:2095 - 105; http://dx.doi.org/10.1158/1078-0432.CCR-09-2495; PMID: 20215534
- Cunningham D, Humblet Y, Siena S, Khayat D, Bleiberg H, Santoro A, et al. Cetuximab monotherapy and cetuximab plus irinotecan in irinotecan-refractory metastatic colorectal cancer. N Engl J Med 2004; 351:337 - 45; http://dx.doi.org/10.1056/NEJMoa033025; PMID: 15269313
- Quesnelle KM, Grandis JR. Dual kinase inhibition of EGFR and HER2 overcomes resistance to cetuximab in a novel in vivo model of acquired cetuximab resistance. Clin Cancer Res 2011; 17:5935 - 44; http://dx.doi.org/10.1158/1078-0432.CCR-11-0370; PMID: 21791633
- Ciardiello F, Bianco R, Caputo R, Caputo R, Damiano V, Troiani T, et al. Antitumor activity of ZD6474, a vascular endothelial growth factor receptor tyrosine kinase inhibitor, in human cancer cells with acquired resistance to antiepidermal growth factor receptor therapy. Clin Cancer Res 2004; 10:784 - 93; http://dx.doi.org/10.1158/1078-0432.CCR-1100-03; PMID: 14760102
- Paranavitana CM. Non-radioactive detection of K-ras mutations by nested allele specific PCR and oligonucleotide hybridization. Mol Cell Probes 1998; 12:309 - 15; http://dx.doi.org/10.1006/mcpr.1998.0185; PMID: 9778456
- Seiwert TY, Jagadeeswaran R, Faoro L, Janamanchi V, Nallasura V, El Dinali M, et al. The MET receptor tyrosine kinase is a potential novel therapeutic target for head and neck squamous cell carcinoma. Cancer Res 2009; 69:3021 - 31; http://dx.doi.org/10.1158/0008-5472.CAN-08-2881; PMID: 19318576
- Benavente S, Huang S, Armstrong EA, Chi A, Hsu KT, Wheeler DL, et al. Establishment and characterization of a model of acquired resistance to epidermal growth factor receptor targeting agents in human cancer cells. Clin Cancer Res 2009; 15:1585 - 92; http://dx.doi.org/10.1158/1078-0432.CCR-08-2068; PMID: 19190133
- Mok TS, Wu YL, Thongprasert S, Yang CH, Chu DT, Saijo N, et al. Gefitinib or carboplatin-paclitaxel in pulmonary adenocarcinoma. N Engl J Med 2009; 361:947 - 57; http://dx.doi.org/10.1056/NEJMoa0810699; PMID: 19692680
- Yamasaki F, Zhang D, Bartholomeusz C, Sudo T, Hortobagyi GN, Kurisu K, et al. Sensitivity of breast cancer cells to erlotinib depends on cyclin-dependent kinase 2 activity. Mol Cancer Ther 2007; 6:2168 - 77; http://dx.doi.org/10.1158/1535-7163.MCT-06-0514; PMID: 17671085
- Yao Z, Fenoglio S, Gao DC, Camiolo M, Stiles B, Lindsted T, et al. TGF-beta IL-6 axis mediates selective and adaptive mechanisms of resistance to molecular targeted therapy in lung cancer. Proc Natl Acad Sci U S A 2010; 107:15535 - 40; http://dx.doi.org/10.1073/pnas.1009472107; PMID: 20713723
- Muller S, Su L, Tighiouart M, Saba N, Zhang H, Shin DM, et al. Distinctive E-cadherin and epidermal growth factor receptor expression in metastatic and nonmetastatic head and neck squamous cell carcinoma: predictive and prognostic correlation. Cancer 2008; 113:97 - 107; http://dx.doi.org/10.1002/cncr.23557; PMID: 18473353
- Haddad Y, Choi W, McConkey DJ. Delta-crystallin enhancer binding factor 1 controls the epithelial to mesenchymal transition phenotype and resistance to the epidermal growth factor receptor inhibitor erlotinib in human head and neck squamous cell carcinoma lines. Clin Cancer Res 2009; 15:532 - 42; http://dx.doi.org/10.1158/1078-0432.CCR-08-1733; PMID: 19147758
- Hirsch FR, Varella-Garcia M, McCoy J, West H, Xavier AC, Gumerlock P, et al, Southwest Oncology Group. Increased epidermal growth factor receptor gene copy number detected by fluorescence in situ hybridization associates with increased sensitivity to gefitinib in patients with bronchioloalveolar carcinoma subtypes: a Southwest Oncology Group Study. J Clin Oncol 2005; 23:6838 - 45; http://dx.doi.org/10.1200/JCO.2005.01.2823; PMID: 15998906
- Cappuzzo F, Hirsch FR, Rossi E, Bartolini S, Ceresoli GL, Bemis L, et al. Epidermal growth factor receptor gene and protein and gefitinib sensitivity in non-small-cell lung cancer. J Natl Cancer Inst 2005; 97:643 - 55; http://dx.doi.org/10.1093/jnci/dji112; PMID: 15870435
- Cappuzzo F, Ligorio C, Jänne PA, Toschi L, Rossi E, Trisolini R, et al. Prospective study of gefitinib in epidermal growth factor receptor fluorescence in situ hybridization-positive/phospho-Akt-positive or never smoker patients with advanced non-small-cell lung cancer: the ONCOBELL trial. J Clin Oncol 2007; 25:2248 - 55; http://dx.doi.org/10.1200/JCO.2006.09.4300; PMID: 17538169
- Sequist LV, Bell DW, Lynch TJ, Haber DA. Molecular predictors of response to epidermal growth factor receptor antagonists in non-small-cell lung cancer. J Clin Oncol 2007; 25:587 - 95; http://dx.doi.org/10.1200/JCO.2006.07.3585; PMID: 17290067
- Agulnik M, da Cunha Santos G, Hedley D, Nicklee T, Dos Reis PP, Ho J, et al. Predictive and pharmacodynamic biomarker studies in tumor and skin tissue samples of patients with recurrent or metastatic squamous cell carcinoma of the head and neck treated with erlotinib. J Clin Oncol 2007; 25:2184 - 90; http://dx.doi.org/10.1200/JCO.2006.07.6554; PMID: 17538163
- Lin CJ, Grandis JR, Carey TE, Gollin SM, Whiteside TL, Koch WM, et al. Head and neck squamous cell carcinoma cell lines: established models and rationale for selection. Head Neck 2007; 29:163 - 88; http://dx.doi.org/10.1002/hed.20478; PMID: 17312569
- Wheeler DLHS, Huang S, Kruser TJ, Nechrebecki MM, Armstrong EA, Benavente S, et al. Mechanisms of acquired resistance to cetuximab: role of HER (ErbB) family members. Oncogene 2008; 27:3944 - 56; http://dx.doi.org/10.1038/onc.2008.19; PMID: 18297114
- Ritter CA, Perez-Torres M, Rinehart C, Guix M, Dugger T, Engelman JA, et al. Human breast cancer cells selected for resistance to trastuzumab in vivo overexpress epidermal growth factor receptor and ErbB ligands and remain dependent on the ErbB receptor network. Clin Cancer Res 2007; 13:4909 - 19; http://dx.doi.org/10.1158/1078-0432.CCR-07-0701; PMID: 17699871
- Studer G, Lütolf UM, El-Bassiouni M, Rousson V, Glanzmann C. Volumetric staging (VS) is superior to TNM and AJCC staging in predicting outcome of head and neck cancer treated with IMRT. Acta Oncol 2007; 46:386 - 94; http://dx.doi.org/10.1080/02841860600815407; PMID: 17450476
- Garber K. From human to mouse and back: ‘tumorgraft’ models surge in popularity. J Natl Cancer Inst 2009; 101:6 - 8; http://dx.doi.org/10.1093/jnci/djn481; PMID: 19116380
- Hidalgo M, Bruckheimer E, Rajeshkumar NV, Garrido-Laguna I, De Oliveira E, Rubio-Viqueira B, et al. A pilot clinical study of treatment guided by personalized tumorgrafts in patients with advanced cancer. Mol Cancer Ther 2011; 10:1311 - 6; http://dx.doi.org/10.1158/1535-7163.MCT-11-0233; PMID: 21673092
- Morelli MP, Calvo E, Ordonez E, Wick MJ, Viqueira BR, Lopez-Casas PP, et al. Prioritizing Phase I Treatment Options Through Preclinical Testing on Personalized Tumorgraft. J Clin Oncol 2011; PMID: 22184402
- Hamilton M, Wolf JL, Rusk J, Beard SE, Clark GM, Witt K, et al. Effects of smoking on the pharmacokinetics of erlotinib. Clin Cancer Res 2006; 12:2166 - 71; http://dx.doi.org/10.1158/1078-0432.CCR-05-2235; PMID: 16609030
- Memon AA, Jakobsen S, Dagnaes-Hansen F, Sorensen BS, Keiding S, Nexo E. Positron emission tomography (PET) imaging with [11C]-labeled erlotinib: a micro-PET study on mice with lung tumor xenografts. Cancer Res 2009; 69:873 - 8; http://dx.doi.org/10.1158/0008-5472.CAN-08-3118; PMID: 19155297
- Petty WJ, Dragnev KH, Memoli VA, Ma Y, Desai NB, Biddle A, et al. Epidermal growth factor receptor tyrosine kinase inhibition represses cyclin D1 in aerodigestive tract cancers. Clin Cancer Res 2004; 10:7547 - 54; http://dx.doi.org/10.1158/1078-0432.CCR-04-1169; PMID: 15569985
- Zhao M, Sano D, Pickering CR, Jasser SA, Henderson YC, Clayman GL, et al. Assembly and initial characterization of a panel of 85 genomically validated cell lines from diverse head and neck tumor sites. Clin Cancer Res 2011; 17:7248 - 64; http://dx.doi.org/10.1158/1078-0432.CCR-11-0690; PMID: 21868764
- Pirker R, Pereira JR, von Pawel J, Krzakowski M, Ramlau R, Park K, et al. EGFR expression as a predictor of survival for first-line chemotherapy plus cetuximab in patients with advanced non-small-cell lung cancer: analysis of data from the phase 3 FLEX study. Lancet Oncol 2012; 13:33 - 42; http://dx.doi.org/10.1016/S1470-2045(11)70318-7; PMID: 22056021
- López-Albaitero A, Lee SC, Morgan S, Grandis JR, Gooding WE, Ferrone S, et al. Role of polymorphic Fc gamma receptor IIIa and EGFR expression level in cetuximab mediated, NK cell dependent in vitro cytotoxicity of head and neck squamous cell carcinoma cells. Cancer Immunol Immunother 2009; 58:1853 - 64; http://dx.doi.org/10.1007/s00262-009-0697-4; PMID: 19319529
- Huang WC, Chen YJ, Li LY, Wei YL, Hsu SC, Tsai SL, et al. Nuclear translocation of epidermal growth factor receptor by Akt-dependent phosphorylation enhances breast cancer-resistant protein expression in gefitinib-resistant cells. J Biol Chem 2011; 286:20558 - 68; http://dx.doi.org/10.1074/jbc.M111.240796; PMID: 21487020
- Li C, Iida M, Dunn EF, Ghia AJ, Wheeler DL. Nuclear EGFR contributes to acquired resistance to cetuximab. Oncogene 2009; 28:3801 - 13; http://dx.doi.org/10.1038/onc.2009.234; PMID: 19684613
- Thomas JM. A lung colony clonogenic cell assay for human malignant melanoma in immune-suppressed mice and its use to determine chemosensitivity, radiosensitivity and the relationship between tumour size and response to therapy. Br J Surg 1979; 66:696 - 700; http://dx.doi.org/10.1002/bjs.1800661007; PMID: 509043
- Zhu S, Belkhiri A, El-Rifai W. DARPP-32 increases interactions between epidermal growth factor receptor and ERBB3 to promote tumor resistance to gefitinib. Gastroenterology 2011; 141:1738-48 e1-2.
- Bubeník J, Baresová M, Viklický V, Jakoubková J, Sainerová H, Donner J. Established cell line of urinary bladder carcinoma (T24) containing tumour-specific antigen. Int J Cancer 1973; 11:765 - 73; http://dx.doi.org/10.1002/ijc.2910110327; PMID: 4133950
- Linsley PS, Fox CF. Direct linkage of EGF to its receptor: characterization and biological relevance. J Supramol Struct 1980; 14:441 - 59; http://dx.doi.org/10.1002/jss.400140404; PMID: 6264232
- Scherer WF, Syverton JT, Gey GO. Studies on the propagation in vitro of poliomyelitis viruses. IV. Viral multiplication in a stable strain of human malignant epithelial cells (strain HeLa) derived from an epidermoid carcinoma of the cervix. J Exp Med 1953; 97:695 - 710; http://dx.doi.org/10.1084/jem.97.5.695; PMID: 13052828