Abstract
Here, we identified the milk protein α-casein as a novel suppressor of tumor growth and metastasis. Briefly, Met-1 mammary tumor cells expressing α-casein showed a ~5-fold reduction in tumor growth and a near 10-fold decrease in experimental metastasis. To identify the molecular mechanism(s), we performed genome-wide transcriptional profiling. Interestingly, our results show that α-casein upregulates gene transcripts associated with interferon/STAT1 signaling and downregulates genes associated with “stemness.” These findings were validated by immunoblot and FACS analysis, which showed the upregulation and hyperactivation of STAT1 and a decrease in the number of CD44(+) “cancer stem cells.” These gene signatures were also able to predict clinical outcome in human breast cancer patients. Thus, we conclude that a lactation-based therapeutic strategy using recombinant α-casein would provide a more natural and non-toxic approach to the development of novel anticancer therapies.
Introduction
For decades, it has been recognized that multiple pregnancies and/or an extended period of lactation dramatically reduce the risk of the onset of breast cancer, both in ER(+) and ER(-) subsets.Citation1-Citation6 However, the exact mechanism(s) underlying these striking epidemiological findings have remained elusive.
One novel hypothesis is that milk itself contains as-yet-undiscovered components that function as tumor suppressor(s). In direct support of this notion, implantation of mammary tumor cells within the primary duct of the mammary gland of a constitutively lactating mouse model [Cav-3 (−/−) mice] resulted in a > 1,000-fold reduction in tumor growth.Citation7 Furthermore, addition of human milk at low concentrations to cultured mammary tumor cells dramatically inhibited their capacity for migration.Citation7 These preliminary findings provide a simple experimental model to identify which milk components possess tumor suppressor properties.
Further analysis of which gene transcripts are elevated in the mammary glands of constitutively lactating Cav-3 (−/−) mice revealed a significant upregulation of several members of the casein gene family, with α-casein being featured prominently.Citation7 Thus, we speculated that members of the casein gene family might actually function as tumor suppressors.
Here, we tested this hypothesis experimentally. First, we show that purified α-, β- and κ-casein proteins all inhibit the migration of mammary tumor cells in vitro, with α-casein being the most effective. Second, we demonstrate that recombinant expression of α-casein in mammary tumor cells significantly decreases both in vivo tumor growth (by > 5-fold) and experimental lung metastasis (by nearly 10-fold), by reducing their proliferative capacity and by increasing their sensitivity to stress-induced apoptosis, under hypoxic conditions. Mechanistically, using genome-wide transcriptional profiling, we highlight that recombinant overexpression of α-casein results in the activation of interferon-based signaling via STAT1 upregulation and hyperactivation. Thus, the possibility exists that recombinant casein family members could be used as novel anticancer therapeutics to locally or systemically treat human breast cancers.
Results
Human breast milk and its casein protein components decrease mouse mammary cell migration
It has previously been shown that Met-1 cells are a good murine model to quantitatively measure invasiveness and cell motility.Citation8 Here, to investigate the effects of human breast milk on cellular motility, we subjected Met-1 cells to a modified Boyden chamber assay. Then we added human breast milk at different concentrations to the wells, in both the lower and upper chambers, and after 6 h, we evaluated cell migration.
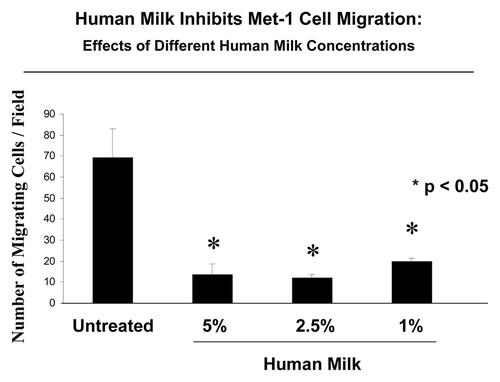
shows that Met-1 cells treated with 5%, 2.5% and 1% of milk have a significantly decreased capacity to invade the membrane, as compared with untreated control cells. Thus, regarding cell migration, human breast milk has a suppressor effect.
Figure 1. Human breast milk decreases mouse mammary tumor cell motility. Modified Boyden chambers (Transwells) were used to quantitatively measure Met-1 cells migration. Met-1 cells were added to the wells in 0.5 ml of serum-free DMEM. Cells migrated through non-coated 8-μm filter, throughout a 6-h period, in response to 10% FBS serum placed in the lower chambers. Then, the membrane was processed for crystal violet staining and migrating cells were counted. Motility of Met-1 cells treated with 5%, 2.5% and 1% human breast milk was significantly decreased vs. untreated cells, up to 5-fold. *p < 0.05, untreated vs. treated; Student’s t-test.
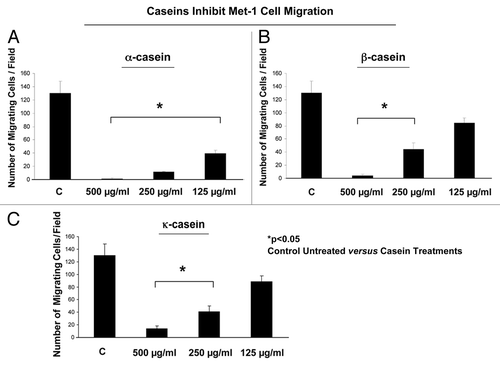
Following these promising results, we wanted to test the effect of three different milk proteins (α-, β- and κ-caseins) on Met-1 cell motility. All of these proteins were administered at the concentrations of 500 µg/ml, 250 µg/ml and 125 µg/ml in both the lower and upper chamber. shows the results of this assay. Interestingly, all three caseins significantly reduced the migration of Met-1 cells at the concentrations of 500 µg/ml and 250 µg/ml. Most interestingly, only α-casein was able to significantly reduce the cell migration at the lower tested concentration of 125 µg/ml. Moreover, α-casein, among casein proteins, was more powerful in the fold reduction of migrating cells compared with the untreated controls. In light of these findings, we decided to use α-casein as the best candidate for our experiments.
Figure 2. Casein proteins inhibit mammary tumor cell migration. α-, β- and κ-caseins were administrated to the Boyden chambers into the lower and the upper chambers, where Met-1 cells were seeded. Caseins were used at different concentrations: 500, 250 and 125 µg/ml. (A) α-casein inhibits cell migration at all the tested concentrations as compared with the untreated cells. (B and C) β- and κ-casein significantly reduced the Met-1 migration only at the concentrations of 250 and 125 µg/ml. *p < 0.05, untreated vs. treated; Student’s t-test.
Control experiments with BSA demonstrated that these migration inhibitory effects were specific for the caseins (data not shown).
Derivation of Met-1 cells expressing α-casein
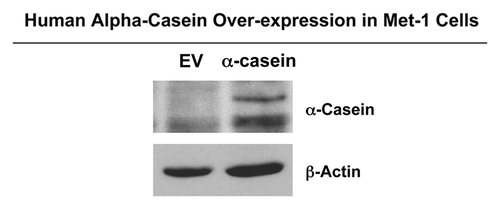
Next, we wanted to investigate the effect of α-casein in vivo to elucidate its role in the pathogenesis of human breast cancer. Given that Met-1 cells have high metastatic capacity and are able to form primary tumors,Citation9,Citation10 we have used Met-1 as a xenograft mouse model. Stable Met-1 cell lines expressing human α-casein or the empty vector control were derived by lentiviral transduction and puromycin selection. Immunoblot analysis with anti-α-casein antibodies shows that α-casein is well-expressed in these Met-1 stable cell lines (). Virtually identical results were also obtained by using a second independent approach (detailed in the Materials and Methods section) to generate α-casein-overexpressing Met-1 cells (data not shown).
Figure 3. Derivation of Met-1 mammary cell lines expressing human α-casein. Immunoblot analysis, with an antibody directed against human α-casein, was performed on Met-1 cells after selection with puromycin to confirm the efficiency of stable lentiviral transduction with human α-casein. As expected, recombinant α-casein was absent in Met-1 empty vector control. β-actin was used as a loading control.
α-Casein expression induces Met-1 cell apoptosis and decreases cell proliferation
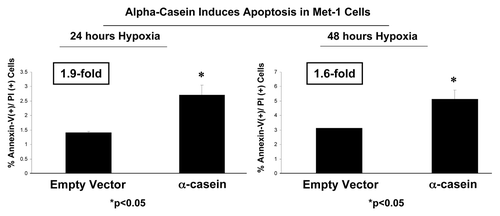
We investigated the effect of α-casein expression on stress-induced apoptosis and cell proliferation. Then we performed the Annexin V assay to determine tumor cell apoptotic rates using Met-1 cells transduced with α-casein and empty vector alone. Cells were treated under hypoxia conditions (0.5% O2) for 24 and 48 h. Importantly, results obtained from the Annexin V assay show that α-casein increases apoptosis by 1.9-fold after 24 h and by 1.64-fold after 48 h as compared with the vector control alone ().
Figure 4. α-casein expression induces apoptosis in Met-1 cells. Note that α-casein increases the sensitivity to stress-induced apoptosis by (A) 1.9-fold after 24 h and (B) 1.64-fold after 48 h, under hypoxic conditions.
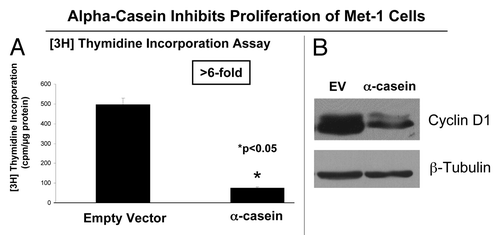
Moreover, we performed the (3H) thymidine incorporation assay to study the role of α-casein in cell proliferation. shows that Met-1 cells expressing α-casein displayed lower proliferative rates. This result was supported by immunoblot analysis showing decreased cyclin D1 expression in Met-1 cells expressing α-casein (). Thus, functionally, we have shown that the expression of α-casein drives apoptosis and reduces proliferation in cancer cells.
Figure 5. α-casein expression reduces the proliferation of Met-1 cells. (A) The (3H) thymidine incorporation assay displays a decreased proliferative rate of Met-1 cells expressing α-casein (n = 6 per group). *p < 0.05, α-casein vs. vector alone; Student’s t-test. (B) Immunoblot analysis shows decreased cyclin D1 expression in Met-1 cells expressing α-casein. β-tubulin was used as a loading control.
α-Casein behaves as a breast cancer tumor suppressor in the context of primary tumor formation
In order to determine if the presence of α-casein is sufficient to decrease tumor growth, we implanted these Met-1 cell lines in nude athymic mice via flank injection. At 3 wk after injection, breast cancer tumors were harvested and subjected to a detailed weight and volume analyses.
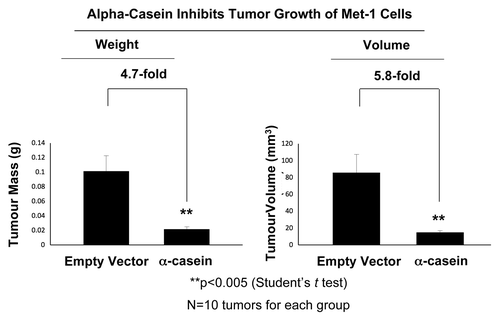
show the results of this analysis. Remarkably, the expression of α-casein leads to dramatic reductions in the tumor mass (4.7-fold) and volume (5.8-fold). Thus, α-casein is sufficient to reduce breast cancer tumor growth in an in vivo setting. These findings strongly suggest that α-casein, in the context of primary tumor formation, behaves as a breast cancer tumor suppressor.
Figure 6. α-casein effectively reduces tumor growth. Met-1 cells were injected into the flanks of athymic nude mice to assay for tumor growth. Tumors were harvested at 3 wk post-injection (n = 10 tumors for each group). (A) α-casein expression promotes a ~4.7-fold reduction in tumor mass, relative to the empty vector control. (B) α-casein induces a 5.8-fold decrease in tumor volume. **p < 0.005, vector alone vs. α-casein; Student’s t-test.
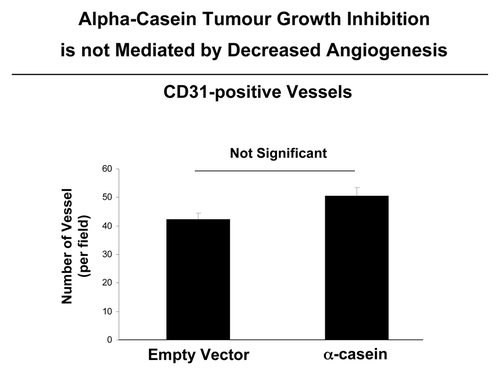
To determine if the observed decrease in tumor growth was associated with reduction of neo-vascularization/angiogenesis, we prepared frozen sections from the collected tumor samples and immunostained them with antibody for CD31, a marker of the micro-vasculature. Results from quantitative analysis of CD31-stained frozen sections from tumors, revealed no differences in vessel density (# of vessels per mm2). Thus, a decrease in tumor angiogenesis is not one of the mechanisms by which the α-casein expression suppresses the tumor growth ().
Figure 7. α-casein suppresses tumor growth, without any decrease in tumor angiogenesis. We evaluated the status of tumor vascularity by employing an antibody directed against CD31. Note that the CD31 immunostaining did not show any significant differences in the number of vessels per field between tumors obtained from Met-1 cells expressing α-casein vs. the empty vector alone. n.s., not significant.
α-Casein reduces experimental metastasis
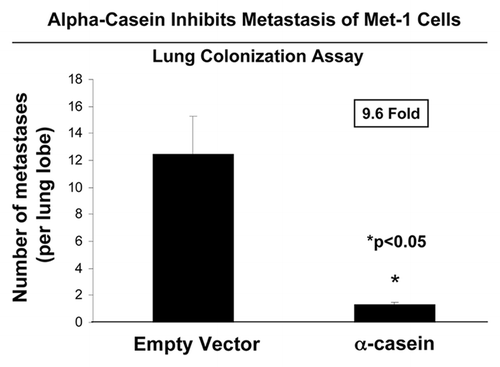
To study the effect of α-casein on cancer cell metastasis in vivo, we injected the Met-1 cell lines (containing the empty vector and α-casein constructs) into the tail vein of athymic nude mice. After 4 wk post-injection, the lungs were collected, and the number of metastases per lung lobe was scored (visualized with India Ink staining). Importantly, expression of α-casein reduced the metastatic capacity of Met-1 cells by approximately 9.6-fold, as compared with vector-alone control cells ().
Figure 8. α-casein prevents mammary tumor cell metastasis. Athymic nude mice were injected with Met-1 cells via the tail vein (n = 15 lung lobes for the control; n = 20 lung lobes for α-casein). At 4 wk post-injection, mice were sacrificed and the lungs were insufflated with India ink. After removal, the lungs were washed and bleached in Fekete’s solution before counting colonies. Note that expression of α-casein significantly reduces experimental metastasis by ~9.6-fold, as compared with empty vector. Number of metastases per lung lobe was scored. *p < 0.05, Mann-Whitney test.
DNA microarray analysis: α-Casein activates STAT1 signaling and decreases “stemness” in mammary tumor cells
To understand the mechanism(s) that underlie the protective effect of α-casein expression against the progression of human breast cancer and lung metastasis, we subjected the Met-1 cell lines DNA microarray analysis.
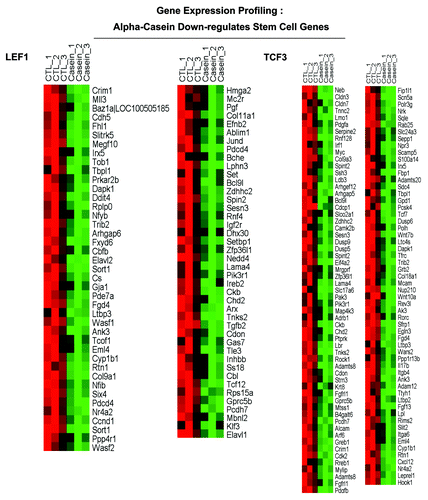
and show the results from pathways analysis. Interestingly, expression of α-casein induced the upregulation and downregulation of genes associated with different signaling pathways (Tables S1–3).
Figure 9A. α-casein transcriptional profiling. Results from pathway analysis with ASSESS. We performed pathway analysis using ASSESS (analysis of sample set enrichment scores). Note that α-casein upregulates gene transcripts associated with inflammatory interferon/STAT1 signaling (A) and decreases gene transcripts associated with “stemness” (B).
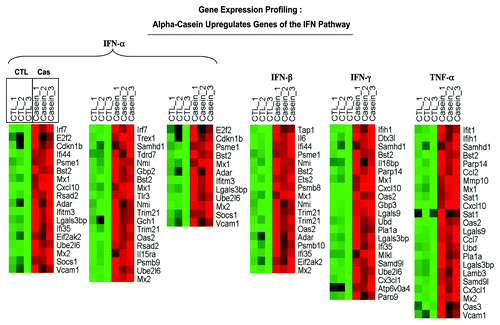
Figure 9B. α-casein transcriptional profiling. Results from pathway analysis with ASSESS. We performed pathway analysis using ASSESS (analysis of sample set enrichment scores). Note that α-casein upregulates gene transcripts associated with inflammatory interferon/STAT1 signaling (A) and decreases gene transcripts associated with “stemness” (B).
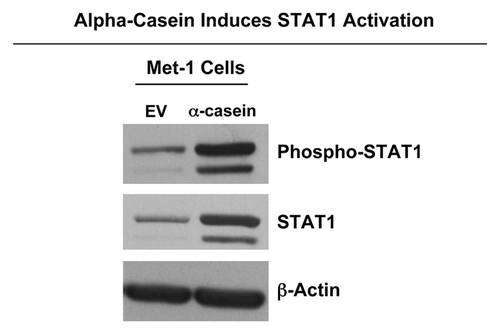
This includes, most prominently, the interferon (IFN-α, -β, -gamma) signaling pathways. In particular, given that IFN-mediated signaling involves the activation of the classical Jak/STAT1 pathway, to validate our result obtained from this transcriptional profiling, we performed immunoblot analysis using an antibody directed against STAT1. In this pathway, JAKs associate with IFN-receptors and, following receptor interaction with IFN, Jak phosphorylates STAT1.Citation11
shows the results of this immunoblot analysis. Interestingly, Met-1 cells expressing α-casein displayed increased activation of STAT1 (phosphorylated at the Tyr701 position) together with a higher expression level of its non-phosphorylated form.
Figure 10. α-casein induces STAT1 activation. Results from DNA microarray analysis suggested that α-casein expression induces the upregulation of the IFN-signaling pathway. Activation of this pathway results in STAT1 phosphorylation. Thus, we performed immunoblot analysis on Met-1 cell lystates. Interestingly, both total STAT1 and phospho-STAT1expression levels were clearly increased by the expression of α-casein.
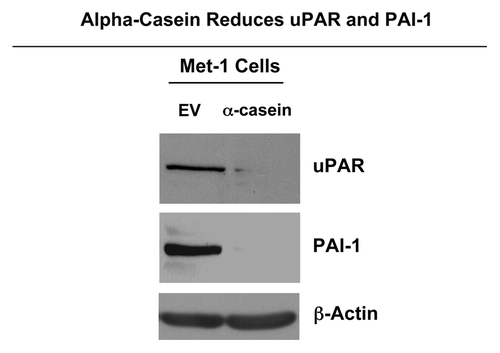
Moreover, DNA microarray analysis also revealed that α-casein expression downregulated genes involved with focal adhesions. Thus, to validate our finding, we evaluated the expression levels of uPAR/PAI-1 that are important in the remodeling of the extracellular matrix during tumor cell invasion. Our results from immunoblot analysis show low or undetectable expression levels of uPAR and PAI-1 proteins after α-casein expression ().
Figure 11. α-casein decreases the expression of uPAR and PAI-1. Lysates were prepared from Met-1 cells recombinantly expressing α-casein or the vector alone control. Then, they were subjected to immunoblot analysis with specific antibody probes. Note that expression of α-casein dramatically reduces the expression of uPAR and PAI-1, as predicted. Immunoblotting with β-actin is shown as a control for equal loading.
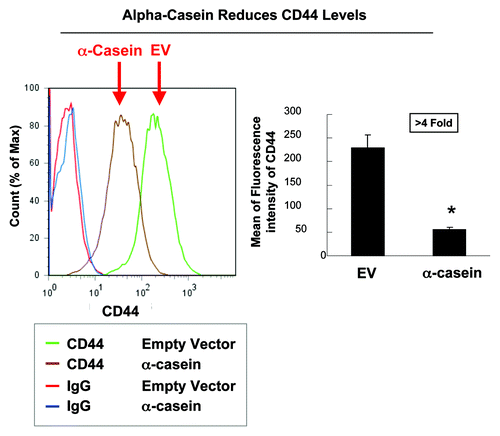
Finally, we found that α-casein expression downregulates genes that are highly expressed in stem/progenitor cells. To provide independent validation of this result obtained from our gene expression profiling study, we conducted FACS analysis. In these experiments, the antibody for the stem cell surface marker CD44 was used. shows the result of this analysis. Importantly, α-casein expression resulted in the reduction of the number of CD44(+) cancer stem cells.
Figure 12. α-casein decreases the number of mammary cancer “stem” cells. (A) We performed FACS analysis on Met-1 cell cultures to investigate the expression of the cell surface stem/progenitor marker CD44. Note that the proportion of CD44(+) cells was lower in Met-1 cells expressing α-casein (brown line) as compared with Met-1 empty vector control cells (green line). (B) Graphic representation of the mean values. *p < 0.01.
Overall, these findings suggest that α-casein expression in mammary epithelial cancer cells may represent a potential therapeutic approach as an antitumor agent in breast cancer.
The α-Casein-associated gene signature predicts clinical outcome in human breast cancer patients
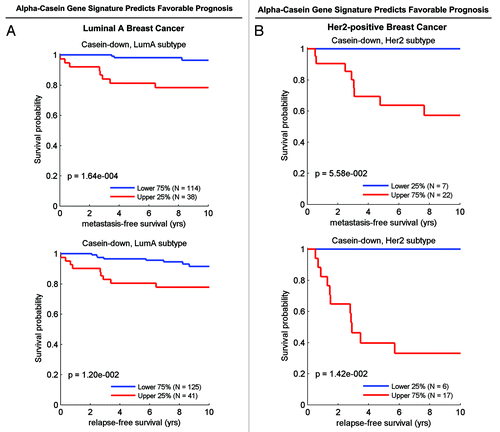
We next explored whether the gene sets upregulated or downregulated by α-casein overexpression have any prognostic value. Interestingly, only the downregulated gene set (related to “stemness”) could predict clinical outcome in human breast cancer patients.
As predicted, reduced expression of the α-casein downregulated gene set (hence, reduced “stemness”) was associated with good clinical outcome (reduced metastasis and recurrence), especially in luminal A and HER2(+) breast cancer patients ().
Figure 13. The α-casein-associated gene signature predicts clinical outcome. Note that reduced expression of the α-casein downregulated gene set (hence, reduced “stemness”) was associated with good clinical outcome (reduced metastasis and recurrence), especially in ER(+)-luminal A (A) and HER2(+) (B) breast cancer patients. Associated p values are as shown.
Casein protein components also decrease human breast cancer cell migration
To rule out the possibility that only mouse mammary tumor cells were affected by casein treatment, we also examined its activity against two human breast cancer cell lines, namely MCF10A-H-Ras (G12V) and MDA-MB-231 cells.
Figures S1–9 directly show that casein family members (α, β and κ) all significantly inhibit the migration of these human cell lines as well, with α-casein being the most effective. Thus, our findings may be applicable to the treatment of human breast cancers.
Discussion
Here, we showed that three casein gene family members can all significantly inhibit the migration of one murine mammary tumor cell line (Met-1 cells) and two human breast cancer cell lines [MCF10A-H-Ras (G12V) and MDA-MB-231 cells], with α-casein being the most effective. Moreover, recombinant expression of α-casein in mammary tumor cells functionally behaved as a strong suppressor of tumor growth and experimental lung metastasis. Mechanistically, α-casein functionally induced interferon-associated STAT1 signaling and reduced the “stemness” of these mammary tumor cells. These results are summarized schematically in .
Figure 14. α-casein behaves as a signaling molecule. Mechanistically, α-casein functionally induced interferon-associated STAT1-signaling and reduced the “stemness” of mammary tumor cells. Thus, α-casein may mediate its tumor suppressor effects by conferring a more “differentiated” mammary cell phenotype. These findings define a previously unrecognized signal transduction pathway and identify α-casein as a signaling molecule.
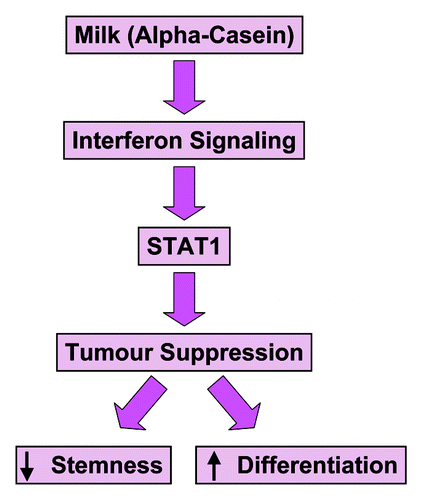
Thus, α-casein may mediate its tumor suppressor effects by conferring a more “differentiated” mammary cell phenotype. These findings define a previously unrecognized signal transduction pathway and identify α-casein as a signaling molecule. Remarkably, α-, β- and κ-casein have roughly the same number of amino acids as the interferons (α, β and γ), suggesting that the caseins may also function as cytokines and be part of the same molecular signaling cascade.
Interestingly, it is already known that the interferons, TNF-α and STAT1 signaling can functionally suppress tumor growth.Citation12-Citation14 However, it remained unknown that α-casein was upstream of the STAT1 signaling cascade. For example, increased activation of STAT1 (via its phosphorylation) is associated with a good prognosis in human breast cancer patients,Citation15 with reduced relapse (HR = 3.77) and greater overall survival (HR = 6.55). Similarly, three mouse animal models of human breast cancer have already shown that STAT1 has tumor-suppressor propertiesCitation16-Citation18 related to both HER2-induced and ER(+) mammary tumors. This is consistent with our findings examining the α-casein gene signature and clinical outcome in ER(+) luminal A patients and HER2(+) patients (Fig. 13).
Thus, the administration of α-casein (either locally or systemically) may now provide a more natural (and likely non-toxic) approach to effectively activate STAT1 signaling, acting as a form of targeted “differentiation” therapy.
Our findings may also explain the lethality of pregnancy-associated breast cancers. We speculate that this type of breast cancer may be due to mutations within the casein genes, which we now show function as tumor suppressors. Naturally occurring casein mutations in animals are associated with a cessation of milk production and lactation, especially mutations in the α-casein gene.Citation19,Citation20
Materials and Methods
Materials
Antibodies and their sources were as follows: β-actin and β-tubulin monoclonal antibodies were from Sigma. uPAR (FL-290) and PAI-1 (H-135) were rabbit polyclonal IgG from Santa Cruz Biotechnology. Human α-casein antibody F20.14 was from Abcam (ab47972). Total STAT1 rabbit antibody was from Cell Signaling and mouse anti-STAT1 (pY701) was from BD Transduction. CD31 was from BD Biosciences (Cat. #550274). α- (Cat. #C6780), β- (Cat. #C6905) and κ-caseins (Cat. #C0406) from bovine milk were from Sigma. Commercial source of breast milk from human donors was Lee Biosolutions, Inc. Migration assays were performed using modified non-coated Boyden chambers (cat#354578) (Transwells; BD Biosciences). The Streptavidin-HRP kit was from Dako.
Vector pReceiver-Lv122 with eGFP containing the cDNA of human casein α s1 (EX-S0252-Lv122) and the control eGFP vector (EX-EGFP-Lv105) were from Genecopoeia. Lenti-Pac HIV Expression Packaging Kit for production of recombinant lentivirus was from Genecopoeia (#HPK-LvTR-20). Vector pCMV6-AC-GFP containing human cDNA of GFP tagged-casein α s1 (RG220806) and the empty vector pCMV6-AC-GFP (PS100010) were from Origene.
Cell lines
Met-1 cells were grown in Dulbecco’s modified Eagle’s medium (DMEM) containing 10% fetal bovine serum, 2 mmol/L glutamine, 100 U/ml penicillin and 100 μg/ml streptomycin at 37°C in a 5% CO2 incubator. Met-1 cells were the generous gift of Dr. Robert D. Cardiff (University of California-Davis).
FACS-sorted GFP-positive cells
Stably transfected Met-1 cells were obtained after transfection with eGFP-positive empty control plasmid and human α-casein s1 (GFP tagged) expression construct, purchased from Origene. Cells were selected for stable transformation in the presence of the neomycin analog G-418 (1 mg/ml, Sigma, Cat. # G8168) for 10 d. Offspring of the transfected cells had resistance to the drug and survived in higher numbers. To assure purity, the drug was applied several times. Next, we FACS-sorted the GFP-positive cells. Efficiency of α-casein transfection was determined by immunoblot analysis.
Lentiviral infection
Met-1 stable cell lines were also produced by lentiviral infection. Control empty vector plasmid and human α-casein s1 expression construct, both eGFP-positive, were obtained from Genecopoeia. Lentiviral empty vector and ORF expression vector (with human α casein s1) were transfected into Genecopoeia GCI-L3 chemically competent E. coli cells by Fugene HD transfection reagent (Roche) following the manufacturer's manual. Two days after transfection, cell culture supernatants were collected and centrifuged. Supernatant containing lentiviral particles were used to infect Met-1 target cells. After lentiviral transduction, target Met-1 cells were selected for 10–14 d in 2.5 μg/ml of puromycin. Efficiency of α-casein transfection was determined by immunoblot analysis.
Cell migration assay
The effects of human breast milk and α-, β- and κ-caseins on the migratory potential of Met-1 cells was evaluated in vitro using a modified Boyden chamber assay. Briefly, 2.5 × 10⁴ cells in 0.5 ml of serum-free DMEM with 0.1% BSA were added to the wells of 8-μm pore, non-coated membrane modified Boyden chambers (Transwells; BD Biosciences). The lower chambers contained 10% fetal bovine serum in DMEM to serve as a chemo-attractant. Cells were incubated at 37°C and allowed to migrate throughout the course of 6 h. Noninvasive cells were removed from the upper surface of the membrane by scrubbing with cotton swabs. Chambers were stained in 0.5% crystal violet diluted in 100% methanol for 30–60 min, rinsed in water and examined under a bright-field microscope. Values for invasion and migration were obtained by counting five fields per membrane (20× objective) and represent the average of three independent experiments performed throughout multiple days. Human breast milk and caseins were placed in both lower and upper chambers.
Immunoblot analysis
Met-1 cells were lysed in 800 μl of lysis buffer (10 mmol/L Tris, pH 7.5, 150 mmol/L NaCl, 1% Triton X-100, 60 mmol/L octyl glucoside) containing protease (Roche Applied Science) and phosphatase inhibitors (Sigma). Cell lysates were then centrifuged at 12,000 × g for 10 min to remove insoluble debris. Protein concentrations were analyzed using the BCA reagent (Pierce) and the volume required for 40 μg of protein was determined. Cell lysates were separated by sodium dodecyl sulfate-PAGE (10% acrylamide) and transferred to nitrocellulose. The nitrocellulose membranes were stained with Ponceau S (to visualize protein bands), followed by immunoblot analysis. Subsequent wash buffers contained 10 mmol/L Tris, pH 8.0, 150 mmol/L NaCl, 0.05% Tween-20 (TBS-Tween), which was supplemented with 1% bovine serum albumin (BSA) and 4% nonfat dry milk (Carnation) for the blocking solution and 1% BSA for the antibody diluent. Horseradish peroxidase-conjugated secondary antibodies [anti-mouse, 1:6,000 dilution (Pierce) or anti-rabbit 1:5,000 (BD PharMingen)] were used to visualize bound primary antibodies, with the Supersignal chemiluminescence substrate (Pierce).
Annexin-V apoptosis detection
Apoptosis was quantified by flow cytometry using the Annexin-V-APC apoptosis detection kit (BD Pharmigen). Briefly, Met-1 cells stably infected with control empty vector and human α-casein s1 lentiviral plasmids (both eGFP positive) were plated in 12-well plates with DMEM containing 10% FBS serum. After 24 and 48 h of hypoxia stimulus, cells and media were collected by centrifugation and re-suspended in 500 µl of Annexin-V-binding buffer with annexin V-APC conjugate and propidium iodide. Cells were then incubated in the dark for 5 min and analyzed by flow cytometry using a PE Texas Red signal detector (for propidium iodide) and an APC signal detector (for Annexin V).
(3H) Thymidine incorporation assay
DNA synthesis was determined by incubating asynchronously growing cells (2 × 10³/cm2) with 0.5 µCi/ml of (3H) thymidine.Citation21 After 18 h, cells were incubated with 10% trichloroacetic acid (TCA) at 4°C for 30 min to precipitate high molecular weight DNA. After washing twice in cold PBS, cells were solubilized in 0.5 N NaOH/0.05% SDS and the amount of radioactivity determined by liquid scintillation counting. Protein content in samples was determined with the BCA reagent (Pierce). Results were reported as cpm/µg protein.
Animal studies
All animals were housed and maintained in a barrier facility at the Kimmel Cancer Center at Thomas Jefferson University. All mice used in this study were athymic nude mice. Animal protocols used for this study were pre-approved by the Institutional Animal Care and Use Committee.
Primary tumor formation
One × 106 Met-1 cells were re-suspended in 100 μl of PBS and injected into the flank of 6–8 wk of age athymic NCr nude mice. Met-1 cells transfected with empty vector were used as controls. After 3 wk, mice were sacrificed and the tumors were carefully removed to determine their weight and size using calipers. The formula (X2Y)/2, where X is the width and Y is the length, was used in order to estimate tumor volume.
CD31 quantification
To quantify tumor angiogenesis, staining with CD31 antibody was performed on frozen tumor sections. For the detection, a three-step biotin-streptavidinhorseradish peroxidase method was employed. Frozen tissue sections (6 μm) were air dried and fixed in cold 4% paraformaldehyde (PFA) at 4°C for 10 min. After blocking with 10% rabbit serum, the sections were incubated overnight at 4°C with rat anti-mouse CD31 antibody at a dilution of 1:200, followed by biotinylated rabbit anti-rat IgG (1:200) antibody and streptavidin-HRP. Immunoreactivity was revealed with 3,3′diaminobenzidine (DAB). For quantification of CD31-positive vessels, the total number of vessels was measured in at least five random fields of at least four tumors for each group.
Experimental metastasis (lung colonization assay)
To study cell invasive capacity in vivo, 5 × 10⁵ Met-1 cells were suspended in 0.1 ml of PBS and injected through the tail vein of five nude mice for each cell line (empty vector and α-casein). After 4 wk, the lungs were removed and insufflated with 2 ml of 15% India Ink, washed in water for 5 min and bleached in Fekete’s solution (70% ethanol, 3.7% paraformaldehyde, 0.75 mol/L glacial acetic acid).Citation7 Surface lung colonies were counted in a blinded manner under low power using a Nikon SMZ-1500 stereomicroscope. P values were determined by applying the Mann-Whitney statistical analysis parameters, which does not assume a Gaussian distribution (nonparametric test).
Gene expression profiling
Total RNA (5 μg) was reverse transcribed using the Superscript III first-strand synthesis system (Invitrogen) using a HPLC purified T7-dT24 primer (Sigma Genosys), which contains the T7 polymerase promoter sequence. The single-stranded cDNA was converted to double-stranded cDNA using DNA polymerase I (Promega) and purified by cDNA spin column purification using GeneChip Sample Cleanup Module (Affymetrix). The double-stranded cDNA was used as a template to generate biotinylated cRNA using the Bioarray high-yield RNA transcription labeling kit (Enzo) and the labeled cRNA purified by GeneChip Sample Cleanup Module (Affymetrix). Fifteen μg of cRNA was fractionated to produce fragments of between 35–200 bp using 5× fragmentation buffer provided in the Cleanup Module. The sample was hybridized to mouse 430 2.0 microarray (Affymetrix) representing more than 39,000 transcripts. The hybridization and washing steps were performed in accordance with Affymetrix protocols for eukaryotic arrays. The arrays were scanned at 570 nm with a confocal scanner from Affymetrix. Analysis of the arrays was performed using the R statistics package and the limma library of the Bioconductor software package. Arrays were normalized using robust multiarray analysis (RMA), and p value of 0.05 was applied as criteria for statistically differentially expressed genes. GO tree analysis of gene function was analyzed by Webgestalt (Vanderbilt University).
Outcome analysis (recurrence- and metastasis-free survival) in human breast cancer patients was performed, essentially as previously described.Citation22
Pathway analysis
Global pathway analysis of our gene expression profiling studies was performed using ASSESS (analysis of sample set enrichment scores), a computer-based gene set enrichment algorithm.Citation23
FACS analysis to identify Met-1 cancer stem cells
To identify the subset of Met-1 cells expressing CD44 stem cell surface marker, we performed cell labeling and FACS analysis on Met-1/empty vector and Met-1/α-casein cells, as previously reported.Citation24,Citation25 Briefly, before labeling, the cells were blocked with normal IgG in 1/100 dilution for 30 min and then incubated with PE/Cy5-labeled rat anti-human/mouse CD44 (1/200) (clone IM7, BioLegend) for 1 h. All experiments were performed at 4°C. Cell sorting was performed using FACS Calibur cell sorter (BD Bioscience). The data were analyzed with FlowJo software (Tree Star, Inc.).
Statistical analysis
Statistical significance was examined using the Student's t-test. Values of p < 0.05 were considered significant. Values were expressed as means +/− SEM.
Additional material
Download Zip (806.3 KB)Acknowledgments
F.S. was the recipient of a Young Investigator Award from the Breast Cancer Alliance. U.E.M. was supported by a Young Investigator Award from the Margaret Q. Landenberger Research Foundation. Funds were also contributed by the Margaret Q. Landenberger Research Foundation (to M.P.L.). We are greatly indebted to Dr. Chenguang Wang his help with performing genome-wide transcriptional profiling and Dr. Adam Ertel for his expert assistance in determining whether the casein-associated gene sets predict clinical outcome in human breast cancer patient populations. This project was funded, in part, under a grant with the Pennsylvania Department of Health (to M.P.L. and F.S.).The Department specifically disclaims responsibility for any analyses, interpretations or conclusions.
Disclosure of Potential Conflicts of Interest
No potential conflicts of interest were disclosed.
References
- Henderson BE, Powell D, Rosario I, Keys C, Hanisch R, Young M, et al. An epidemiologic study of breast cancer. J Natl Cancer Inst 1974; 53:609 - 14; PMID: 4369771
- Kelsey JL, Gammon MD. The epidemiology of breast cancer. CA Cancer J Clin 1991; 41:146 - 65; http://dx.doi.org/10.3322/canjclin.41.3.146; PMID: 1902137
- Britt K, Ashworth A, Smalley M. Pregnancy and the risk of breast cancer. Endocr Relat Cancer 2007; 14:907 - 33; http://dx.doi.org/10.1677/ERC-07-0137; PMID: 18045947
- Innes KE, Byers TE. First pregnancy characteristics and subsequent breast cancer risk among young women. Int J Cancer 2004; 112:306 - 11; http://dx.doi.org/10.1002/ijc.20402; PMID: 15352044
- Kelsey JL, Gammon MD, John EM. Reproductive factors and breast cancer. Epidemiol Rev 1993; 15:36 - 47; PMID: 8405211
- Trichopoulos D, Hsieh CC, MacMahon B, Lin TM, Lowe CR, Mirra AP, et al. Age at any birth and breast cancer risk. Int J Cancer 1983; 31:701 - 4; http://dx.doi.org/10.1002/ijc.2910310604; PMID: 6862681
- Sotgia F, Casimiro MC, Bonuccelli G, Liu M, Whitaker-Menezes D, Er O, et al. Loss of caveolin-3 induces a lactogenic microenvironment that is protective against mammary tumor formation. Am J Pathol 2009; 174:613 - 29; http://dx.doi.org/10.2353/ajpath.2009.080653; PMID: 19164602
- Bonuccelli G, Casimiro MC, Sotgia F, Wang C, Liu M, Katiyar S, et al. Caveolin-1 (P132L), a common breast cancer mutation, confers mammary cell invasiveness and defines a novel stem cell/metastasis-associated gene signature. Am J Pathol 2009; 174:1650 - 62; http://dx.doi.org/10.2353/ajpath.2009.080648; PMID: 19395651
- Borowsky AD, Namba R, Young LJ, Hunter KW, Hodgson JG, Tepper CG, et al. Syngeneic mouse mammary carcinoma cell lines: two closely related cell lines with divergent metastatic behavior. Clin Exp Metastasis 2005; 22:47 - 59; http://dx.doi.org/10.1007/s10585-005-2908-5; PMID: 16132578
- Namba R, Young LJ, Abbey CK, Kim L, Damonte P, Borowsky AD, et al. Rapamycin inhibits growth of premalignant and malignant mammary lesions in a mouse model of ductal carcinoma in situ. Clin Cancer Res 2006; 12:2613 - 21; http://dx.doi.org/10.1158/1078-0432.CCR-05-2170; PMID: 16638874
- Kaplan DH, Shankaran V, Dighe AS, Stockert E, Aguet M, Old LJ, et al. Demonstration of an interferon gamma-dependent tumor surveillance system in immunocompetent mice. Proc Natl Acad Sci USA 1998; 95:7556 - 61; http://dx.doi.org/10.1073/pnas.95.13.7556; PMID: 9636188
- Minutilli E, Feliciani C. Adjuvant therapy for resected stage III melanoma patients: high-dose interferon-alpha versus ipilimumab combined with kinases inhibitors. Tumori 2012; 98:185 - 90; PMID: 22677983
- Simonsson B, Gedde-Dahl T, Markevärn B, Remes K, Stentoft J, Almqvist A, et al, Nordic CML Study Group. Combination of pegylated IFN-α2b with imatinib increases molecular response rates in patients with low- or intermediate-risk chronic myeloid leukemia. Blood 2011; 118:3228 - 35; http://dx.doi.org/10.1182/blood-2011-02-336685; PMID: 21685374
- Roberts NJ, Zhou S, Diaz LA Jr., Holdhoff M. Systemic use of tumor necrosis factor alpha as an anticancer agent. Oncotarget 2011; 2:739 - 51; PMID: 22036896
- Widschwendter A, Tonko-Geymayer S, Welte T, Daxenbichler G, Marth C, Doppler W. Prognostic significance of signal transducer and activator of transcription 1 activation in breast cancer. Clin Cancer Res 2002; 8:3065 - 74; PMID: 12374673
- Klover PJ, Muller WJ, Robinson GW, Pfeiffer RM, Yamaji D, Hennighausen L. Loss of STAT1 from mouse mammary epithelium results in an increased Neu-induced tumor burden. Neoplasia 2010; 12:899 - 905; PMID: 21076615
- Raven JF, Williams V, Wang S, Tremblay ML, Muller WJ, Durbin JE, et al. Stat1 is a suppressor of ErbB2/Neu-mediated cellular transformation and mouse mammary gland tumor formation. Cell Cycle 2011; 10:794 - 804; http://dx.doi.org/10.4161/cc.10.5.14956; PMID: 21311224
- Chan SR, Vermi W, Luo J, Lucini L, Rickert C, Fowler AM, et al. STAT1-deficient mice spontaneously develop estrogen receptor α-positive luminal mammary carcinomas. Breast Cancer Res 2012; 14:R16; http://dx.doi.org/10.1186/bcr3100; PMID: 22264274
- Prinzenberg EM, Weimann C, Brandt H, Bennewitz J, Kalm E, Schwerin M, et al. Polymorphism of the bovine CSN1S1 promoter: linkage mapping, intragenic haplotypes, and effects on milk production traits. J Dairy Sci 2003; 86:2696 - 705; http://dx.doi.org/10.3168/jds.S0022-0302(03)73865-X; PMID: 12939094
- Ramunno L, Longobardi E, Pappalardo M, Rando A, Di Gregorio P, Cosenza G, et al. An allele associated with a non-detectable amount of alpha s2 casein in goat milk. Anim Genet 2001; 32:19 - 26; http://dx.doi.org/10.1046/j.1365-2052.2001.00710.x; PMID: 11419340
- Trimmer C, Whitaker-Menezes D, Bonuccelli G, Milliman JN, Daumer KM, Aplin AE, et al. CAV1 inhibits metastatic potential in melanomas through suppression of the integrin/Src/FAK signaling pathway. Cancer Res 2010; 70:7489 - 99; http://dx.doi.org/10.1158/0008-5472.CAN-10-0900; PMID: 20709760
- Ertel A, Tsirigos A, Whitaker-Menezes D, Birbe RC, Pavlides S, Martinez-Outschoorn UE, et al. Is cancer a metabolic rebellion against host aging? In the quest for immortality, tumor cells try to save themselves by boosting mitochondrial metabolism. Cell Cycle 2012; 11:253 - 63; http://dx.doi.org/10.4161/cc.11.2.19006; PMID: 22234241
- Edelman E, Porrello A, Guinney J, Balakumaran B, Bild A, Febbo PG, et al. Analysis of sample set enrichment scores: assaying the enrichment of sets of genes for individual samples in genome-wide expression profiles. Bioinformatics 2006; 22:e108 - 16; http://dx.doi.org/10.1093/bioinformatics/btl231; PMID: 16873460
- Al-Hajj M, Wicha MS, Benito-Hernandez A, Morrison SJ, Clarke MF. Prospective identification of tumorigenic breast cancer cells. Proc Natl Acad Sci USA 2003; 100:3983 - 8; http://dx.doi.org/10.1073/pnas.0530291100; PMID: 12629218
- Jiao X, Katiyar S, Willmarth NE, Liu M, Ma X, Flomenberg N, et al. c-Jun induces mammary epithelial cellular invasion and breast cancer stem cell expansion. J Biol Chem 2010; 285:8218 - 26; http://dx.doi.org/10.1074/jbc.M110.100792; PMID: 20053993