Abstract
Histone deacetylases (HDACs) are important determinants of gene transcription and other biological processes. HDAC11 is one of the least characterized HDACs and is the only member of the class IV HDAC family. Our studies examined the events that control the expression of the HDAC11 transcript. We show that platelet-derived growth factor (PDGF) rapidly reduces the abundance of HDAC11 mRNA when added to density-arrested Balb/c-3T3 cells, which are nontransformed fibroblasts. Reduction required mRNA and protein synthesis, but not AKT or ERK activity, and resulted from accelerated turnover of the HDAC11 transcript. Reduction was transient in cells receiving PDGF alone but sustained in cells receiving both PDGF and platelet-poor plasma, which together promote G0/G1 traverse and S phase entry. Plasma alone did not appreciably reduce HDAC11 mRNA abundance, nor did epidermal growth factor, insulin-like growth factor, or insulin. HDAC11 mRNA accumulated in Balb/c-3T3 cells exiting the cell cycle due to density-dependent growth inhibition or serum deprivation. Of note, HDAC11 mRNA did not accumulate in a spontaneously transformed Balb/c-3T3 clonal variant (clone 2) that does not density arrest. The HDAC11 promoter was active in Balb/c-3T3 but not clone 2 cells; inactivity in clone 2 cells did not result from methylation of CpG islands. Overexpression of HDAC11 inhibited the cell cycle progression of both transformed and nontransformed fibroblasts. Our studies identify the HDAC11 transcript as a PDGF target and show that HDAC11 mRNA abundance correlates inversely with proliferative status.
Introduction
Histone deacetylases (HDACs) remove acetyl moieties from conserved lysine residues of proteins, most notably histones.Citation1 Deacetylation of histones results in chromatin condensation and reduced access of transcription factors and other proteins to DNA. Non-histone substrates of HDACs include cytoskeletal components, molecular chaperones, DNA repair enzymes, and transcription factors.Citation2-Citation4 HDACs typically repress but can enhance transcription.
HDACs are grouped according to sequence homology: class I (HDACs 1, 2, 3, 8), class II (HDACs 4, 5, 6, 7, 9, 10), and class III (the sirtuins).Citation1 HDAC11 is the lone member of class IV and has not been extensively studied. Identified in 2002, HDAC11 has a molecular mass of 39 kd, and in contrast to its ubiquitous relatives, is tissue-specific: it is expressed primarily in brain, heart, kidney, and skeletal muscle.Citation5 It is overexpressed in breast, colon, and other carcinoma cell lines, and its depletion induces apoptosis of tumor but not normal cells.Citation6 Gene targets of HDAC11 include interleukin-10, the OX40 ligand, the ARH1 tumor suppressor, myelin basic protein, and proteolipid protein.Citation7-Citation11 Postulated HDAC11-dependent processes include immunosuppression in Hodgkin lymphoma cells and postnatal development of neurons and oligodendrocytes.Citation9,Citation11,Citation12 HDAC11 has also been implicated in stroke pathogenesisCitation13 and in DNA replication, where it interacts with and destabilizes the replication licensing factor Cdt1.Citation14
The studies reported here examined the effects of mitogens and proliferative status on HDAC11 mRNA expression in Balb/c-3T3 cells, which are nontransformed mouse fibroblasts. We show that platelet-derived growth factor (PDGF) reduces the abundance of HDAC11 mRNA when added to density-arrested cells. PDGF is a potent mitogen for mesenchymal cells; it renders quiescent fibroblasts responsive to growth factors contained in platelet-poor plasma (PPP).Citation15 We also show accumulation of HDAC11 mRNA in cells exiting the cell cycle as a result of contact inhibition or serum deprivation. Interestingly, HDAC11 mRNA abundance did not increase in a spontaneously transformed Balb/c-3T3 variant (termed clone 2) that continues to proliferate at high density.Citation16 Lastly, we show that overexpression of HDAC11 inhibits the cell cycle progression of both Balb/c-3T3 and clone 2 cells.
Results
PDGF reduces amounts of HDAC11 mRNA in density-arrested Balb/c-3T3 cells
We performed a microarray analysis to identify mRNAs whose expression changes in response to mitogens. Density-arrested Balb/c-3T3 cells received fresh medium containing PDGF and 10% PPP for 1, 3, or 7 h. A transcript that was substantially altered in abundance was HDAC11: amounts of HDAC11 mRNA fell modestly within 1 h of treatment and more than 70% within 3 h ().
Figure 1. PDGF reduces HDAC11 mRNA abundance in Balb/c-3T3 cells. (A) Density-arrested Balb/c-3T3 cells received 10 ng/ml PDGF and 10% PPP for 1, 3, or 7 h. A microarray analysis was performed as described in “Materials and Methods”. (B) Density-arrested Balb/c-3T3 cells were co-treated with 10 ng/ml PDGF and 10% PPP for the indicated times. Amounts of HDAC11 mRNA were determined by RT-qPCR. Data are expressed as percentage of control (no treatment, diagonal bar). Error bars show standard deviation. (C) Density-arrested Balb/c-3T3 cells received 10 ng/ml PDGF (left panel) or 10% PPP (right panel) for the indicated times. Amounts of HDAC11 mRNA were determined by RT-qPCR. Data are expressed as percentage of control (no treatment, diagonal bar). Error bars show standard deviation.
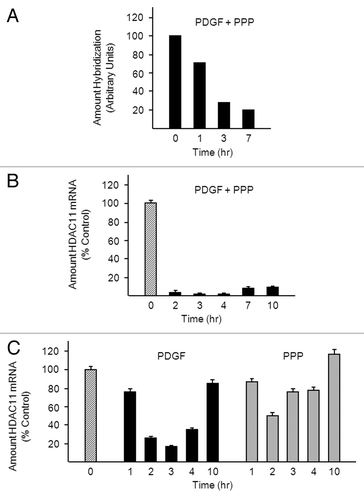
This finding was confirmed by quantitative real-time PCR (RT-qPCR). The PCR data show a pronounced decline in HDAC11 mRNA abundance within 2 h of addition of PDGF plus PPP to density-arrested Balb/c-3T3 cells (). They also show that loss of HDAC11 mRNA is sustained for at least 10 h. PDGF alone reduced amounts of HDAC11 mRNA as effectively as did PDGF plus PPP (83% decrease at 3 h) (). However, this decrease was short-lived: amounts of HDAC11 mRNA began to rise after 3 h and were almost completely restored by 10 h. PPP did not appreciably affect HDAC11 mRNA abundance with the exception of the 3 h time point, where a small reduction was observed; this may reflect PDGF contamination of PPP. Balb/c-3T3 cells do not traverse G0/G1 in response to PDGF alone or PPP alone: both are required.Citation15 Thus, our data suggest that prolonged repression of HDAC11 mRNA requires cell cycle progression, whereas induction of repression does not.
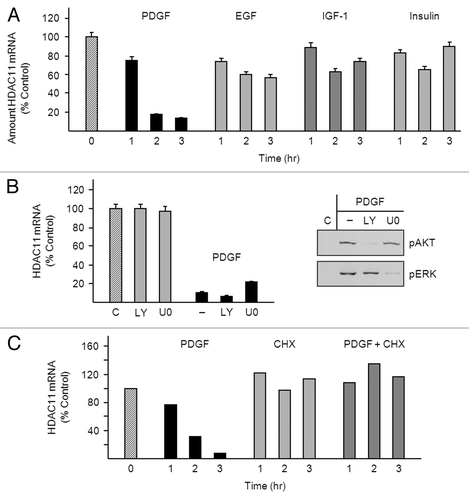
Epidermal growth factor (EGF), insulin-like growth factor (IGF-1), and insulin, all of which are plasma-derived factors, did not appreciably reduce HDAC11 mRNA abundance when applied to density-arrested Balb/c-3T3 cells (). Signaling pathways activated by PDGF include phosphatidylinositol 3-kinase/AKT and MEK/ERK.Citation17 PDGF reduced HDAC11 mRNA abundance in cells co-treated with LY294002 or U0126 (inhibitors of phosphatidylinositol 3-kinase and MEK, respectively) and thus does so independently of these pathways (, bar graph). The inhibitors prevented phosphorylation and consequent activation of their targets and thus were effective (, western blots). PDGF-mediated downregulation of HDAC11 mRNA did, however, require protein synthesis: amounts of HDAC11 mRNA were similar in untreated cells and in cells co-treated with PDGF and cycloheximide (). We have not been able to detect endogenous HDAC11 protein in Balb/c-3T3 cells, perhaps because of low abundance (see “Discussion”).
Figure 2. PDGF-mediated downregulation of HDAC11 mRNA requires protein synthesis. (A) Density-arrested Balb/c-3T3 cells received 10 ng/ml PDGF, 50 ng/ml EGF, 40 ng/ml IGF-1, or 5 μg/ml insulin for 1, 2, or 3 h. Amounts of HDAC11 mRNA were determined by RT-qPCR. Data are expressed as percentage of control (no treatment, diagonal bar). Error bars show standard deviation. (B) Density-arrested Balb/c-3T3 cells received 1 μM LY294002 or 10 μM U0126 for 25 min followed by 10 ng/ml PDGF for 2.5 h. Left panel: Amounts of HDAC11 mRNA were determined by RT-qPCR. Data are expressed as percentage of control (no treatment, diagonal bar). Error bars show standard deviation. Right panel: Amounts of phosphophorylated AKT (pAKT) and phosphorylated ERK (pERK) were determined by western blotting of cell extracts with phospho-specific antibodies. (C) Density-arrested Balb/c-3T3 cells received 10 ng/ml PDGF, 20 µg/ml cycloheximide (CHX), or both for 0.5, 1 or, 2 h. Amounts of HDAC11 mRNA were determined by RT-qPCR. Data are expressed as percentage of control (no treatment, diagonal bar).
PDGF reduces the stability of HDAC11 mRNA
Accelerated turnover of the HDAC11 transcript may account for the sharp decline in HDAC11 mRNA abundance in PDGF-treated cells. To test this, we generated decay curves: density-arrested Balb/c-3T3 cells received the RNA polymerase II inhibitor DRB (5,6-dichlorobenzimidazole) with or without PDGF, and amounts of HDAC11 mRNA were determined at various times thereafter. Rates of HDAC11 mRNA decay were similar in both conditions: half-lives were 9.4 h and 9.1 h for DRB and PDGF plus DRB, respectively (). This finding indicates that PDGF does not reduce the stability of the HDAC11 transcript, or requires transcription to do so. If the latter is correct, amounts of HDAC11 mRNA should fall more rapidly in cells receiving PDGF in the absence than in the presence of DRB, and this was indeed the case: HDAC11 mRNA had a half-life of only 2.4 h in cells receiving PDGF alone. Transcriptional repression cannot account for the more rapid decline: PDGF cannot shut off transcription to a greater extent than does DRB, which is approximately 100% effective at the concentration used.
Figure 3. PDGF destabilizes the HDAC11 transcript in a transcription-dependent manner. (A) Density-arrested Balb/c-3T3 cells received 10 ng/ml PDGF, 50 μM DRB or both for the indicated times. Amounts of HDAC11 mRNA were determined by RT-qPCR. Decay curves were generated by linear regression. (B) Growing Balb/c-3T3 cells (approximately 80% confluent) were co-transfected with pRL-CMV and either pGL3-Basic or pGL3-HDAC11. Cells received 10 ng/ml PDGF 38 h after transfection (0 h) and were harvested at 3, 6, or 9 h thereafter for determination of luciferase activity. Cells were quiescent and confluent at the time of PDGF addition. Firefly luciferase activity (pGL3) is normalized to Renilla luciferase activity (pRL-CMV) (RLU1/RLU2). Error bars show standard deviation.
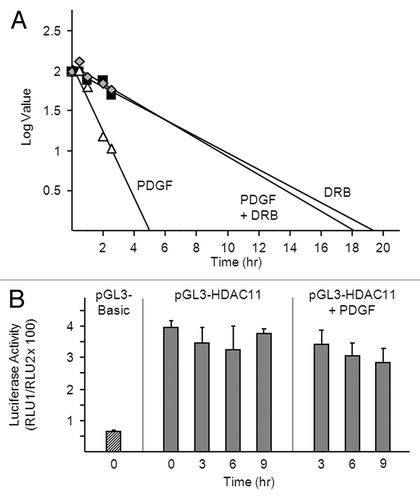
Nor did PDGF inhibit HDAC11 gene transcription as determined by use of a reporter gene (firefly luciferase) driven by the HDAC11 promoter. In these experiments, quiescent, confluent Balb/c-3T3 cells expressing pGL3-Basic (no insert) or pGL3-HDAC11 (pGL3-Basic containing the HDAC11 promoter inserted upstream of the luciferase coding region) received PDGF for 3, 6, or 9 h. Luciferase activity was 5-fold greater in cells expressing pGL3-HDAC11 than in cells expressing pGL3-Basic and was not affected by PDGF (). Collectively, the data in indicate that PDGF downregulates the HDAC11 transcript by reducing its stability in a transcription-dependent manner.
HDAC11 mRNA accumulates in confluent Balb/c-3T3 but not clone 2 cells
We monitored HDAC11 mRNA expression during the growth cycle of Balb/c-3T3 cells and of a spontaneously transformed Balb/c-3T3 variant termed clone 2.Citation16 Amounts of HDAC11 mRNA in Balb/c-3T3 cells paralleled cell density: they were lowest in sparse, proliferating cells (day 2) and increased as cells approached confluency and accumulated in G0/G1 (days 3 and 4) (). They continued to increase in confluent cultures (days 5, 6, 7). This pattern suggests that density-dependent growth inhibition promotes HDAC11 mRNA accumulation in Balb/c-3T3 cells.
Figure 4. Accumulation of HDAC11 mRNA in confluent Balb/c-3T3 but not clone 2 cells (A) Amounts of HDAC11 mRNA were determined by RT-qPCR on the days indicated (top panel). Percentages of cells in G0/G1, S, and G2/M were determined by FACS analysis of propidium iodide-stained cells (bottom panel). Error bars show standard deviation. (B) Cultures were photographed on the days indicated. Magnification is 10×. (C) Sparse (day 2) and confluent (day 7) Balb/c-3T3 cells received 10 ng/ml PDGF for 3 h. Amounts of HDAC11 mRNA were determined. Error bars show standard deviation.
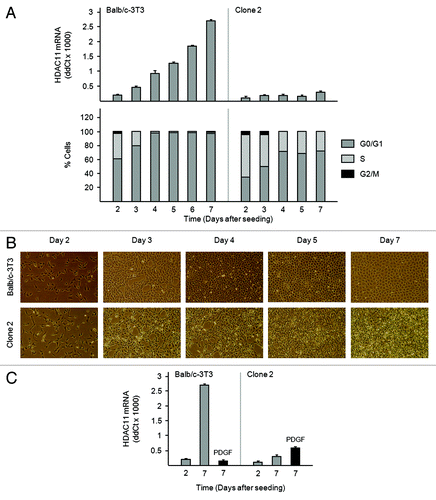
Interestingly, HDAC11 mRNA abundance did not change in clone 2 cells: at all time points, it was comparable to that of Balb/c-3T3 cells on day 2 (, top panel). Clone 2 cells continue to proliferate when confluent, whereas Balb/c-3T3 cells do not (, bottom panel, and ).Citation16 Seven days after refeeding, clone 2 cultures were much more dense than were Balb/c-3T3 cultures; also striking is the multi-layer vs. monolayer appearance of clone 2 and Balb/c-3T3 cultures, respectively (). Thus, it is possible that escape from density-dependent growth inhibition prevents the build-up of HDAC11 mRNA in clone 2 cells. Clone 2 cells do not require PDGF for growth,Citation16 and PDGF did not reduce amounts of HDAC11 mRNA when added to clone 2 cells on day 7 for 2.5 h ().
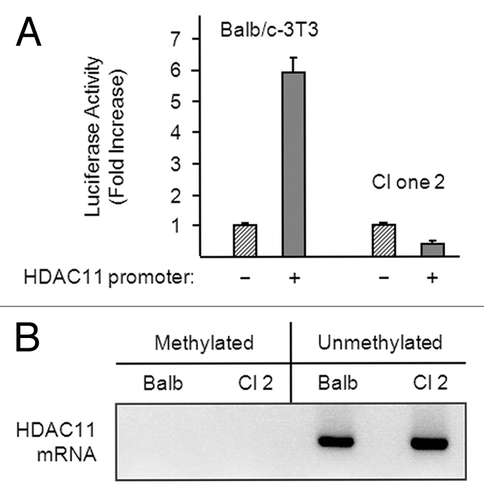
The HDAC11 promoter was not active in confluent clone 2 cells (i.e., pGL3-HDAC11 activity was not greater than pGL3-basic activity) (). In contrast, and similar to the data in , pGL3-HDAC11 was approximately 6 times more active than was pGL3-Basic in confluent Balb/c-3T3 cells. The HDAC11 5′ flanking region contains a CpG island of approximately 1 kb, and methylation of cytosines in CpG-rich regions of gene promoters typically silences promoter activity.Citation18 Thus, methylation is a possible mechanism of HDAC11 promoter inactivation in clone 2 cells. To test this premise, we isolated genomic HDAC11 DNA from confluent Balb/c-3T3 and clone 2 cells and treated it with bisulfite. Bisulfite converts unmethylated cytosines to uridines, and methylated and non-methylated (converted) DNA sequences can be distinguished by PCR using the appropriate primers. As shown in , amounts of non-methylated HDAC11 DNA in Balb/c-3T3 and clone 2 cells were similar, and no methylated HDAC11 DNA was detected in either. Thus, methylation does not account for the inactivity of the HDAC11 promoter in clone 2 cells; however, inactivity of the HDAC11 promoter may account for the lack of accumulation of HDAC11 mRNA in these cells.
Figure 5. The HDAC11 promoter is active in Balb/c-3T3 but not clone 2 cells. (A) Proliferating Balb/c-3T3 and clone 2 cells (approximately 80% confluent) were transfected with pRL-CMV (for normalization) and either pGL3-Basic (–) or pGL3-HDAC11 (+). Cells were harvested 38 h later for determination of luciferase activity and were confluent at the time. Error bars show standard deviation. Data are expressed as fold increase in HDAC11 promoter activity. RLU1/RLU2 values for pGL3-Basic in Balb/c-3T3 and clone 2 cells were 0.011 and 0.035, respectively. (B) Genomic DNA was isolated from confluent Balb/c-3T3 and clone 2 cells, and CpG island methylation was determined as described in “Materials and Methods”.
HDAC11 mRNA accumulates in serum-deprived Balb/c-3T3 cells
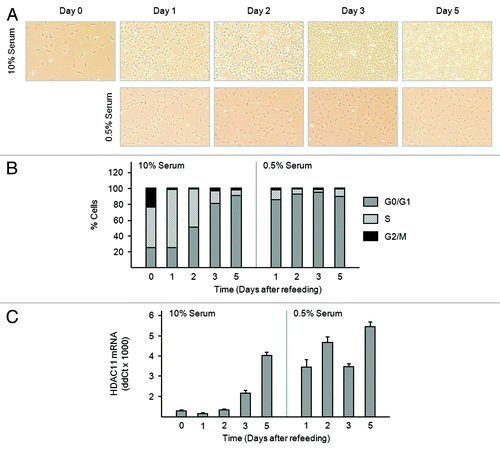
The increase in HDAC11 mRNA abundance in dense Balb/c-3T3 cultures may result from cell–cell contact or cell cycle exit. To distinguish between these alternatives, we monitored HDAC11 mRNA abundance in Balb/c-3T3 cells rendered quiescent by serum limitation. Low density, cycling cells were refed with medium containing 0.5% or 10% serum (day 0). Maintenance of cultures in 0.5% serum effectively inhibited cell proliferation: cell density did not increase, and more than 80% of serum-deprived cells were in G0/G1 within 1 d of serum step-down (). Coincident with the cessation of proliferation, amounts of HDAC11 mRNA rose sharply on day 1 and remained elevated for duration of the experiment (). Amounts of HDAC11 mRNA in cells receiving 0.5% serum were comparable to those of cells grown to density arrest in 10% serum (day 5). These data indicate that accumulation of HDAC11 mRNA correlates with entry into quiescence, and that cell–cell contact is not required.
Figure 6. Serum deprivation increases amounts of HDAC11 mRNA in Balb/c-3T3 cells. (A–C) Sparse, cycling cells in 10% serum were refed with medium containing 10% or 0.5% serum (day 0). (A) Cultures were photographed on the days indicated. Magnification is 10×. (B) Percentages of cells in G0/G1, S, and G2/M were determined by FACS analysis of propidium iodide-stained cells. (C) Amounts of HDAC11 mRNA were determined by RT-qPCR on the days indicated. Error bars show standard deviation.
Overexpression of HDAC11 inhibits cell cycle progression
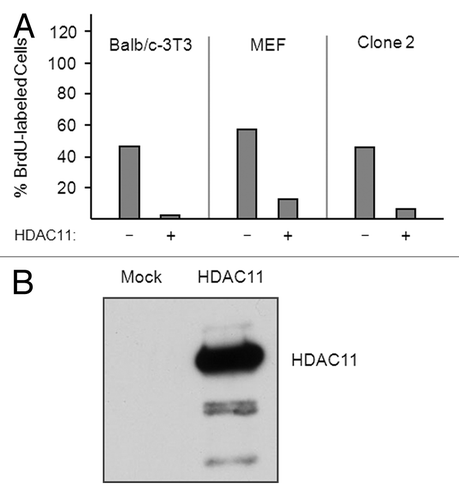
To assess effects of HDAC11 on cell cycle progression, we co-transfected Balb/c-3T3 cells, clone 2 cells, and mouse embryo fibroblasts (MEFs) with plasmids encoding HDAC11 and green fluorescence protein (GFP). Transfected cells were pulsed for 1 h with bromodeoxyuridine (BrdU) and sorted on the basis of GFP (and hence HDAC11) expression, and the percentage of BrdU-labeled cells was determined for each group. For all 3 cell lines, overexpression of HDAC11 substantially reduced the percentage of S-phase cells (). Thus, at least when overexpressed, HDAC11 inhibits the progression of both transformed and nontransformed cells through the cell cycle. Western blots of transfected Balb/c-3T3 cells show readily detectable expression of ectopic HDAC11 ().
Figure 7. Overexpression of HDAC11 inhibits the cell cycle progression of nontransformed and transformed fibroblasts. (A) Sparse proliferating Balb/c-3T3, MEFs, and Clone-2 cells were transfected with plasmids encoding Flag-tagged HDAC11 and GFP. Thirty hours after transfection, cells were pulsed with 30 μM BrdU for 1 h and sorted for GFP expression. The percentage of BrdU-labeled cells was determined for cells expressing (+) or not expressing (–) ectopic proteins. (B) Balb/c-3T3 cells were mock transfected or transfected with a plasmid encoding HDAC11. Cell extracts were western blotted with a monoclonal antibody to HDAC11 prepared for us by Abpro Labs.
Discussion
Our studies show that HDAC11 mRNA abundance correlates with the proliferative status of fibroblasts: low in cycling cells, high in quiescent cells. HDAC11 mRNA accumulated in Balb/c-3T3 cells entering quiescence as a result of serum limitation or cell–cell contract and decreased in abundance when cells were induced to reenter the cell cycle by mitogen addition. It did not accumulate in a spontaneously transformed Balb/c-3T3 variant (clone 2) that does not growth arrest at high density. We also show that HDAC11 is growth-suppressive when overexpressed in Balb/c-3T3, clone 2, and MEF cells.
Other findings link HDAC11 to growth inhibition. As reported by Liu et al.,Citation12 mature neural cells of the dentate gyrus and corpus callosum of post-natal mice express HDAC11, whereas actively proliferating neural precursors do not. Kino and coworkersCitation19 observed upregulation of HDAC11 mRNA in pluripotent neural stem cells induced to differentiate by withdrawal of fibroblast growth factor. On the other hand, in the studies of Lian et al.,Citation8 T-cell proliferation was stimulated by ectopic expression of HDAC11 and inhibited by depletion of HDAC11. It is certainly possible that HDAC11 has different effects in different cell types.
Our experiments assessing HDAC11 mRNA abundance after addition of mitogens to density-arrested Balb/c-3T3 cells show 2 responses: a rapid but transient decrease in cells receiving PDGF alone and a sustained decrease in cells co-treated with PDGF and PPP. PDGF renders density-arrested Balb/c-3T3 cells responsive to mitogens contained in PPP; in response to these mitogens, cells traverse G0/G1 and enter S phase.Citation15 Thus, the initial and prolonged declines in HDAC11 mRNA abundance correspond to the initiation and execution of G0/G1 progression, respectively. Persistent downregulation of HDAC11 mRNA may require progression (i.e., a cell cycle-dependent event) or may result from the concerted actions of multiple mitogens independent of cell cycle position. We note that PPP alone did not appreciably affect HDAC11 abundance, nor did PPP-derived mitogens (EGF, IGF-1, insulin).
As determined by luciferase assays, the HDAC11 promoter was active in confluent Balb/c-3T3 (although not in confluent clone 2 cells). However, PDGF did not affect HDAC11 promoter activity when added to density-arrested Balb/c-3T3 cells. Instead, it reduced HDAC11 mRNA stability. Although the exact mechanism of how it does so remains to be determined, we show that protein and mRNA synthesis are required. Lack of luciferase turnover within the experimental time frame does not account for the lack of effect of PDGF on HDAC11 promoter activity. Using the same luciferase plasmid (PGL3-Basic) as used here, we have shown that PDGF reduces the activity of the p27Kip1 promoter within 4 h of its addition to density-arrested Balb/c-3T3 cells.Citation20
It will be important to determine the effects of PDGF and proliferative status on amounts of HDAC11 protein. However, despite use of multiple cell extraction protocols (0.1% Tween-20, 1% NP-40, 6 M Urea, or 0.5% SDS containing lysis buffers) and systematic subcellular fractionation (NE-PER™ nuclear and cytoplasmic extraction reagent, Pierce) along with use of highly concentrated cell extracts, we could not detect endogenous HDAC11 in Balb/c-3T3 or clone 2 cells. We used several commercial antibodies, as well as antibodies prepared by us and others, all of which readily detected ectopically expressed HDAC11. We suggest that Balb/c-3T3 and clone 2 cells express only very small amounts of HDAC11, which are below the level of detection.
Our studies suggest that cell cycle arrest promotes HDAC11 mRNA accumulation. Alternatively, the opposite may be true: HDAC11 mRNA accumulation signals cell cycle arrest. As noted above, and consistent with the latter premise, we show that HDAC11 inhibits cell cycle progression when overexpressed in Balb/c-3T3, clone 2, and MEF cells. Thus, HDAC11 is growth-suppressive, at least when overexpressed. How it might inhibit proliferation is not known at present. Previous studies have shown that HDAC11 interacts with and reduces the stability of the replication licensing factor Cdt1.Citation14 Cdt1 is a component of pre-replication complexes, which form at origins of replication in G1; when activated by cyclin-dependent kinases, pre-replication complexes associate with DNA polymerases, and DNA replication begins. Cdt1 accumulates in cells in G1,Citation21 and it is possible that decreases in amounts of HDAC11 promote accumulation by negating Cdt1 turnover. Conditions that enhance HDAC11 expression (e.g., serum starvation, high density) would prevent Cdt1 build-up and thus the initiation of DNA synthesis. Experiments testing this hypothesis are currently in progress.
Materials and Methods
Cell culture
Balb/c-3T3 cells, clone 2 cells, and MEFs were cultured in Dulbecco modified Eagle medium supplemented with 4 mM L-glutamine, 50 units/ml penicillin, 50 μg/ml streptomycin, and 10% calf serum (Balb/c-3T3, clone 2) or 10% fetal calf serum (MEF). MEFs were prepared from 15- or 16-d-old embryos; after removal of head and internal organs, carcasses were minced and plated in 100 mm culture dishes. Clone 2 cells are a clonal isolate of spontaneously transformed Balb/c-3T3 cells. Transformation was achieved by repeated passaging of Balb/c-3T3 cells and was assessed by cell morphology.
Microarray analysis
Total RNA was extracted from cells with Trizol (Invitrogen). Two micrograms of total RNA served as the mRNA source for the microarray analysis. Poly(A) RNA was converted to cDNA, which was amplified and labeled with biotin.Citation22 Biotin-labeled RNA was hybridized to the Mouse Genome 430 2.0 oligonucleotide array, which contains more than 45 000 probe sets designed from GenBank, dbEST, and RefSeq sequences and can detect an estimated 39 000 distinct transcripts including more than 34 000 known mouse genes. Each gene was represented by oligonucleotides identical to the sequence in the gene and (to measure cross-hybridization) by oligonucleotides with a homomeric mismatch (base transversion) at the central base position of the oligomer. Hybridization and staining and scanning of the chips were performed as outlined in the Affymetrix manual and by Warrington et al.Citation23
Scanned output files were visually inspected for hybridization artifacts and then analyzed by the Affymetrix GeneChip Operating Software program using the MAS 5.0 algorithm. Signal intensity was scaled to an average intensity of 500 before comparison analysis. The program identifies differences in gene expression between any two samples with a statistical algorithm that assesses the behavior of 11 different oligonucleotide probes that detect the same gene.Citation24 Probe sets that yielded P values less than 0.002 were identified as changed (increased or decreased).
RT-qPCR
Total RNA was isolated from cells using an Aurum Total Mini Kit (Bio-Rad). Two micrograms of total RNA served as template for oligo(dT)-primed reverse transcription using SuperScript III reverse transcriptase (Invitrogen). RT-qPCR analyses were performed on a CFX96 Real-Time System (Bio-Rad). Reaction mixtures contained 400 nM forward and reverse primers, 1× iQ-SYBR Green Supermix (Bio-Rad), and an amount of cDNA equivalent to 100 ng total RNA. Reactions were performed in triplicate, and ddCT values were calculated using the 2−ΔΔC(t) method. 18S rRNA and GAPDH mRNA were used as references. Primers used to amplify the mouse HDAC11 coding region were TTACAACCGC CACATCTACC (forward) and GACATTCCTC TCCACCTTCT C (reverse). Primers for18S rRNA were GTAACCCGTT GAACCCCATT (forward) and CCATCCAATC GGTAGTAGCG (reverse). Primers for GAPDH were GAGAAGTATG ACAACAGCCT CAA (forward) and AGTCCTTCCA CGATACCAAA G (reverse).
Western blotting
Cells were rinsed with phosphate-buffered saline (PBS), harvested by scraping, and collected by centrifugation. Cell pellets were resuspended in lysis buffer (50 mM Hepes at pH 7.5, 150 mM NaCl, 1 mM EDTA, 0.1% Tween-20, 10% glycerol, 1 mM NaF, 0.1 mM vanadate, 0.1 mM phenylmethylsulfonylfluoride, 1 μg/ml leupeptin, 1 mM dithiothreitol) and incubated on ice for 15 min. Insoluble material was removed by centrifugation. Cell extracts normalized for amount of protein were resolved by SDS-PAGE and transferred to nitrocellulose membranes. Membranes were blocked in PBS containing 0.1% Tween-20 and 5% instant milk and incubated with primary antibody in PBS containing 0.1% Tween for 2 h at room temperature or overnight at 4°C. Proteins recognized by the primary antibody were detected by enhanced chemiluminescence using a horseradish peroxidase-coupled secondary antibody according to the instructions of the manufacturer (Pierce). Antibodies to Akt phosphorylated at serine 473 and ERK phosphorylated at threonine 202/tyrosine 204 were purchased from Cell Signaling.
Cell cycle analysis
Cells were removed from the plates with 0.125% trypsin and 0.5 mM EDTA in PBS; an equal volume of medium containing 10% serum was added to neutralize the trypsin. Cells were pelleted and resuspended in PBS (1 ml), and 100% ethanol (3.5 ml) was added slowly. Cells were incubated at 4 °C for a minimum of 16 h, pelleted, and resuspended in PBS containing 0.1% Tween-20, 0.05% bovine serum albumin, 10 mg/ml RNase A, and 50 mg/ml propidium iodide. After a further incubation at 4 °C for at least 4 h, cell cycle distribution was determined on a Becton Dickinson FACScan.
Transfection
The human HDAC11 promoter (–1940 to –80 relative to the translation start site)Citation25 was subcloned into pGL3-Basic, which encodes the reporter protein firefly luciferase. Proliferating cells (2 × 10⁵) were transfected using lipofectamine 2000 (Invitrogen). For normalization of transfection efficiency, cells were co-transfected with pRL-CMV, which encodes Renilla luciferase. Cells were lysed with Passive Lysis Buffer (Promega), and luciferase activities were measured using substrates for firefly luciferase and Renilla luciferase (Promega) in a 20/20 luminometer.
Methylation assay
Genomic DNA was prepared using a DNeasy Tissue kit (Qiagen). Bisulfite conversion was performed using 500 ng genomic DNA and an EpiTect Plus DNA Bisulfite kit (Qiagen). Methylation-specific PCR amplification of the CpG island in the HDAC11 promoter was performed using 100 ng bisulfite-converted DNA as specified in the EpiTect Plus DNA Bisulfite kit manual. PCR products were run on 3% agarose gels. PCR primers used to amplify bisulfite-converted DNA were: ATGGTATAGG AATGTAGGGA TGTAT (forward) and AAACTAAAAA TAAAACTCTA ACCTACAACT (reverse). PCR primers used to amplify non-converted DNA were: ATGGTACAGG AATGCAGGGA TGCAC (forward) and GAGCTGGAGG TGGAGCTCTG GCCTGCAGCT (reverse).
| Abbreviations: | ||
| BrdU | = | bromodeoxyuridine |
| DRB | = | 5,6-dichlorobenzimidazole |
| EGF | = | epidermal growth factor |
| GFP | = | green fluorescent protein |
| HDAC | = | histone deacetylase |
| IGF-1 | = | insulin-like growth factor 1 |
| MEF | = | mouse embryonic fibroblast |
| PBS | = | phosphate-buffered saline |
| PDGF | = | platelet-derived growth factor |
| PPP | = | platelet-poor plasma |
| RT-qPCR | = | quantitative real-time PCR |
Acknowledgments
We acknowledge the helpful assistance of the Molecular Biology and Flow Cytometry Cores at the Moffitt Cancer Center and thank Nancy Olashaw for manuscript preparation. This work was supported by the Gonzmart Family Laboratory and the US Army Medical Research and Materiel Command, National Functional Genomics Center project, under award number W81XWH-08-2-0101. Opinions, interpretations, conclusions and recommendations are those of the authors and are not necessarily endorsed by the US Army.
Disclosure of Potential Conflicts of Interest
No potential conflicts of interest were disclosed.
References
- Yang XJ, Seto E. The Rpd3/Hda1 family of lysine deacetylases: from bacteria and yeast to mice and men. Nat Rev Mol Cell Biol 2008; 9:206 - 18; http://dx.doi.org/10.1038/nrm2346; PMID: 18292778
- Xu WS, Parmigiani RB, Marks PA. Histone deacetylase inhibitors: molecular mechanisms of action. Oncogene 2007; 26:5541 - 52; http://dx.doi.org/10.1038/sj.onc.1210620; PMID: 17694093
- Zhang X, Yuan Z, Zhang Y, Yong S, Salas-Burgos A, Koomen J, Olashaw N, Parsons JT, Yang XJ, Dent SR, et al. HDAC6 modulates cell motility by altering the acetylation level of cortactin. Mol Cell 2007; 27:197 - 213; http://dx.doi.org/10.1016/j.molcel.2007.05.033; PMID: 17643370
- Van Lint C, Emiliani S, Verdin E. The expression of a small fraction of cellular genes is changed in response to histone hyperacetylation. Gene Expr 1996; 5:245 - 53; PMID: 8723390
- Gao L, Cueto MA, Asselbergs F, Atadja P. Cloning and functional characterization of HDAC11, a novel member of the human histone deacetylase family. J Biol Chem 2002; 277:25748 - 55; http://dx.doi.org/10.1074/jbc.M111871200; PMID: 11948178
- Deubzer HE, Schier MC, Oehme I, Lodrini M, Haendler B, Sommer A, Witt O. HDAC11 is a novel drug target in carcinomas. Int J Cancer 2013; 132:2200 - 8; http://dx.doi.org/10.1002/ijc.27876; PMID: 23024001
- Villagra A, Cheng F, Wang HW, Suarez I, Glozak M, Maurin M, Nguyen D, Wright KL, Atadja PW, Bhalla K, et al. The histone deacetylase HDAC11 regulates the expression of interleukin 10 and immune tolerance. Nat Immunol 2009; 10:92 - 100; http://dx.doi.org/10.1038/ni.1673; PMID: 19011628
- Lian ZR, Xu YF, Wang XB, Gong JP, Liu ZJ. Suppression of histone deacetylase 11 promotes expression of IL-10 in Kupffer cells and induces tolerance following orthotopic liver transplantation in rats. J Surg Res 2012; 174:359 - 68; http://dx.doi.org/10.1016/j.jss.2010.12.035; PMID: 21392795
- Buglio D, Khaskhely NM, Voo KS, Martinez-Valdez H, Liu YJ, Younes A. HDAC11 plays an essential role in regulating OX40 ligand expression in Hodgkin lymphoma. Blood 2011; 117:2910 - 7; http://dx.doi.org/10.1182/blood-2010-08-303701; PMID: 21239696
- Feng W, Lu Z, Luo RZ, Zhang X, Seto E, Liao WS, Yu Y. Multiple histone deacetylases repress tumor suppressor gene ARHI in breast cancer. Int J Cancer 2007; 120:1664 - 8; http://dx.doi.org/10.1002/ijc.22474; PMID: 17230502
- Liu H, Hu Q, D’ercole AJ, Ye P. Histone deacetylase 11 regulates oligodendrocyte-specific gene expression and cell development in OL-1 oligodendroglia cells. Glia 2009; 57:1 - 12; http://dx.doi.org/10.1002/glia.20729; PMID: 18627006
- Liu H, Hu Q, Kaufman A, D’Ercole AJ, Ye P. Developmental expression of histone deacetylase 11 in the murine brain. J Neurosci Res 2008; 86:537 - 43; http://dx.doi.org/10.1002/jnr.21521; PMID: 17893925
- Chen YT, Zang XF, Pan J, Zhu XL, Chen F, Chen ZB, Xu Y. Expression patterns of histone deacetylases in experimental stroke and potential targets for neuroprotection. Clin Exp Pharmacol Physiol 2012; 39:751 - 8; http://dx.doi.org/10.1111/j.1440-1681.2012.05729.x; PMID: 22651689
- Glozak MA, Seto E. Acetylation/deacetylation modulates the stability of DNA replication licensing factor Cdt1. J Biol Chem 2009; 284:11446 - 53; http://dx.doi.org/10.1074/jbc.M809394200; PMID: 19276081
- Pledger WJ, Stiles CD, Antoniades HN, Scher CD. Induction of DNA synthesis in BALB/c 3T3 cells by serum components: reevaluation of the commitment process. Proc Natl Acad Sci U S A 1977; 74:4481 - 5; http://dx.doi.org/10.1073/pnas.74.10.4481; PMID: 270695
- Pledger WJ, Hart CA, Locatell KL, Scher CD. Platelet-derived growth factor-modulated proteins: constitutive synthesis by a transformed cell line. Proc Natl Acad Sci U S A 1981; 78:4358 - 62; http://dx.doi.org/10.1073/pnas.78.7.4358; PMID: 6170062
- Heldin CH, Westermark B. Mechanism of action and in vivo role of platelet-derived growth factor. Physiol Rev 1999; 79:1283 - 316; PMID: 10508235
- Jones PA. Functions of DNA methylation: islands, start sites, gene bodies and beyond. Nat Rev Genet 2012; 13:484 - 92; http://dx.doi.org/10.1038/nrg3230; PMID: 22641018
- Androutsellis-Theotokis A, Chrousos GP, McKay RD, DeCherney AH, Kino T. Expression profiles of the nuclear receptors and their transcriptional coregulators during differentiation of neural stem cells. Horm Metab Res 2013; 45:159 - 68; PMID: 22990992
- Bagui TK, Cui D, Roy S, Mohapatra S, Shor AC, Ma L, Pledger WJ. Inhibition of p27Kip1 gene transcription by mitogens. Cell Cycle 2009; 8:115 - 24; http://dx.doi.org/10.4161/cc.8.1.7527; PMID: 19158484
- Nishitani H, Taraviras S, Lygerou Z, Nishimoto T. The human licensing factor for DNA replication Cdt1 accumulates in G1 and is destabilized after initiation of S-phase. J Biol Chem 2001; 276:44905 - 11; http://dx.doi.org/10.1074/jbc.M105406200; PMID: 11555648
- Van Gelder RN, von Zastrow ME, Yool A, Dement WC, Barchas JD, Eberwine JH. Amplified RNA synthesized from limited quantities of heterogeneous cDNA. Proc Natl Acad Sci U S A 1990; 87:1663 - 7; http://dx.doi.org/10.1073/pnas.87.5.1663; PMID: 1689846
- Warrington JA, Nair A, Mahadevappa M, Tsyganskaya M. Comparison of human adult and fetal expression and identification of 535 housekeeping/maintenance genes. Physiol Genomics 2000; 2:143 - 7; PMID: 11015593
- Liu WM, Mei R, Di X, Ryder TB, Hubbell E, Dee S, Webster TA, Harrington CA, Ho MH, Baid J, et al. Analysis of high density expression microarrays with signed-rank call algorithms. Bioinformatics 2002; 18:1593 - 9; http://dx.doi.org/10.1093/bioinformatics/18.12.1593; PMID: 12490443
- Voelter-Mahlknecht S, Ho AD, Mahlknecht U. Chromosomal organization and localization of the novel class IV human histone deacetylase 11 gene. Int J Mol Med 2005; 16:589 - 98; PMID: 16142391