
Abstract
The PI3K/Akt/mTORC1 pathway plays prominent roles in malignant transformation, prevention of apoptosis, drug resistance, and metastasis. One molecule regulated by this pathway is GSK-3β. GSK-3β is phosphorylated by Akt on S9, which leads to its inactivation; however, GSK-3β also can regulate the activity of the PI3K/Akt/mTORC1 pathway by phosphorylating molecules such as PTEN, TSC2, p70S6K, and 4E-BP1. To further elucidate the roles of GSK-3β in chemotherapeutic drug and hormonal resistance of MCF-7 breast cancer cells, we transfected MCF-7 breast cancer cells with wild-type (WT), kinase-dead (KD), and constitutively activated (A9) forms of GSK-3β. MCF-7/GSK-3β(KD) cells were more resistant to doxorubicin and tamoxifen compared with either MCF-7/GSK-3β(WT) or MCF-7/GSK-3β(A9) cells. In the presence and absence of doxorubicin, the MCF-7/GSK-3β(KD) cells formed more colonies in soft agar compared with MCF-7/GSK-3β(WT) or MCF-7/GSK-3β(A9) cells. In contrast, MCF-7/GSK-3β(KD) cells displayed an elevated sensitivity to the mTORC1 blocker rapamycin compared with MCF-7/GSK-3β(WT) or MCF-7/GSK-3β(A9) cells, while no differences between the 3 cell types were observed upon treatment with a MEK inhibitor by itself. However, resistance to doxorubicin and tamoxifen were alleviated in MCF-7/GSK-3β(KD) cells upon co-treatment with an MEK inhibitor, indicating regulation of this resistance by the Raf/MEK/ERK pathway. Treatment of MCF-7 and MCF-7/GSK-3β(WT) cells with doxorubicin eliminated the detection of S9-phosphorylated GSK-3β, while total GSK-3β was still detected. In contrast, S9-phosphorylated GSK-3β was still detected in MCF-7/GSK-3β(KD) and MCF-7/GSK-3β(A9) cells, indicating that one of the effects of doxorubicin on MCF-7 cells was suppression of S9-phosphorylated GSK-3β, which could result in increased GSK-3β activity. Taken together, these results demonstrate that introduction of GSK-3β(KD) into MCF-7 breast cancer cells promotes resistance to doxorubicin and tamoxifen, but sensitizes the cells to mTORC1 blockade by rapamycin. Therefore GSK-3β is a key regulatory molecule in sensitivity of breast cancer cells to chemo-, hormonal, and targeted therapy.
Introduction
GSK-3 is a serine (S)/threonine(T) kinase. It was initially identified in rat skeletal muscle as a kinase that phosphorylated and inactivated glycogen synthase (GS), the last enzyme in glycogen biosynthesis.Citation1,Citation2 There are 2 known GSK-3 family members (GSK-3α and GSK-3β). They are ubiquitously expressed and highly conserved. GSK-3β activity is regulated by phosphorylation at S9 and other residues. S9 phosphorylation of GSK-3β results in its inactivation by proteosomal degradation. Diverse kinases can phosphorylate GSK-3β at S9 including protein kinase A (PKA), protein kinase B (PKB a.k.a Akt), p90 ribosomal S6 kinase (p90Rsk), and p70 ribosomal S6 kinase (p70S6K).Citation3-Citation7
The PI3K/PTEN/Akt/mTORC1 pathway is a key pathway which regulates cellular proliferation. It can couple signals from upstream growth factor receptors to regulate many important biochemical activities, including transcription factors and molecules involved in protein translation. This pathway is regulated at many points. Deregulation or activating mutations at growth factor receptors or mutations at intrinsic components of the pathway, such as PI3K (PIK3CA), result in activation of the pathway. Certain tumor suppressor genes such as PTEN, TSC1, and TSC2 serve to negatively regulate this pathway. Mutations/deletions or silencing of these tumor suppressor genes can serve to abnormally activate the pathway. A frequent consequence of activation of this pathway is increased Akt activity, which can lead to GSK-3β phosphorylation and subsequent inactivation.
The PI3K/PTEN/mTOR pathway is also involved in drug resistance, sensitivity to therapy, and metastasis.Citation8-Citation13 PIK3CA mutations may be driver mutations in certain cancers responsible for metastasis.Citation14 Novel PI3Kα inhibitors have been isolated, and they inhibit metastasis.Citation14,Citation15 Most PI3K inhibitors are cytostatic rather than cytotoxic, and it has been questioned whether treatment with a single PI3K inhibitor will be effective.Citation16
The tumor suppressor genes TSC1/TSC2 can regulate mTORC1 activity and GSK-3β can play a key role in this regulatory circuit. GSK-3β can phosphorylate TSC2 and stimulate its activity, which inhibits Rheb and mTORC1 activity. GSK-3β can phosphorylate p70S6KCitation17,Citation18 and 4E-BP1.Citation19 GSK-3β positively regulates p70S6K activity by S371 phosphorylation. In contrast when 4E-BP1 is phosphorylated by GSK-3β at T37/T46, its activity is inhibited.Citation18 mTORC1 collaborates with GSK-3β to regulate p70S6K activity and cell proliferation,Citation17,Citation18 although other studies have indicated that GSK-3β can negatively regulate phosphorylation of p70S6K at T389 by activating TSC2.Citation20 Thus, GSK-3β plays important roles in cell cycle progression.Citation21
Aberrant GSK-3β expression has also been observed in cancers, which are resistant to radio-, chemo- and targeted therapy.Citation21-Citation24 Targeting GSK-3β has been shown to increase the sensitivity to certain drugs and other small-molecule inhibitors.Citation21-Citation24 The roles of GSK-3β in cancer remain controversial. Some studies have shown that GSK-3β may play a positive role in cell proliferation, and the GSK-3β protein is overexpressed in certain tumor types, including colon, liver, ovarian, and pancreatic cancer.Citation25-Citation27
Inhibition of GSK-3β expression can suppress pancreatic cancer growth and angiogenesis.Citation28 In cells with GSK-3β knocked-down, there were also decreased levels of Bcl-2 and vascular endothelial growth factor (VEGF). Certain small-molecule inhibitors will synergize with GSK-3β inhibition to result in cell death.Citation29 Sorafenib induces GSK-3β, which actually provides a survival signal in melanoma cells. When a constitutively active form of GSK-3β was introduced into the melanoma cells, elevated levels of anti-apoptotic Bcl-2, Bcl-XL, and survivin were detected, while decreased levels of pro-apoptotic Noxa were observed. Elimination of GSK-3β activity increased the activity of sorafenib.
Breast cancer is a leading cause of cancer-related death in women worldwide. This disease is diagnosed in nearly 1.4 million women worldwide every year. Unfortunately, breast cancer is responsible for more than 450 000 deaths annually. A prominent risk factor for the onset of breast cancer is age, however. Factors linked to lifestyle and diet contribute to the development of breast cancer. Also mutations or deregulation of certain genes (BRCA1, BRCA2, PIKCA) and others play important roles in breast cancer.Citation30-Citation35 The tumor suppressor genes p53, MDM2, and Rb also can play roles in the therapeutic responses of breast cancer.Citation36-Citation40 Restoration of functional p53 can increase the sensitivity to certain p53-mutant cells to chemo- and other types of therapy.Citation40
The most commonly utilized treatment for breast cancer is surgical removal of the tumor coupled with adjuvant chemotherapy or radiation. Radiation and chemotherapy are effective in killing or limiting the growth of actively dividing cancer cells through various mechanisms, including the production of oxygen free radicals, DNA damage, and subsequent apoptosis.Citation41 Common chemotherapeutic drugs used to treat breast cancer include the anthracyclines, taxanes, 5-fluorouracil, cyclophosphamide, and methotrexate.Citation42 Doxorubicin, also known as adriamycin, is in the anthracycline class of antibiotic chemotherapeutic drugs. These compounds work by intercalating between adjacent DNA pairs and inhibiting topoisomerase II, thereby interfering with DNA, RNA, and protein synthesis.
In addition to chemotherapy, another common treatment option for breast cancer involves a hormonal-based approach. Certain early-stage breast cancers overexpress various isoforms of the estrogen receptor (ER), making their growth dependent on estrogen. The selective ER modulator, tamoxifen (4HT), can block estrogen signaling by competitively binding the ER and antagonizing its proliferative effects.Citation10 However, once a breast cancer has undergone additional molecular changes, allowing it to overcome estrogen dependence, hormonal therapy is no longer effective.Citation43,Citation44 Rb is a critical protein involved in the regulation of cell cycle progression and is a tumor suppressor gene. The Rb pathway is involved in sensitivity to tamoxifen.Citation45 Loss of functional Rb activity is associated with resistance to tamoxifen.Citation46 Thus oncogenes and tumor suppressor genes often are important in the sensitivity to therapy.
Breast cancers can carry inherent drug resistance or develop an acquired resistance after exposure to the compound.Citation47-Citation49 Resistance is commonly developed in patients on anthracycline chemotherapy drugs.Citation50 Resistance can also occur in patients receiving hormonal therapy and immunotherapy once the cancer is no longer dependent on the targeted receptor to grow. Therefore, cancer cells are capable of undergoing changes that confer survival advantages in otherwise nutrient-restricted or toxic environments. Novel targets and approaches to treat breast cancer are needed, and some are being evaluated.
A study of patient tumor samples revealed a reduction or loss of cytoplasmic GSK-3β in 53% of invasive ductal carcinomas (IDC) examined. This same study found that nuclear accumulation of GSK-3β was present in 35% of IDC samples examined and was positively associated with tumor grade.Citation51 Therefore, increases in PI3K/Akt signaling and altered cellular localization of GSK-3β may be among the regulatory factors that impinge upon the behavior of breast cancer cells. A downstream target of GSK-3 is p27Kip-1, which is also implicated in breast cancer.Citation52 In addition, p70S6K can be regulated by GSK-3 and is involved in breast cancer.Citation53
Enforced expression of kinase-dead (KD) GSK-3beta promoted tumorigenesis of breast and skin tumors.Citation54 Overexpression of constitutively active GSK-3β increased chemosensitivity, cell cycle arrest, and reduced tumorigenicity of breast cancers.Citation55,Citation56 Likewise, pharmacological inhibition of GSK-3β induces epithelial–mesenchymal transition (EMT) and invasion in breast cancer.Citation57
In the following studies, we investigated the effects of GSK-3β expression on properties associated with cellular transformation, drug resistance, and sensitivity to hormonal and targeted therapy. Expression of a GSK-3β(KD) mutant in MCF-7 breast cancer cells increased the resistance of the cells to doxorubicin and tamoxifen, 2 drugs used to treat breast cancer patients. This drug resistance could be suppressed by treatment with MEK inhibitors. In contrast, cells expressing the GSK-3β(KD) were very sensitive to mTORC inhibitors. Our results document key interactions between the MEK and mTORC1 pathways in drug sensitivity and how they can be regulated by GSK-3β.
Results
To determine the effects of GSK-3β on the sensitivity of breast cancer cells to chemotherapy, hormonal therapy, and targeted therapy, MCF-7 cells were transfected with wild-type (WT), constitutively-activated (A9), and kinase-dead (KD) forms of GSK-3βCitation58,Citation59 and stable transfected pools of cells were isolated in the presence of G418. The effects of GSK-3β expression on the clonogenicity of MCF-7/GSK-3β(WT), MCF-7/GSK-3β(A9), and MCF-7/GSK-3β(KD) cells was determined under anchorage-dependent () and anchorage-independent () conditions.
Figure 1. MCF-7/GSK-3β(KD) cells form more colonies under adherence conditions in the presence of doxorubicin than either MCF-7/GSK-3β(WT) or MCF-7/GSK-3β(A9) cells. The abilities of MCF-7/GSK-3β(WT), MCF-7/GSK-3β(A9), and MCF-7/GSK-3β(KD) cells to form colonies in the presence and absence of 25 nM doxorubicin were determined by plating the cells in triplicate in 6-well plates under adherence conditions. (A) Mean and standard deviation of raw colony counts. The P value between the subcloning of MCF-7/GSK-3β(WT) and MCF-7/GSK-3β(A9) in the absence of doxorubicin was 0.0012. The P value between the subcloning of MCF-7/GSK-3β(WT) and MCF-7/GSK-3β(KD) in the absence of doxorubicin was 0.0432. The P value between the subcloning of MCF-7/GSK-3β(A9) and MCF-7/GSK3β(KD) in the absence of doxorubicin was 0.0116. The P value between the subcloning of MCF-7/GSK-3β(WT) and MCF-7/GSK-3β(A9) in the presence of doxorubicin was 0.7292 and was not significantly different. The P value between the subcloning of MCF-7/GSK-3β(WT) and MCF-7/GSK-3β(KD) in the presence of doxorubicin was 0.0025. The P value between the subcloning of MCF-7/GSK-3β(A9) and MCF-7/GSK-3β(KD) in the presence of doxorubicin was 0.0062. (B) Mean and standard deviations of normalized cell counts. In this panel the mean of the raw counts for each cell type was set (normalized) to 100 and the mean and standard deviation of the raw counts in the presence of 25 nM doxorubicin was normalized to the number of counts in the untreated condition for each cell type. This normalized graph eliminates differences in plating efficiency between the 3 cell types in the absence of doxorubicin. The P value between the subcloning of MCF-7/GSK-3β(WT) and MCF-7/GSK-3β(KD) in the presence of doxorubicin was 0.0033. The P value between the subcloning of MCF-7/GSK-3β(A9) and MCF-7/GSK-3β(KD) in the presence of doxorubicin was 0.0040.
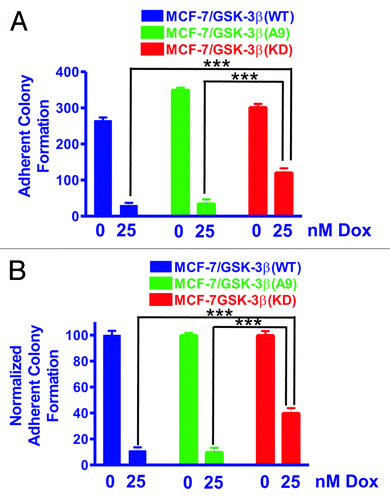
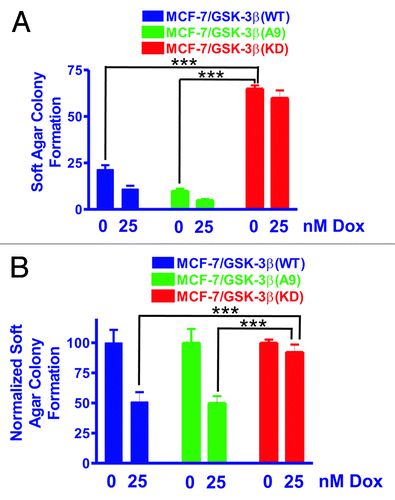
Figure 2. MCF-7/GSK-3β(KD) cells form more colonies in soft agar in the presence or absence of doxorubicin than either MCF-7/GSK-3β(WT) or MCF-7/GSK-3β(A9) cells. The ability of MCF-7/GSK-3β(WT), MCF-7/GSK-3β(A9), and MCF-7/GSK-3β(KD) cells to form colonies in the presence and absence of 25 nM doxorubicin was determined by plating the cells in triplicate in 6-well plates in soft agar conditions which measures the ability of the cells to grow in an anchorage-independent fashion.Citation60,Citation61 (A) Mean and standard deviation of raw colony counts in soft agar. The statistical significance of the number of colonies in the absence of 25 nM doxorubicin for MCF-7/GSK-3β(KD) cells was compared with MCF-7/GSK-3β(WT) and MCF-7/GSK-3β(A9) cells by the unpaired t test with a 95% confidence interval. Comparisons determined to be statistically significant are indicated by ***. In addition, the colony formation of MCF-7/GSK-3β(KD) in the presence of 25 nM doxorubicin was higher than that observed in MCF-7/GSK-3β(WT) and MCF-7/GSK-3β(A9) cells and was determined to be statically significant by the unpaired t test with a 95% confidence interval. The P value between the subcloning of MCF-7/GSK-3β(WT) and MCF-7/GSK-3β(A9) in soft agar in the absence of doxorubicin was 0.0131. The P value between the subcloning of MCF-7/GSK-3β(WT) and MCF-7/GSK-3β(KD) in soft agar in the absence of doxorubicin was 0.0001. The P value between the subcloning of MCF-7/GSK-3β(A9) and MCF-7/GSK-3β(KD) in soft agar in the absence of doxorubicin was 0.0001. The P value between the subcloning of MCF-7/GSK-3β(WT) and MCF-7/GSK3β(A9) in soft agar in the presence of doxorubicin was 0.0303. The P value between the subcloning of MCF-7/GSK-3β(WT) and MCF-7/GSK-3(KD) in soft agar in the presence of doxorubicin was 0.0004. The P value between the subcloning of MCF-7/GSK-3β(A9) and MCF-7/GSK-3β(KD) in soft agar in the presence of doxorubicin was 0.0002. (B) Mean and standard deviations of normalized cell colonies in soft agar. In this panel the mean of the raw counts for each cell type was set (normalized) to 100 and the mean and standard deviation of the raw counts in the presence of 25 nM doxorubicin was normalized to the number of counts in the untreated condition for each cell type. This normalized graph eliminates differences in plating efficiency between the 3 cell types in the absence of doxorubicin. Comparisons determined to be statistically significant are indicated by ***. The P value between the subcloning of MCF-7/GSK-3β(WT) and MCF-7/GSK-3β(KD) in soft agar in the presence of doxorubicin was 0.0155. The P value between the subcloning of MCF-7/GSK-3β(A9) and MCF-7/GSK3β(KD) in soft agar the presence of doxorubicin was 0.0076.
Clonogenicity under anchorage-dependent conditions was assessed in the presence or absence of doxorubicin to determine the effects of chemotherapy (). In , the total counts (averages and standard deviations) of 3 plates of each of the transfected cell lines obtained under the indicated conditions are presented.
As shown in , the colony-formation ability of MCF-7/GSK-3β(WT) cells was decreased by almost 90% when treated with 25 nM doxorubicin. MCF-7/GSK-3β(A9) cells also had a 90% reduction in their colony-formation ability in the presence of 25 nM doxorubicin. In contrast, MCF-7/GSK-3β(KD) cells exhibited exhibit only a 40% reduction in colony-formation ability when plated in medium containing 25 nM doxorubicin. These results demonstrate that expression of the GSK-3β(KD) gene in MCF-7/GSK-3β(KD) cells enhanced clonogenicity in the presence of 25 nM doxorubicin compared with either MCF-7/GSK-3β(WT) or MCF-7/GSK-3β(A9) cells. The results were also normalized to the untreated levels of each type of GSK-3β construct (). Clearly, the MCF-7/GSK-3β(KD) cells formed significantly more colonies in 25 nM doxorubicin than the MCF-7/GSK-3β(WT) or MCF-7/GSK-3β(A9) cells.
Clonogenicity in soft agar was enhanced in MCF-7/GSK-3β(KD) cells in comparison to MCF-7/GSK-3β(WT) or MCF-7/GSK-3β(A9) cells
To assess clonogenicity under anchorage-independent conditions, MCF-7/GSK-3β(WT), MCF-7/GSK-3β(A9), and MCF-7/GSK-3β(KD) cells were seeded as single cells in soft agar and allowed to expand for 3 wk. , shows the total number of colonies (means and standard deviations) that formed in the presence and absence of 25 nM doxorubicin. As expected, the colony-formation ability of all 3 cell lines was markedly decreased under anchorage-independent conditions as compared with anchorage-dependent conditions (compare with ). MCF-7/GSK-3β(KD) cells had a significantly higher plating efficiency in soft agar than either MCF-7/GSK-3β(WT) or MCF-7/GSK-3β(A9) cells when the cells were plated in the absence of doxorubicin.
In the presence of 25 nM doxorubicin, MCF-7/GSK-3β(WT) cells experienced a 50% reduction in colony-formation ability in soft agar (). A 50% reduction in colony-formation ability in soft agar was also observed for MCF-7/GSK-3β(A9) cells when treated with doxorubicin. However, this was not the case for MCF-7/GSK-3β(KD) cells, which revealed only a 10% reduction in colony-formation ability in the presence of 25 nM doxorubicin. The colony-formation ability of MCF-7/GSK-3β(KD) in soft agar cells in doxorubicin was 5-fold greater than that for MCF-7/GSK-3β(WT) cells and 13-fold greater than MCF-7/GSK-3β(A9) cells (). These results document that the MCF-7/GSK-3β(KD) cells had elevated anchorage-independent clonogenicity in both the presence and absence of chemotherapy in comparison to the MCF-7/GSK-3β(WT) and MCF-7/GSK-3β (A9) cells. To control for differences in plating efficiency between the different types of transfectants, the data were also normalized to the untreated controls of each type of transfectant plated in soft agar (). Again the MCF-7/GSK-3β(KD) formed statistically significantly more colonies in the presence of 25 nM doxorubicin than the MCF-7/GSK-3β(WT) or MCF-7/GSK-3β(A9) cells in soft agar.
MCF-7/GSK-3β(KD) cells have increased resistance to doxorubicin in comparison to MCF-7/GSK-3β(WT) or MCF-7/GSK-3β(A9) cells
The sensitivities of MCF-7/GSK-3β(WT), MCF-7/GSK-3β(A9), and MCF-7/GSK-3β(KD) cells to doxorubicin were measured by MTT assays. Cells were grown for 4 d in the absence or presence of various concentrations of the drug ranging from 2 nM to 2000 nM. The relative growth curves of treated cells as compared with untreated cells are shown in along with corresponding doxorubicin IC50 values shown on a log scale. MCF-7/GSK-3β(WT) cells had the greatest sensitivity to the drug, with an IC50 of approximately 27 nM. A higher IC50 of approximately 46 nM doxorubicin was observed with MCF-7/GSK-3β(A9) cells. The greatest resistance to doxorubicin was observed with MCF-7/GSK-3β(KD) cells which had a doxorubicin IC50 of approximately 68 nM, which was 2.5-fold higher than that of MCF-7/GSK-3β(WT) cells (). Therefore MCF-7/GSK-3β(KD) cells were more resistant to doxorubicin than the MCF-7/GSK-3β(WT) cells. Furthermore, the constitutive-activation of GSK-3β in the MCF-7/GSK-3β(A9) cells increased the resistance of the cells to doxorubicin in comparison to MCF-7/GSK-3β(WT) cells.
Figure 3. Effects of GSK-3β expression on sensitivity to doxorubicin, tamoxifen, a mTORC1 blocker and a MEK inhibitor. The effects of GSK-3β(WT), GSK-3β(A9) and GSK-3β(KD) on the sensitivity of MCF-7 cells to: (A) doxorubicin, (B) tamoxifen (4HT), (C) rapamycin, and (D) Array MEK Inhibitor (ARRY 509) were examined by MTT analysis after incubation of the cells in the indicated concentrations of the drugs. The arrows represents where 50% inhibition of growth intercepts with the x-axis and is used to estimate the IC50. The statistical significance was determined by the unpaired t test. Comparisons determined to be significant are indicated with (***). Symbols: MCF-7/GSK-3β(WT), dark blue lines with solid circles, MCF-7/GSK-3β(A9), green lines with solid triangles, MCF-7/GSK-3β(KD), red lines with solid squares. (A) The P value between doxorubicin treatment of MCF-7/GSK-3β(WT) and MCF-7/GSK-3β(A9) was 0.0001. The P value between doxorubicin treatment of MCF-7/GSK-3β(WT) and MCF-7/GSK-3β(KD) was 0.0001. The P value between doxorubicin treatment of MCF-7/GSK-3β(A9) and MCF-7/GSK-3β(KD) was 0.0001. (B) The P value between 4HT treatment of MCF-7/GSK-3β(WT) and MCF-7/GSK3β(A9) was 0.0001. The P value between 4HT treatment of MCF-7/GSK-3β(WT) and MCF-7/GSK-3β(KD) was 0.0001. The P value between 4HT treatment of MCF-7/GSK-3β(A9) and MCF-7/GSK-3β(KD) was 0.0001. (C) The P value between rapamycin treatment of MCF-7/GSK-3β(WT) and MCF-7/GSK-3β(KD) was 0.0001.
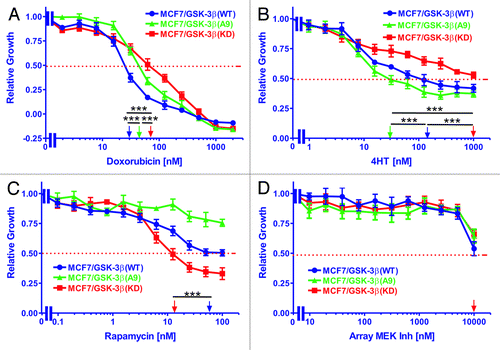
Table 1. Effects of GSK-3β on sensitivity (IC50) of MCF-7 cells to chemo-, hormonal, and targeted therapy
MCF-7/GSK-3β(KD) cells have increased resistance to tamoxifen (4HT) in comparison to MCF-7/GSK-3β(WT) or MCF-7/GSK-3β(A9) cells
The sensitivities of MCF-7/GSK-3β(WT), MCF-7/GSK-3β(A9) and MCF-7/GSK-3β(KD) cells to 4HT were measured by MTT assays. Cells were grown for 4 d either untreated or in the presence of 4HT ranging in concentrations from 1 nM to 1000 nM. The relative growth curves of treated cells as compared with untreated cells are shown in along with corresponding 4HT IC50 values. As shown, MCF-7/GSK-3β(A9) cells were the most sensitive to 4HT, with an IC50 of approximately 31 nM. A higher IC50 of approximately 120 nM was observed with MCF-7/GSK-3β(WT) cells. The greatest resistance to 4HT was found in the MCF-7/GSK-3β(KD) cells. In these cells, the growth curve did not fall below 50% relative growth at the 4HT concentrations examined. An extension of the curve would suggest the 4HT IC50 of MCF-7/GSK-3β(KD) cells to be approximately 2000 nM, which is at least 64-fold higher than that of the MCF-7/GSK-3β(WT) cells (). Therefore, introduction of a GSK-3β(KD) gene into MCF-7 cells increased their resistance to hormonal-based therapy, while introduction of GSK-3β(A9) gene into MCF-7 cells enhanced their sensitivity to tamoxifen.
MCF-7/GSK-3β(KD) cells have increased sensitivity to rapamycin in comparison to MCF-7/GSK-3β(WT) or MCF-7/GSK-3β(A9) cells
The sensitivity of MCF-7/GSK-3β(WT), MCF-7/GSK-3β(A9), and MCF-7/GSK-3β(KD) cells to rapamycin was assessed by MTT analysis. Cells were grown in the absence or presence of various concentrations of rapamycin ranging from 0.1 nM to 100 nM. The relative growth curves of treated cells as compared with untreated cells are shown in along with corresponding rapamycin IC50 values. MCF-7/GSK-3β(A9) cells experienced the least sensitivity to the inhibitor, with an IC50 value outside of the concentration range tested. An IC50 of approximately 58 nM rapamycin was observed for MCF-7/GSK-3β(WT) cells. The cell line most sensitive to rapamycin treatment was MCF-7/GSK-3β(KD), in which an IC50 of approximately 14 nM was observed. This was 4 times lower than the IC50 observed for GSK-3β(WT) cells (). Therefore, introduction of the GSK-3β(KD) gene into MCF-7 cells increased their resistance to doxorubicin and 4HT, but augmented their sensitivity to the mTORC1 blocker rapamycin.
MCF-7/GSK-3β cell lines responded similarly to the Array MEK inhibitor
The sensitivities of MCF-7/GSK-3β(WT), MCF-7/GSK-3β(A9), and MCF-7/GSK-3β(KD) cells to the Array MEK inhibitor (ARRY 509) were assessed by MTT assays. Cells were either untreated or treated with the MEK inhibitor ranging in concentrations from 10 nM to 10 000 nM. The relative growth curves of treated cells as compared with untreated cells are presented in along with corresponding MEK inhibitor IC50 values. As shown, the 3 cell lines did not vary significantly in their response to the MEK inhibitor. Proliferation maintained a plateau at lower concentrations of the inhibitor, but decreased and approached 50% of relative growth once treated with the highest inhibitor concentration tested. Therefore, altering the GSK-3β activity in MCF-7 cells did not greatly influence their response to the MEK inhibitor. Additional experiments have indicated that this MEK inhibitor inhibited ERK1/2 activation in other cells at concentrations less than 100 nM (data not presented).
Response of MCF-7/GSK-3β(WT) cells to doxorubicin was not altered with either the mTORC1 blocker rapamycin or the MEK inhibitor
The sensitivities of MCF-7/GSK-3β(WT) cells to doxorubicin either alone or in combination with rapamycin or the Array MEK inhibitor were examined by MTT analysis. Cells were grown either alone or in the presence of increasing concentrations of doxorubicin with the addition of either 1 nM rapamycin or 1000 nM Array MEK inhibitor (). The relative growth curves of treated cells as compared with untreated cells are shown in along with corresponding doxorubicin IC50 values. The IC50 was approximately 25 nM for all 3 treatment scenarios. Therefore, these concentrations of rapamycin or the MEK inhibitor did not alter the sensitivity of MCF-7/GSK-3β(WT) cells to doxorubicin. These results are summarized in .
Figure 4. Effects of co-treatment with doxorubicin, 4HT and either a mTORC1 blocker or a MEK inhibitor on drug sensitivity. The effects of a mTORC blocker or a MEK inhibitor on the sensitivity of MCF-7/GSK-3β(WT), MCF-7/GSK-3β(A9), or MCF-7/GSK-3β(KD) cells to doxorubicin or 4HT were examined by MTT analysis after incubation of the cells in the indicated concentrations of the drugs. Symbols: (A and D) MCF-7/GSK-3β(WT), dark blue lines with solid circles, MCF-7/GSK-3β(WT) with 1000 nM MEK inhibitor in light blue lines with upward triangles, MCF-7/GSK-3β(WT) with 1000 1nM mTORC1 inhibitor in black lines with squares. (B and E) MCF-7/GSK-3β(A9), green lines with solid triangles, MCF-7/GSK-3β(A9) with 1000 nM MEK inhibitor in light blue lines with upward triangles, MCF-7/GSK-3β(A9) with 1000 1nM mTORC1 inhibitor in black lines with squares. (C and F) MCF-7/GSK-3β(KD), red lines with solid squares. MCF-7/GSK-3β(KD) with 1000 nM MEK inhibitor in light blue lines with upward triangles, MCF-7/GSK-3β(KD) with 1000 1nM mTORC1 inhibitor in black lines with squares. The arrows represents where 50% inhibition of growth intercepts with the x-axis and is used to estimate the IC50. The single treatment for each cell line are the same as those presented in , as all the experiments in and were performed over the same time period, together. The effects of adding a constant dose of either 1 nM mTORC1 blocker (mTORC BL = rapamycin) or 1000 nM MEK inhibitor (ARRY 509) on the doxorubicin IC50s were examined in (A) MCF-7/GSK-3β(WT), (B) MCF-7/GSK-3β(A9), and (C) MCF-7/GSK-3β(KD) cells. (D, E, and F) The effects of adding a constant dose of either 1 nM mTORC1 blocker (mTORC BL = rapamycin) or 1000 nM MEK inhibitor (ARRY 509) on the 4HT IC50s were examined in (D) MCF-7/GSK-3β(WT), (E) MCF-7/GSK-3β(A9), and (F) MCF-7/GSK-3β(KD) cells. The statistical significance was determined by the unpaired t test. Comparisons determined to be significant are indicated with (***). The P value between the difference between doxorubicin and doxorubicin and MEK inhibitor treated MCF-7/GSK-3β(KD) cells (C) was less than 0.0001. The P value between the difference between 4HT and 4HT and either MEK inhibitor or rapamycin treated MCF-7/GSK-3β(WT) cells (D) was less than 0.0001. The P value between the difference between 4HT and 4HT and either MEK inhibitor or rapamycin treated MCF-7/GSK-3β(A9) cells (E) was less than 0.0001. The P value between the difference between 4HT and 4HT and MEK inhibitor treated MCF-7/GSK-3β(KD) cells (F) was less than 0.0001.
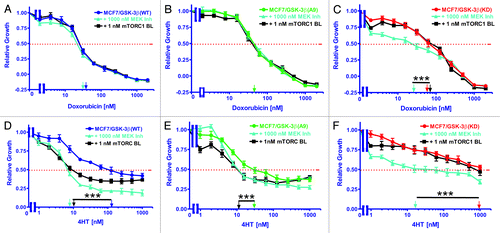
Table 2. Effects of sub-optimal concentrations of mTORC1 blockers and mek inhibitors on sensitivity (IC50) of MCF-7 cells harboring different GSK-3β constructs to chemo-, hormonal, and targeted therapy
Response of MCF-7/GSK-3β(A9) cells to doxorubicin was not altered by either a MEK inhibitor or a mTORC1 blocker
The sensitivity of MCF-7/GSK-3β(A9) cells to doxorubicin either alone or in combination with rapamycin or the Array MEK inhibitor was quantified by MTT assay. Cell proliferation was measured either alone or in the presence of increasing concentrations of doxorubicin with the addition of either 1 nM rapamycin or 1000 nM Array MEK inhibitor. The relative growth curves of treated cells as compared with untreated cells are shown in along with corresponding doxorubicin IC50 values. The doxorubicin IC50 was approximately 44 nM for all 3 treatment types. Therefore, these concentrations of MEK inhibitor or mTORC1 blocker did not render MCF-7/GSK-3β(A9) cells more sensitive to doxorubicin.
Response of MCF-7/GSK-3β(KD) cells to doxorubicin was enhanced by MEK inhibition
The sensitivity of MCF-7/GSK-3β(KD) cells to doxorubicin either alone or in combination with rapamycin or the Array MEK inhibitor was assessed by MTT assay. Cells were either untreated or in the presence of increasing concentrations of doxorubicin with the addition of either 1 nM rapamycin or 1000 nM Array MEK inhibitor. The relative growth curves of treated cells as compared with untreated cells is presented in along with corresponding doxorubicin IC50 values. As shown, the IC50 was around 70 nM in the case of doxorubicin alone or when doxorubicin was combined with this constant concentration of rapamycin. Conversely, the co-treatment of doxorubicin and the Array MEK inhibitor was sufficient to lower the IC50 doxorubicin to 24 nM, a 2.7-fold reduction (). Therefore, the doxorubicin-resistance of MCF-7/GSK-3β(KD) cells was eliminated upon treatment with 1000 nM MEK inhibitor.
Responses of MCF-7/GSK-3β(WT) cells to 4HT was enhanced by the MEK inhibitor and mTORC1 blocker
The sensitivities of MCF-7/GSK-3β(WT) cells to 4HT either alone or in combination with rapamycin or the Array MEK inhibitor were determined with MTT analysis. Cells were grown either alone or in the presence of increasing concentrations of 4HT with the addition of either 1 nM rapamycin or 1000 nM Array MEK inhibitor. The relative growth curves of treated cells as compared with untreated cells are shown in along with corresponding 4HT IC50 values. As shown, the IC50 was approximately 120 nM when the cells were treated with 4HT alone. A considerable reduction in the 4HT IC50 was observed when the cells were co-treated with rapamycin or the Array MEK inhibitor, with IC50 values of approximately 9.5 nM and 7 nM, respectively. This equates to approximately a 15-fold decrease (). Therefore, MCF-7GSK-3β(WT) cells are sensitive to a combination of 4HT and ether MEK or mTORC suppression.
Responses of MCF-7/GSK-3β(A9) cells to 4HT was enhanced by the MEK inhibitor and mTORC1 blocker
The sensitivities of MCF-7/GSK-3β(A9) cells to either 4HT alone or in combination with the mTORC1 blocker rapamycin or the Array MEK inhibitor were analyzed by MTT analysis. Proliferation was measured either alone or in the presence of increasing concentrations of 4HT with the addition of either 1 nM rapamycin or 1000 nM Array MEK inhibitor. The relative growth curves of treated cells as compared with untreated cells are shown in along with corresponding tamoxifen IC50 values. The IC50 for 4HT was 31 nM. The 4HT for IC50 was reduced by approximately 2.5-fold when the cells were co-treated with rapamycin or the Array MEK inhibitor, with IC50 values of 11 nM and 12 nM, respectively (). Therefore, treatment of the MCF-7/GSK-3β(A9) cells with the mTORC1 blocker or the MEK inhibitor increased their sensitivity to 4HT.
Response of MCF-7/GSK-3β(KD) cells to 4HT was enhanced by MEK inhibition
The sensitivities of MCF-7/GSK-3β(KD) cells to 4HT either alone or in combination with rapamycin or the Array MEK inhibitor was quantified by MTT analysis. Cells were grown either alone or in the presence of increasing concentrations of 4HT with the addition of either 1 nM rapamycin or 1000 nM Array MEK inhibitor. The relative growth curves of treated cells as compared with untreated cells are shown in along with corresponding 4HT IC50 values. As shown, the IC50 was not reached when cells were treated with 4HT alone at the concentrations tested, but could be approximated at 2000 nM. When co-treated with rapamycin, the growth curve was similar to that of 4HT alone, but declined to below 50% growth at a concentration of 790 nM 4HT. However, the IC50 of 4HT was reduced by 50-fold when the cells were co-treated the Array MEK inhibitor, in which an IC50 value of approximately 40 nM was observed. Therefore, the MCF-7/GSK-3β(KD) cells were sensitive to the combined 4HT therapy and MEK inhibition, which eliminated their resistance to 4HT, as a similar sensitivity to 4HT was observed as in MCF-7/GSK-3β(WT) cells.
The Raf inhibitor sorafenib reduced the doxorubicin-resistance of MCF-7/GSK-3β(KD) and MCF-7/ΔAkt-1(CA) cells
Like MCF-7/GSK-3β(KD) cells, MCF-7/ΔAkt-1(CA) cells express Akt and are resistant to doxorubicin and sensitive to rapamycin.Citation8,Citation10 To determine if inhibition of Raf would suppress the doxorubicin-resistance of MCF-7/GSK-3β(KD) and MCF-7/ΔAkt-1(CA) cells, their sensitivities to doxorubicin, sorafenib, and the combination of a sub-optimal dose of sorafenib and different does of doxorubicin were examined (). A suboptimal concentration of sorafenib reduced the IC50 for doxorubicin in MCF-7/GSK-3β(KD) and MCF-7/ΔAkt-1(CA) cells, approximately 1.8- and 2.7-fold, respectively (; ). Thus inhibition of Raf suppressed doxorubicin resistance in both MCF-7/GSK-3β(KD) and MCF-7/ΔAkt-1(CA) cells. These studies document the importance of the Raf/MEK/ERK pathway in drug resistance in breast cancer cells with altered Akt-1 and GSK-3β expression.
Figure 5. Ability of Sorafenib to reduce the resistance of MCF-7/GSK-3β(KD) and MCF-7/ΔAkt-1(CA) cells to doxorubicin. (A) Doxorubicin, (B) sorafenib, (C) doxorubicin and 1000 nM sorafenib. The effect of doxorubicin, sorafenib or the combination of doxorubicin plus 1000 nM sorafenib were examined by MTT analysis after incubation of the cells in the indicated concentrations of the drugs. The dotted arrow represents where 50% inhibition of growth intercepts with the x-axis and is used to estimate the IC50. Symbols: MCF-7/GSK-3Δ(KD), red squares with red lines, MCF-7/ΔAkt(CA), black upside down triangles with black lines.
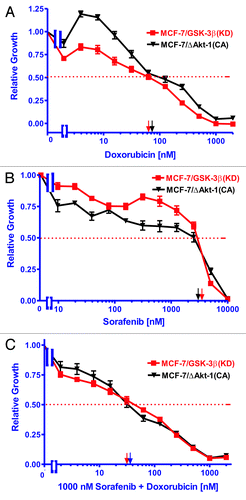
Table 3. Effects of sorafenib on the IC50s of MCF-7/GSK-3β(KD) and MCF-7/ΔAkt-1(CA) cells to doxorubicin
Doxorubicin activates Akt in MCF-7 cells
To examine the activity of proteins upstream and downstream of GSK-3β, western blot analysis was performed on MCF-7, MCF-7/GSK-3β(WT), MCF-7/GSK-3β(A9), and MCF-7/GSK-3β(KD) cells cultured in the absence or presence of 25 nM doxorubicin for 24 h. In these experiments, all the cells were cultured in the presence of FBS. The expression levels of phosphorylated (P) and total (T) Akt, GSK-3β, and p70S6K, and rpS6, and (T) cyclin D1, and (T) ERα were determined by western blot analysis. As shown in , P-Akt was expressed in all 4 cell lines when cultured in FBS in the presence and absence of doxorubicin. The levels of proteins were detected by densitometic scanning. In , the ratios are presented relative to each cell line when treated with doxorubicin in comparison to the untreated cell line, which is set at 1. When control MCF-7 cells were treated with doxorubicin, a nearly 2-fold increase in P-Akt levels occurred (). A slight elevation in active Akt was observed in MCF-7/GSK-3β(WT) cells, while a small decrease was observed in MCF-7/GSK-3β(A9) cells in the presence of doxorubicin. No change was observed in P-Akt levels in MCF-7/GSK-3β(KD) cells when treated as compared with untreated. Therefore, doxorubicin activated Akt in MCF-7 and MCF-7/GSK-3β(WT) cells, but not in MCF-7/GSK-3β(A9) or MCF-7/GSK-3β(KD) cells.
Figure 6. Western blot analysis of PI3K/Akt/GSK-3β and downstream signaling components in cells cultured in the absence and presence of doxorubicin. MCF-7, MCF-7/GSK-3β(WT), MCF-7/GSK-3β(A9), and MCF-7/GSK-3β(KD) cells were cultured for 24 h either in the absence or presence of 25 nM doxorubicin and then the cells were lysed and protein lysates prepared. Proteins were electrophoresed and western blots prepared and probed with the various antibodies. Bands were normalized to the untreated control (MCF-7) through densitometry with ImageJ software (obtained through the National Institutes of Health).
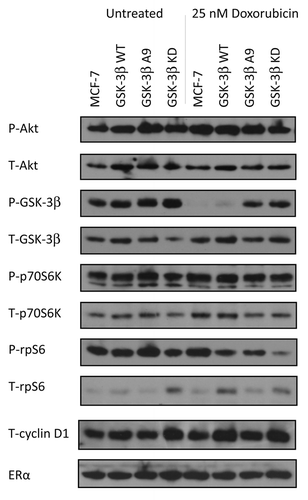
Table 4. Fold difference in levels of proteins detected between doxorubicin treated and untreated cells
Doxorubicin inhibited GSK-3β Phosphorylation at S9 in MCF-7 and MCF-7/GSK-3β(WT) cells
In the absence of doxorubicin, GSK-3β was phosphorylated at S9 in MCF-7, MCF-7/GSK-3β(WT), MCF-7/GSK-3β(A9), and MCF-7/GSK-3β(KD) cells. However, when treated with doxorubicin, no S9 P-GSK-3β was detected in either MCF-7 or MCF-7/GSK-3β(WT) cells, but it was detected in MCF-7/GSK-3β(A9) or MCF-7/GSK-3β(KD) cells. Therefore, when GSK-3β was WT in MCF-7 and MCF-7/GSK-3β(WT) cells, doxorubicin treatment prevented the S9 phosphorylation of GSK-3β, and GSK-3 β is presumably active even in the presence of activated Akt. In contrast, upon doxorubicin treatment of MCF-7/GSK-3β(A9) and MCF-7/GSK-3β(KD) cells, P-S9-GSK-3β was present and presumably GSK-3β remained inactive. The levels of P-GSK-3β decreased greater than 50-fold in MCF-7 and MCF-7/GSK-3β(WT) cells upon doxorubicin treatment. In contrast, the levels of P-GSK-3β decreased in MCF-7/GSK-3β(A9) and MCF-7/GSK-3β(KD) cells decreased approximately 1.3-fold after doxorubicin treatment.
Doxorubicin increased p70S6K levels in MCF-7 cells, but not in MCF-7/GSK-3β(A9) cells
As observed with P-Akt, P-p70S6K was expressed in all 4 cell lines when they were cultured in 10% FBS in the absence or presence of doxorubicin, (). When treated with doxorubicin, the levels of P-p70S6K were 1.5-fold elevated in MCF-7 cells, but remained the same or decreased slightly in MCF-7/GSK-3β(WT), MCF-7/GSK-3β(A9), and MCF-7/GSK-3β(KD) cells.
Doxorubicin increased p-rS6 in MCF-7 cells, but not in MCF-7/GSK-3β(A9) cells
In the absence of doxorubicin, phosphorylated ribosomal rpS6 protein (P-rS6) were detected in MCF-7, MCF-7/GSK-3β(WT), MCF-7/GSK-3β(A9), and MCF-7/GSK-3β(KD) cells. After doxorubicin treatment, a 1.3-fold increase in P-rpS6 was detected in MCF-7 cells. In MCF-7/GSK-3β(WT) and MCF-7/GSK-3β(A9) cells, 1.5- and 2.1-fold decreases in P-rpS6 levels were detected respectively. In contrast, a significant drop in the levels of P-rpS6 (approximately 5-fold) was detected in the doxorubicin-treated MCF-7/GSK-3β(KD) cells. The levels of total cyclin D1 and ERα were relatively constant among the cell line in the presence and absence of doxorubicin. Thus doxorubicin significantly decreased the levels of P-rpS6 detected in MCF-7/GSK-3β(KD) cells.
Discussion
Our studies demonstrate that GSK-3β plays important roles in MCF-7 cell clonogenicity, drug resistance, and cell signaling. When GSK-3β(KD) was introduced into MCF-7 cells, a significant increase in anchorage-dependent colony formation in the presence of doxorubicin was observed compared with MCF-7 cells containing either GSK-3β(WT) or GSK-3β(A9). Furthermore, MCF-7/GSK-3β(KD) cells had higher cloning efficiencies in soft agar both in the presence and absence of doxorubicin than either MCF-7/GSK-3β(WT) or MCF-7/GSK-3β(A9) cells. Interestingly, MCF-7/GSK-3β(A9) formed less colonies in soft agar than either MCF-7/GSK-3β(WT) or MCF-7/GSK-3β(KD). The GSK-3β(A9) gene suppressed colony formation in soft agar, while the GSK-3β(KD) gene increased cloning efficiency in soft agar. Colony formation in soft agar is often used as a preliminary measure of malignant transformation.Citation60,Citation61 It is likely that the GSK-3β(KD) gene increases the malignant potential of MCF-7 cells, while the constitutively-active GSK-3β(A9) gene suppresses the malignant potential of the MCF-7 cells. Furthermore, the MCF-7/GSK-3β(KD) cells were more resistant to doxorubicin and formed more colonies in soft agar than either the MCF-7/GSK-3β(WT) or MCF-7/GSK-3β(A9) cells.
Drug sensitivity assays revealed that resistance to doxorubicin and 4HT was greatly increased in MCF-7/GSK-3β(KD) cells as compared with MCF-7/GSK-3β(WT) cells. However, drug-resistant MCF-7/GSK-3β(KD) cells were more sensitive to mTOR inhibition by rapamycin. Additionally, a combination treatment of the Array MEK inhibitor and either doxorubicin or tamoxifen was found to have a positive interaction capable of alleviating drug resistance in MCF-7/GSK-3β(KD) cells. These results strongly suggest that altered GSK-3β activity influences breast cancer proliferation, colony formation in soft agar, and responses to chemo- and hormonal-based therapies. The loss of normal GSK-3β kinase activity may confer a survival advantage by allowing the expression of proteins involved in cell cycle progression, prevention of apoptosis, and anchorage-independence. These results are similar to those found for squamous cell and basal cell carcinomas, in which expression of GSK-3β(KD) enhanced anchorage-independent growth and tumorigenicity.Citation62
The roles of GSK-3β in PI3K/Akt signaling were examined. Given that GSK-3β is negatively regulated by Akt and p70S6K, it was thought that GSK-3β would be phosphorylated and inactivated in the presence of phosphorylated Akt and p70S6K. In all the MCF-7 and various GSK-3β-transfected cells grown in the presence of FBS, Akt (S473), p70S6K (T389), and rpS6 (S235/236) were phosphorylated, and GSK-3β was phosphorylated at S9. Doxorubicin treatment was shown to activate Akt in MCF-7 control and MCF-7/GSK-3β(WT) cells. However, doxorubicin treatment resulted in the absence of S9-phosporylated GSK-3β in MCF-7 and MCF-7/GSK-3β but not in MCF-7/GSK-3β(KD) or MCF-7/GSK-3β(A9) cells, both of which were more resistant to doxorubicin than the MCF-7/GSK-3β(WT) cells ( and ). Thus doxorubicin treatment activated GSK-3β in MCF-7 and MCF-7/GSK-3β(WT) cells, while GSK-3β remained phosphorylated and inactive in MCF-7/GSK-3β(A9) and MCF-7/GSK-3β(KD) cells. The introduced GSK-3β A9 and KD genes may block the dephosphorylation of GSK-3β at S9 after doxorubicin treatment or block a phosphatase induced by doxorubicin, which normally removes the phosphate on GSK-3β at S9.
Interesting results were observed in terms of phosphorylation at rpS6 (S235/S236). rpS6 is an important downstream target of p70S6K. Phosphorylation of rpS6 enhances protein translation, especially of proteins difficult to translate because of their mRNA structures.Citation11,Citation12,Citation14,Citation15 The levels of P-rpS6 detected decreased significantly in the MCF-7/GSK-3β(KD) cells upon doxorubicin treatment. This result may indicate a complex interplay between GSK-3β and P-rpS6 phosphorylation. It has been reported that GSK-3β can be positively and negatively involved in the phosphorylation and activation/inactivation of p70S6K and 4E-BP1, respectively.Citation17-Citation19 Moreover, inhibition of GSK-3β suppresses rpS6 phosphorylation.Citation17 In the presence of doxorubicin, this interaction may be enhanced by the GSK-3β(KD) and, hence, lower levels of P-rpS6 detected due to low levels of active GSK-3β. In contrast, total rpS6 protein was detected in these cells.
Interestingly, the MCF-7/GSK-3β(KD) cells were hypersensitive to rapamycin in comparison with either MCF-7/GSK-3β(WT) or MCF-7/GSK-3β(A9) cells. MCF-7/GSK-3β(A9) cells were hyper-resistant to rapamycin. MCF-7/GSK-3β(A9) cells may have increased activation of p70S6K and elevated inhibition of 4E-BP1, which could compensate for inhibition of mTORC1. In contrast, MCF-7/GSK-3β(KD) cells could have decreased activation of p70S6K and rpS6 and decreased inhibition of 4E-BP1, which resulted in their sensitivity to rapamycin. Rapamycin did not relieve the doxorubicin or 4HT resistance of MCF-7/GSK-3β(KD) cells. GSK-3β(KD) may prevent GSK-3β regulation of TSC2, which normally would inhibit mTORC1. In the presence of rapamycin, mTORC1 is essentially blocked at 2 levels, which may result in hypersensitivity. In contrast, rapamycin sensitized both MCF-7/GSK-3β(WT) or MCF-7/GSK-3β(A9) cells to doxorubicin and 4HT. These results suggest complex interactions between GSK-3β(KD) and TSC2, mTORC1, p70S6K, 4E-BP1, and rpS6, which may be important in sensitivity to various therapeutic approaches.
Doxorubicin treatment resulted in increased phosphorylation of Akt and a total loss of S9-phosphorylated GSK-3β (). Simultaneous Akt and GSK-3β activity has also been demonstrated in pancreatic and colon cancer cell lines, showing that increased Akt expression does not always correlate with decreased GSK-3β.Citation63,Citation64 Given that GSK-3β regulation is complex and multi-factorial, there may be many alternate routes of GSK-3β inactivation that are independent of Akt.Citation21 Active GSK-3β plays roles in the Wnt/β-catenin pathway by participating in the formation of the β-catenin destruction complex as well as in the phosphorylation of Axin, which results in the stabilization of Axin. This sequesteration within a protein complex would prevent Akt from accessing and phosphorylating GSK-3β. Therefore, there may be different cellular pools of GSK-3β that are under separate regulation by Wnt and Akt, in which the activation of one does not affect the other.Citation21
Given that certain pools of GSK-3β may remain active in cancer, the cellular localization of these pools may also be a factor involved in their regulation. GSK-3β is predominantly found to be active in the cytoplasm, but it can also translocate to the nucleus. The nuclear activities of GSK-3β may seemingly conflict with its cytosolic roles, and aberrant nuclear accumulation of GSK-3β has been found in other forms of cancer.Citation64 A nuclear localization signal (NLS) is present in the basic domain of GSK-3β.Citation65 Therefore, modifications that unmask the NLS and allow for increased translocation of GSK-3β to the nucleus may be involved with cancer progression.
In conclusion, our results demonstrate that GSK-3β plays important roles in breast cancer. Loss of normal GSK-3β kinase activity, whether through Akt or other regulatory mechanisms, can drastically increase the clonogenicity and drug resistance of MCF-7 cells. However, this may confer an Achilles’ heel by sensitizing these cells to targeted therapy with pathway inhibitors. By blocking signaling at various points, MEK and mTORC1 inhibitors may potentiate the effects of chemo- and hormonal therapy, thereby presenting an attractive treatment route for overcoming drug resistance and limiting side effects. As breast cancer therapy moves toward targeted, individually tailored approaches, the unique mutations and biochemical abnormalities of protein kinases such as GSK-3β in patient’s tumors could serve as valuable markers.
Materials and Methods
Cell culture
MCF-7 cells were derived from a human breast adenocarcinoma.Citation66 MCF-7 cells have an epithelial morphology, are adherent, and form a monolayer in culture. MCF-7 cells were obtained from the American Type Culture Collection (ATCC). Cell culture medium for MCF-7 cells consisted of 10% (v/v) heat-inactivated fetal bovine serum (FBS) (CellGrow-Mediatech), 2 mM L-glutamine (Invitrogen), 100 μg/ml streptomycin (Invitrogen), and 100 units/L penicillin G (Invitrogen) in Roswell Park Memorial Institute-1640 (RPMI 1640) medium (Invitrogen).
GSK-3β (WT), GSK-3β (A9), and GSK-3β (KD) plasmids
Plasmid encoding GSK-3β(WT), GSK-3β(A9), and GSK-3β(KD)Citation58,Citation59 were generously provided by Dr James Woodgett (University of Toronto, Canada). GSK-3β(A9) differs from WT in that an alanine has been substituted for serine at residue 9, thereby rendering it constitutively active. GSK-3β(KD) differs from WT through a substitution of methionine and alanine for lysine at positions 85 and 86, respectively.
Transfection of MCF-7 cells with GSK-3β constructs
Five × 105 MCF-7 cells were plated into 6-well cell culture plates (BD Biosciences), 1 day prior to transfection. On the day of the transfection, cells were rinsed with Opti-MEM medium (Invitrogen) to remove FBS. Cells were transfected with 10 μg of the different GSK-3β DNAs with Lipofectin (Invitrogen) as described by the manufacturer. Forty-eight h after transfection, selection medium (RPMI + 10% FBS + 2 mg/ml G418 [Geneticin]) (Invitrogen) was added to isolate stably transfected cells. Cells were provided with fresh selection medium every 3 d. Mock transfections were performed by replacing DNA with 10 μl of Tris-EDTA buffer and did not generate viable colonies in the presence of selection medium.
Cell proliferation in the presence of drugs and inhibitors (MTT analysis)
MCF-7/GSK-3β(WT), MCF-7/GSK-3β(A9), and MCF-7/GSK-3β(KD) cells were seeded in 96-well cell culture plates (BD Biosciences) at a density of 5000 cells/well in 100 μl of phenol red free RPMI-1640 containing 5% charcoal stripped FBS. Cell culture plates were incubated for 1 day to permit cells to adhere to the bottom of each well. Treatment medium was prepared by performing ten 2-fold serial dilutions to create a range of 11 concentrations of doxorubicin (1.95–2000 nM) (Sigma), tamoxifen (0.98–1000 nM) (Sigma), rapamycin (mTOR Inhibitor) (0.098–100 nM) (EMD Biosciences), and Array MEK inhibitor (9.77–10 000 nM). The Array MEK inhibitor was generously provided by Array BioPharma Inc. Combination treatments consisting of doxorubicin or tamoxifen coupled with rapamycin or Array MEK were created by adding 1 nM of rapamycin or 1000 nM of Array MEK to the serially diluted concentrations of doxorubicin or tamoxifen described above. One hundred µL of drug medium was added to each treatment well the day after cells were initially seeded, while the last well received non-treatment medium as a control. After 72 h of treatment (4 d after seeding), the amount of 3-(4,5-dimethylthiazol-2-yl)-2,5-diphenyl-2H-tetrazolium bromide (MTT) (Sigma) reduction in each well was quantified by dissolving the formazan crystals in 200 μl of dimethyl sulfoxide (DMSO) and reading the absorbance at 570 nM with a FL600 microplate fluorescence reader (Bio-Tek Instruments). Control plates were read on day 1 and day 4 after seeding to provide a base line for cell growth. The mean and corresponding standard deviation of normalized adjusted absorbance was calculated from 8 replicate wells for each drug concentration. The inhibitory concentration of 50% (IC50) is defined in this context as the concentration of the drug that causes MCF-7 cells to proliferate at a rate that is half as rapid as cells incubated in the absence of the drug.
Colony-formation assays
MCF-7/GSK-3β(WT), MCF-7/GSK-3β(A9), and MCF-7/GSK-3β(KD) cells were collected and seeded in 6-well cell culture plates at a density of 1000 cells/well (3 replicate wells for each condition). Cell culture plates were incubated for one day to permit cells to adhere to the bottom of each well. Twenty-four hours after seeding, plates were then treated with 25 nM doxorubicin-containing media or media without the drug and incubated for 3 wk at 37 °C. Cells were provided with fresh treatment-containing media every 4 d. Cells were rinsed with PBS at the end of the 3 wk treatment period. Rinsed cells were then fixed in 100% (v/v) methanol (Sigma) for 10 min at room temperature then dried for 10 min at room temperature. Fixed cells were incubated in Giemsa stain (Sigma) for 5 min at room temperature. Stained cells were rinsed with water then dried. Colonies consisted of at least 50 cells, and the number of colonies present in each well was counted. The mean number of colonies and corresponding standard deviation was calculated from 3 replicate wells for each condition. Statistical significance was calculated using the GraphPad QuickCalcs software using an unpaired t test with a 95% confidence interval.
Clonogenicity in soft agar
1.6% low melting point (LMP) agarose was prepared in deionized H20, heated, and cooled. An equal part of agarose was mixed with 2× complete Dulbecco Modified Eagle Medium (cDMEM). 2.5 ml of this solution was plated per well in 6-well plates (BD Biosciences) and allowed to solidify at room temperature for at least 30 min. This formed the bottom layer of soft agar. The top agar layer was formed by preparing 0.8% LMP agarose in deionized H20. MCF-7/GSK-3β(WT), MCF-7/GSK-3β(A9), and MCF-7/GSK-3β(KD) cells were harvested, dissociated, and resuspended at 1.1 × 10⁴ cells/ml in 2× cDMEM. Equal parts of 0.8% agarose and cell-containing media were mixed, and 3.5 ml of this solution was carefully applied over the bottom layer of agarose. Once solidified at room temperature, plates were incubated at 37 °C for 3 wk with an application of 0.1 ml of fresh media occurring every 4 d. At the end of 3 wk, the agarose was stained with crystal violet (Sigma) for 1 h. Colonies were counted using a dissecting microscope and the mean and standard deviation was calculated based on 3 replicate wells for each condition.
Protein lysates
MCF-7/GSK-3β(WT), MCF-7/GSK-3β(A9), and MCF-7/GSK-3β(KD) cells were collected after trypsination and plated in 100-mm tissue culture plates in RPMI + 10% FBS for 24 h to allow for attachment. Fresh media with or without 25 nM doxorubicin was then added to the plates, and a 24 h treatment was performed. Cells were lysed in ice-cold Gold Lysis Buffer (GLB) [20 mM Tris (pH 7.9), 137 mM NaCl, 5 mM Na2EDTA, 10% (v/v) Triton X-100, 1 mM phenylmethylsulfonyl fluoride, 1 mM aprotinin, 1 mM leupeptin, 1 mM sodium orthovanadate, 1 mM EGTA, 10 mM sodium fluoride, 1 mM tetrasodium PPi, and 100 mM b-glycerophosphate]. Samples were spun, supernatants collected, and protein concentrations were quantified with BCA protein reagent (50:1 v/v) (Pierce) at an absorbency of 570 nm. Next, 10 μl of loading dye was added, and samples were boiled for 3 min.
Western blot analysis
Ten μl of each sample was loaded into 10% SDS-PAGE separating and stacking gels. The separating gel (10% [w/v] of 37.5:1 [w/w] acrylamide:bisacrylamide, 1.5 M TRIS [pH 8.8], 10% [w/v] ammonium persulfate [APS], 10% sodium dodecylsulfate [SDS], and TEMED) comprised the lower 75% of a gel cassette (Invitrogen) and the stacking gel (4% [w/v] acrylamide, 1.0 M TRIS (pH 6.8), 10% [w/v] APS, 10% SDS, and TEMED) formed the upper 25% of the cassette.
The samples were then separated by electrophoresis in running buffer (200 mM glycine, 25 mM TRIS, and 1 mg/ml [10%] SDS) for approximately 2 h alongside a protein ladder (Amersham Biosciences). Before transfer, membranes were briefly soaked in methanol and then placed in transfer buffer. Proteins were then transferred from gels to PVDF membranes (Pierce) by semi-dry electro-transfer for 3 h in transfer buffer (200 mM glycine, 25 mM TRIS and 20% methanol) with a transfer apparatus (Bio-Rad). After transfer, the membranes were placed in blocking solution (10 µg/ml BSA in 137 mM NaCl, 20 mM TRIS, 1 g sodium azide, and 0.5% [v/v] Tween 20 [1× TBST]) overnight at 4 °C while rocking.
Western blots were performed with antibodies specific for phospho (P) and total Akt (P = S473), GSK-3β (P = S9), p70S6K (P = T389), rpS6 (P = S235/236), total cyclin D1, and total ERα (Cell Signaling). Cyclin D1 and ERα served as loading controls. After blocking, the membranes were incubated overnight at 4 °C in primary antibody solution (1:1000 [v/v] primary antibody and 10 mg/ml BSA in 1× TBST). The membranes were then washed 3 times for 10 min each in 1× TBST to remove any residual primary antibody. Membranes were incubated for 1 h on a shaker at room temperature in secondary antibody solution (1:5000 [v/v] secondary antibody in 1× TBST). Following incubation, the membranes were washed 2× for 10 min in 1× TBST to remove residual antibody solution. Membranes were then incubated at room temperature for 1 min in ECL Western Blotting Detection Substrate (1:1 v/v) (Pierce). Membranes were then developed in film cassettes on X-ray film (Research Products International) to visualize detected protein bands within sample lanes. Bands were normalized to the untreated control through densitometry with ImageJ software (obtained through the National Institutes of Health).
Disclosure of Potential Conflicts of Interest
There are no potential conflicts of interest.
Acknowledgments
We thank Dr James Woodgett for generously providing the wild-type (WT), constitutively-activated (A9), and kinase dead (KD) forms of GSK-3β. We thank the Array BioPharma Company for generously providing the ARRY509 MEK inhibitors.
Related Research Data
References
- Embi N, Rylatt DB, Cohen P. Glycogen synthase kinase-3 from rabbit skeletal muscle. Separation from cyclic-AMP-dependent protein kinase and phosphorylase kinase. Eur J Biochem 1980; 107:519 - 27; http://dx.doi.org/10.1111/j.1432-1033.1980.tb06059.x; PMID: 6249596
- Woodgett JR. Molecular cloning and expression of glycogen synthase kinase-3/factor A. EMBO J 1990; 9:2431 - 8; PMID: 2164470
- Fang X, Yu SX, Lu Y, Bast RC Jr., Woodgett JR, Mills GB. Phosphorylation and inactivation of glycogen synthase kinase 3 by protein kinase A. Proc Natl Acad Sci U S A 2000; 97:11960 - 5; http://dx.doi.org/10.1073/pnas.220413597; PMID: 11035810
- Cross DA, Alessi DR, Cohen P, Andjelkovich M, Hemmings BA. Inhibition of glycogen synthase kinase-3 by insulin mediated by protein kinase B. Nature 1995; 378:785 - 9; http://dx.doi.org/10.1038/378785a0; PMID: 8524413
- Stambolic V, Woodgett JR. Mitogen inactivation of glycogen synthase kinase-3 beta in intact cells via serine 9 phosphorylation. Biochem J 1994; 303:701 - 4; PMID: 7980435
- Sutherland C, Leighton IA, Cohen P. Inactivation of glycogen synthase kinase-3 beta by phosphorylation: new kinase connections in insulin and growth-factor signalling. Biochem J 1993; 296:15 - 9; PMID: 8250835
- Kockeritz L, Doble B, Patel S, Woodgett JR. Glycogen synthase kinase-3--an overview of an over-achieving protein kinase. Curr Drug Targets 2006; 7:1377 - 88; http://dx.doi.org/10.2174/1389450110607011377; PMID: 17100578
- Sokolosky ML, Stadelman KM, Chappell WH, Abrams SL, Martelli AM, Stivala F, Libra M, Nicoletti F, Drobot LB, Franklin RA, et al. Involvement of Akt-1 and mTOR in sensitivity of breast cancer to targeted therapy. Oncotarget 2011; 2:538 - 50; PMID: 21730367
- Taylor JR, Lehmann BD, Chappell WH, Abrams SL, Steelman LS, McCubrey JA. Cooperative effects of Akt-1 and Raf-1 on the induction of cellular senescence in doxorubicin or tamoxifen treated breast cancer cells. Oncotarget 2011; 2:610 - 26; PMID: 21881167
- Steelman LS, Navolanic P, Chappell WH, Abrams SL, Wong EW, Martelli AM, Cocco L, Stivala F, Libra M, Nicoletti F, et al. Involvement of Akt and mTOR in chemotherapeutic- and hormonal-based drug resistance and response to radiation in breast cancer cells. Cell Cycle 2011; 10:3003 - 15; http://dx.doi.org/10.4161/cc.10.17.17119; PMID: 21869603
- Martelli AM, Evangelisti C, Chappell W, Abrams SL, Bäsecke J, Stivala F, Donia M, Fagone P, Nicoletti F, Libra M, et al. Targeting the translational apparatus to improve leukemia therapy: roles of the PI3K/PTEN/Akt/mTOR pathway. Leukemia 2011; 25:1064 - 79; http://dx.doi.org/10.1038/leu.2011.46; PMID: 21436840
- Steelman LS, Chappell WH, Abrams SL, Kempf RC, Long J, Laidler P, Mijatovic S, Maksimovic-Ivanic D, Stivala F, Mazzarino MC, et al. Roles of the Raf/MEK/ERK and PI3K/PTEN/Akt/mTOR pathways in controlling growth and sensitivity to therapy-implications for cancer and aging. Aging (Albany NY) 2011; 3:192 - 222; PMID: 21422497
- Hart JR, Vogt PK. Phosphorylation of AKT: a mutational analysis. Oncotarget 2011; 2:467 - 76; PMID: 21670491
- McCubrey JA, Steelman LS, Chappell WH, Abrams SL, Montalto G, Cervello M, Nicoletti F, Fagone P, Malaponte G, Mazzarino MC, et al. Mutations and deregulation of Ras/Raf/MEK/ERK and PI3K/PTEN/Akt/mTOR cascades which alter therapy response. Oncotarget 2012; 3:954 - 87; PMID: 23006971
- McCubrey JA, Steelman LS, Chappell WH, Abrams SL, Franklin RA, Montalto G, Cervello M, Libra M, Candido S, Malaponte G, et al. Ras/Raf/MEK/ERK and PI3K/PTEN/Akt/mTOR cascade inhibitors: how mutations can result in therapy resistance and how to overcome resistance. Oncotarget 2012; 3:1068 - 111; PMID: 23085539
- Garrett JT, Chakrabarty A, Arteaga CL. Will PI3K pathway inhibitors be effective as single agents in patients with cancer?. Oncotarget 2011; 2:1314 - 21; PMID: 22248929
- Shin S, Wolgamott L, Yu Y, Blenis J, Yoon SO. Glycogen synthase kinase (GSK)-3 promotes p70 ribosomal protein S6 kinase (p70S6K) activity and cell proliferation. Proc Natl Acad Sci U S A 2011; 108:E1204 - 13; http://dx.doi.org/10.1073/pnas.1110195108; PMID: 22065737
- Shin S, Wolgamott L, Yoon SO. Glycogen synthase kinase (GSK)-3 and mammalian target of rapamycin complex 1 (mTORC1) cooperate to regulate protein S6 kinase 1 (S6K1). Cell Cycle 2012; 11:1053 - 4; http://dx.doi.org/10.4161/cc.11.6.19784; PMID: 22391205
- Shin S, Wolgamott L, Tcherkezian J, Vallabhapurapu S, Yu Y, Roux PP, Yoon SO. Glycogen synthase kinase-3β positively regulates protein synthesis and cell proliferation through the regulation of translation initiation factor 4E-binding protein 1. Oncogene 2013; •••; http://dx.doi.org/10.1038/onc.2013.113; PMID: 23584478
- Wang H, Brown J, Gu Z, Garcia CA, Liang R, Alard P, Beurel E, Jope RS, Greenway T, Martin M. Convergence of the mammalian target of rapamycin complex 1- and glycogen synthase kinase 3-β-signaling pathways regulates the innate inflammatory response. J Immunol 2011; 186:5217 - 26; http://dx.doi.org/10.4049/jimmunol.1002513; PMID: 21422248
- McCubrey JA, Steelman LS, Bertrand FE, Davis NM, Abrams SL, Montalto G, D’Assoro AB, Libra M, Nicoletti F, Maestro R, et al. Multifaceted roles of GSK-3 and Wnt/β-catenin in hematopoiesis and leukemogenesis: opportunities for therapeutic intervention. Leukemia 2014; 28:15 - 33; http://dx.doi.org/10.1038/leu.2013.184; PMID: 23778311
- Fu Y, Hu D, Qiu J, Xie X, Ye F, Lu WG. Overexpression of glycogen synthase kinase-3 in ovarian carcinoma cells with acquired paclitaxel resistance. Int J Gynecol Cancer 2011; 21:439 - 44; http://dx.doi.org/10.1097/IGC.0b013e31820d7366; PMID: 21436692
- Kawazoe H, Bilim VN, Ugolkov AV, Yuuki K, Naito S, Nagaoka A, Kato T, Tomita Y. GSK-3 inhibition in vitro and in vivo enhances antitumor effect of sorafenib in renal cell carcinoma (RCC). Biochem Biophys Res Commun 2012; 423:490 - 5; http://dx.doi.org/10.1016/j.bbrc.2012.05.147; PMID: 22683636
- Thamilselvan V, Menon M, Thamilselvan S. Anticancer efficacy of deguelin in human prostate cancer cells targeting glycogen synthase kinase-3 β/β-catenin pathway. Int J Cancer 2011; 129:2916 - 27; http://dx.doi.org/10.1002/ijc.25949; PMID: 21472727
- Luo J. Glycogen synthase kinase 3beta (GSK3beta) in tumorigenesis and cancer chemotherapy. Cancer Lett 2009; 273:194 - 200; http://dx.doi.org/10.1016/j.canlet.2008.05.045; PMID: 18606491
- Shakoori A, Ougolkov A, Yu ZW, Zhang B, Modarressi MH, Billadeau DD, Mai M, Takahashi Y, Minamoto T. Deregulated GSK3beta activity in colorectal cancer: its association with tumor cell survival and proliferation. Biochem Biophys Res Commun 2005; 334:1365 - 73; http://dx.doi.org/10.1016/j.bbrc.2005.07.041; PMID: 16043125
- Ougolkov AV, Fernandez-Zapico ME, Savoy DN, Urrutia RA, Billadeau DD. Glycogen synthase kinase-3beta participates in nuclear factor kappaB-mediated gene transcription and cell survival in pancreatic cancer cells. Cancer Res 2005; 65:2076 - 81; http://dx.doi.org/10.1158/0008-5472.CAN-04-3642; PMID: 15781615
- Zhou W, Wang L, Gou SM, Wang TL, Zhang M, Liu T, Wang CY. ShRNA silencing glycogen synthase kinase-3 beta inhibits tumor growth and angiogenesis in pancreatic cancer. Cancer Lett 2012; 316:178 - 86; http://dx.doi.org/10.1016/j.canlet.2011.10.033; PMID: 22100174
- Panka DJ, Cho DC, Atkins MB, Mier JW. GSK-3beta inhibition enhances sorafenib-induced apoptosis in melanoma cell lines. J Biol Chem 2008; 283:726 - 32; http://dx.doi.org/10.1074/jbc.M705343200; PMID: 17991738
- Martinez-Outschoorn UE, Balliet R, Lin Z, Whitaker-Menezes D, Birbe RC, Bombonati A, Pavlides S, Lamb R, Sneddon S, Howell A, et al. BRCA1 mutations drive oxidative stress and glycolysis in the tumor microenvironment: implications for breast cancer prevention with antioxidant therapies. Cell Cycle 2012; 11:4402 - 13; http://dx.doi.org/10.4161/cc.22776; PMID: 23172369
- Shimizu Y, Mullins N, Blanchard Z, Elshamy WM. BRCA1/p220 loss triggers BRCA1-IRIS overexpression via mRNA stabilization in breast cancer cells. Oncotarget 2012; 3:299 - 313; PMID: 22431556
- Chang S, Sharan SK. Epigenetic control of an oncogenic microRNA, miR-155, by BRCA1. Oncotarget 2012; 3:5 - 6; PMID: 22403740
- Almeida MI, Reis RM, Calin GA. BRCA1, microRNAs and cancer predisposition: challenging the dogma. Cell Cycle 2011; 10:377; http://dx.doi.org/10.4161/cc.10.3.14738; PMID: 21270524
- Pelletier C, Speed WC, Paranjape T, Keane K, Blitzblau R, Hollestelle A, Safavi K, van den Ouweland A, Zelterman D, Slack FJ, et al. Rare BRCA1 haplotypes including 3’UTR SNPs associated with breast cancer risk. Cell Cycle 2011; 10:90 - 9; http://dx.doi.org/10.4161/cc.10.1.14359; PMID: 21191178
- Adams JR, Schachter NF, Liu JC, Zacksenhaus E, Egan SE. Elevated PI3K signaling drives multiple breast cancer subtypes. Oncotarget 2011; 2:435 - 47; PMID: 21646685
- Azmi AS, Banerjee S, Ali S, Wang Z, Bao B, Beck FW, Maitah M, Choi M, Shields TF, Philip PA, et al. Network modeling of MDM2 inhibitor-oxaliplatin combination reveals biological synergy in wt-p53 solid tumors. Oncotarget 2011; 2:378 - 92; PMID: 21623005
- Knappskog S, Lønning PE. MDM2 promoter SNP285 and SNP309; phylogeny and impact on cancer risk. Oncotarget 2011; 2:251 - 8; PMID: 21436469
- Bazarov AV, Lee WJ, Bazarov I, Bosire M, Hines WC, Stankovich B, Chicas A, Lowe SW, Yaswen P. The specific role of pRb in p16 (INK4A) -mediated arrest of normal and malignant human breast cells. Cell Cycle 2012; 11:1008 - 13; http://dx.doi.org/10.4161/cc.11.5.19492; PMID: 22333593
- Jiang Z, Jones R, Liu JC, Deng T, Robinson T, Chung PE, Wang S, Herschkowitz JI, Egan SE, Perou CM, et al. RB1 and p53 at the crossroad of EMT and triple-negative breast cancer. [Review] Cell Cycle 2011; 10:1563 - 70; http://dx.doi.org/10.4161/cc.10.10.15703; PMID: 21502814
- Puca R, Nardinocchi L, Porru M, Simon AJ, Rechavi G, Leonetti C, Givol D, D’Orazi G. Restoring p53 active conformation by zinc increases the response of mutant p53 tumor cells to anticancer drugs. Cell Cycle 2011; 10:1679 - 89; http://dx.doi.org/10.4161/cc.10.10.15642; PMID: 21508668
- Steelman LS, Navolanic PM, Sokolosky ML, Taylor JR, Lehmann BD, Chappell WH, Abrams SL, Wong EW, Stadelman KM, Terrian DM, et al. Suppression of PTEN function increases breast cancer chemotherapeutic drug resistance while conferring sensitivity to mTOR inhibitors. Oncogene 2008; 27:4086 - 95; http://dx.doi.org/10.1038/onc.2008.49; PMID: 18332865
- Navolanic PM, McCubrey JA. Pharmacological breast cancer therapy (review). [review] Int J Oncol 2005; 27:1341 - 4; PMID: 16211230
- Marotta LL, Polyak K. Unraveling the complexity of basal-like breast cancer. Oncotarget 2011; 2:588 - 9; PMID: 21876228
- Borgna S, Armellin M, di Gennaro A, Maestro R, Santarosa M. Mesenchymal traits are selected along with stem features in breast cancer cells grown as mammospheres. Cell Cycle 2012; 11:4242 - 51; http://dx.doi.org/10.4161/cc.22543; PMID: 23095640
- Witkiewicz AK, Knudsen ES. RB pathway and therapeutic sensitivity: new insights in breast cancer and Tamoxifen therapy. Cell Cycle 2011; 10:1525; http://dx.doi.org/10.4161/cc.10.10.15521; PMID: 21502809
- Lehn S, Fernö M, Jirström K, Rydén L, Landberg G. A non-functional retinoblastoma tumor suppressor (RB) pathway in premenopausal breast cancer is associated with resistance to tamoxifen. Cell Cycle 2011; 10:956 - 62; http://dx.doi.org/10.4161/cc.10.6.15074; PMID: 21358261
- Chappell WH, Abrams SL, Montalto G, Cervello M, Martelli AM, Candido S, Libra M, Polesel J, Talamini R, Arlinghaus R, et al. Effects of ectopic expression of NGAL on doxorubicin sensitivity. Oncotarget 2012; 3:1236 - 45; PMID: 23100449
- Chappell WH, Abrams SL, Franklin RA, LaHair MM, Montalto G, Cervello M, Martelli AM, Nicoletti F, Candido S, Libra M, et al. Ectopic NGAL expression can alter sensitivity of breast cancer cells to EGFR, Bcl-2, CaM-K inhibitors and the plant natural product berberine. Cell Cycle 2012; 11:4447 - 61; http://dx.doi.org/10.4161/cc.22786; PMID: 23159854
- Chappell WH, Abrams SL, Stadelman KM, LaHair MM, Franklin RA, Cocco L, Evangelisti C, Chiarini F, Martelli AM, Steelman LS, et al. Increased NGAL (Lnc2) expression after chemotherapeutic drug treatment. Adv Biol Regul 2013; 53:146 - 55; http://dx.doi.org/10.1016/j.jbior.2012.09.004; PMID: 23073564
- Anand A, Anand A. Paclitaxel in doxorubicin-resistant metastatic breast cancer patients. J Natl Cancer Inst 1995; 87:1642; http://dx.doi.org/10.1093/jnci/87.21.1642; PMID: 7563210
- Prasad CP, Rath G, Mathur S, Bhatnagar D, Parshad R, Ralhan R. Expression analysis of E-cadherin, Slug and GSK3beta in invasive ductal carcinoma of breast. BMC Cancer 2009; 9:325; http://dx.doi.org/10.1186/1471-2407-9-325; PMID: 19751508
- Belletti B, Baldassarre G. New light on p27(kip1) in breast cancer. Cell Cycle 2012; 11:3701 - 2; http://dx.doi.org/10.4161/cc.21573; PMID: 22895010
- Holz MK. The role of S6K1 in ER-positive breast cancer. Cell Cycle 2012; 11:3159 - 65; http://dx.doi.org/10.4161/cc.21194; PMID: 22895181
- Ma C, Wang J, Gao Y, Gao TW, Chen G, Bower KA, Odetallah M, Ding M, Ke Z, Luo J. The role of glycogen synthase kinase 3beta in the transformation of epidermal cells. Cancer Res 2007; 67:7756 - 64; http://dx.doi.org/10.1158/0008-5472.CAN-06-4665; PMID: 17699780
- Dong J, Peng J, Zhang H, Mondesire WH, Jian W, Mills GB, Hung MC, Meric-Bernstam F. Role of glycogen synthase kinase 3beta in rapamycin-mediated cell cycle regulation and chemosensitivity. Cancer Res 2005; 65:1961 - 72; http://dx.doi.org/10.1158/0008-5472.CAN-04-2501; PMID: 15753396
- Wang Y, Lam JB, Lam KS, Liu J, Lam MC, Hoo RL, Wu D, Cooper GJ, Xu A. Adiponectin modulates the glycogen synthase kinase-3beta/beta-catenin signaling pathway and attenuates mammary tumorigenesis of MDA-MB-231 cells in nude mice. Cancer Res 2006; 66:11462 - 70; http://dx.doi.org/10.1158/0008-5472.CAN-06-1969; PMID: 17145894
- Bachelder RE, Yoon SO, Franci C, de Herreros AG, Mercurio AM. Glycogen synthase kinase-3 is an endogenous inhibitor of Snail transcription: implications for the epithelial-mesenchymal transition. J Cell Biol 2005; 168:29 - 33; http://dx.doi.org/10.1083/jcb.200409067; PMID: 15631989
- Stambolic V, Woodgett JR. Mitogen inactivation of glycogen synthase kinase-3 beta in intact cells via serine 9 phosphorylation. Biochem J 1994; 303:701 - 4; PMID: 7980435
- He X, Saint-Jeannet JP, Woodgett JR, Varmus HE, Dawid IB. Glycogen synthase kinase-3 and dorsoventral patterning in Xenopus embryos. Nature 1995; 374:617 - 22; http://dx.doi.org/10.1038/374617a0; PMID: 7715701
- Shin SI, Freedman VH, Risser R, Pollack R. Tumorigenicity of virus-transformed cells in nude mice is correlated specifically with anchorage independent growth in vitro. Proc Natl Acad Sci U S A 1975; 72:4435 - 9; http://dx.doi.org/10.1073/pnas.72.11.4435; PMID: 172908
- Hahn WC, Counter CM, Lundberg AS, Beijersbergen RL, Brooks MW, Weinberg RA. Creation of human tumour cells with defined genetic elements. Nature 1999; 400:464 - 8; http://dx.doi.org/10.1038/22780; PMID: 10440377
- Ma C, Wang J, Gao Y, Gao TW, Chen G, Bower KA, Odetallah M, Ding M, Ke Z, Luo J. The role of glycogen synthase kinase 3beta in the transformation of epidermal cells. Cancer Res 2007; 67:7756 - 64; http://dx.doi.org/10.1158/0008-5472.CAN-06-4665; PMID: 17699780
- Ougolkov AV, Billadeau DD. Targeting GSK-3: a promising approach for cancer therapy?. Future Oncol 2006; 2:91 - 100; http://dx.doi.org/10.2217/14796694.2.1.91; PMID: 16556076
- Ougolkov AV, Fernandez-Zapico ME, Bilim VN, Smyrk TC, Chari ST, Billadeau DD. Aberrant nuclear accumulation of glycogen synthase kinase-3beta in human pancreatic cancer: association with kinase activity and tumor dedifferentiation. Clin Cancer Res 2006; 12:5074 - 81; http://dx.doi.org/10.1158/1078-0432.CCR-06-0196; PMID: 16951223
- Meares GP, Jope RS. Resolution of the nuclear localization mechanism of glycogen synthase kinase-3: functional effects in apoptosis. J Biol Chem 2007; 282:16989 - 7001; http://dx.doi.org/10.1074/jbc.M700610200; PMID: 17438332
- Soule HD, Vazguez J, Long A, Albert S, Brennan M. A human cell line from a pleural effusion derived from a breast carcinoma. J Natl Cancer Inst 1973; 51:1409 - 16; PMID: 4357757