
Abstract
In Saccharomyces cerevisiae, chromosome congression clusters kinetochores on either side of the spindle equator at metaphase. Many organisms require one or more kinesin-8 molecular motors to achieve chromosome alignment. The yeast kinesin-8, Kip3, has been well studied in vitro but a role in chromosome congression has not beenreported. We investigated Kip3's role in this process using semi-automated, quantitative fluorescence microscopy and time-lapse imaging and found that Kip3 is required for congression. Deletion of KIP3 increases inter-kinetochore distances and increases the variability in the position of sister kinetochores along the spindle axis during metaphase. Kip3 does not regulate spindle length and is not required for kinetochore-microtubule attachment. Instead, Kip3 clusters kinetochores on the metaphase spindle by tightly regulating kinetochore microtubule lengths.
Acknowledgements
We would like to thank K. Bloom and the Yeast Resource Center for supplying plasmids as well as M. Shimogawa, J. Stumpff, D. Gestaut for invaluable discussion and critical reading of the manuscript. This work was supported in part by PHS grants R01GM40506, R01GM69429 and NRSA 2T32 GM007270 from the National Institute of General Medical Sciences (to T.N.D., C.L.A. and M.M.W respectively). E.G.M. was supported by grant P41RR011823 from NCRR. C.L.A. was, additionally, supported by a Searle Scholar Award (06-L-111) and Packard Fellowship for Science and Engineering (2006-30521).
Figures and Tables
Figure 1 Kinetochore distribution is altered in the absence of Kip3. Kinetochore distribution was measured in strains labeled with Spc110-mCherry and Nuf2-GFP, Mtw1-GFP or Spc105-GFP, as described in the Materials and Methods. (A) Representative distributions of Nuf2-GFP, Mtw1-GFP and Spc105-GFP fluorescence between Spc110-mCherry foci in individual wild-type and kip3Δ mutant spindles. Each colored line shows the kinetochore component distribution for a single cell. The spindle poles are at the origin and position 1 on the x-axis. (B–D) Average distributions of kinetochore components. The origin of the x-axis designates the spindle pole and spindle position 0.5 denotes the spindle equator. The error bars represent the standard error of the mean. (B) Average Nuf2-GFp fluorescence distributions. Wild-type strain MSY107-33B, N = 94; kip3Δ mutant strain MMWY19-2A, N = 90. (C) Average Mtw1-GFP fluorescence distributions. Wild-type strain MMWY81-2B, N = 116; kip3Δ mutant strain MMWY81-16C, N = 88. (D) Average Spc105-GFP fluorescence distributions. Wild-type strain MSY265-1D, N = 76; kip3Δ mutant strain MMWY83-5A, N = 46.
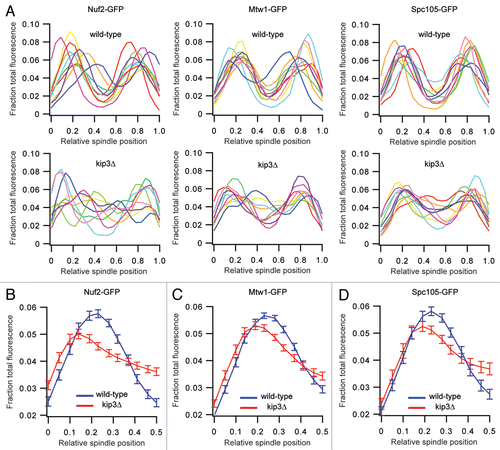
Figure 2 Kinetochore declustering is independent of nuclear position. The distribution of kinetochore component fluorescence was measured in metaphase spindles of wild-type strain MSY107-33B and kip3Δ mutant strain MMWY19-2A, labeled with Spc110-mCherry and Nuf2-GFP, as described in Materials and Methods. On the x-axis, the origin and 0.5 mark the spindle pole and spindle equator, respectively. Wild type in blue, N = 94; kip3Δ mutant with nucleus normally positioned near bud neck in red, N = 60; kip3Δ mutant with nucleus mispositioned in the middle of mother in green, N = 18. the error bars represent the standard error of the mean.
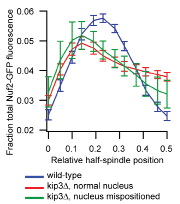
Figure 3 Phenotype of cin8Δ (kinesin-5) mutant. (A) Representative distributions of Nuf2-GFP fluorescence between Spc110-mCherry foci in individual cin8Δ mutant spindles. Each colored line shows the kinetochore component distribution for a single cell. The x-axis origin and spindle position 1 denote the two spindle poles. (B) Average Nuf2-GFP fluorescence distributions. Wild-type strain MMWY72-22D in blue, N = 58; kip3Δ mutant strain MMWY19-2A in red, N = 90; cin8Δ mutant strain MMWY72-25B in green, N = 52. The error bars represent the standard error of the mean. (C) Spc110-mCherry foci per budded cell. 1 focus in blue, 2 foci in red and 3 foci in green. Wild-type strain MMWY72-22D, N = 371; cin8Δ strain MMWY72-25B, N = 296.
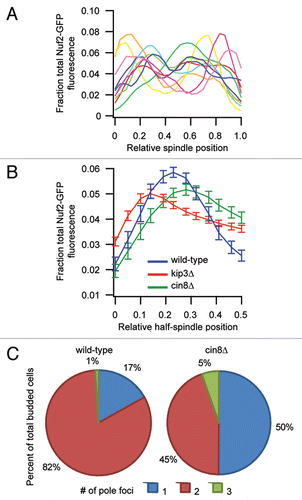
Figure 4 Fluorescently tagged tubulin alters kinetochore distribution. CFP-tubulin and Nuf2-Venus distributions were measured as described in Materials and Methods. The origin of the x-axis designates the spindle pole and spindle position 0.5 denotes the spindle equator. The error bars represent the standard error of the mean. (A) Average distributions of CFP-tubulin fluorescence. Wild-type strain MMWY113-13B in black, N = 112; kip3Δ strain MMWY113-18A, in grey, N = 154. (B and C) Average distributions of Nuf2-Venus fluorescence. (B) Wild-type strain MSY107-33B in black, N = 94; CFP-TUB1 strain MMWY113-13B in grey, N = 112. (C) CFP-TUB1 strain MMWY113-13B in black, N = 112; kip3Δ CFP-TUB1 strain MMWY113-18A in grey, N = 154.
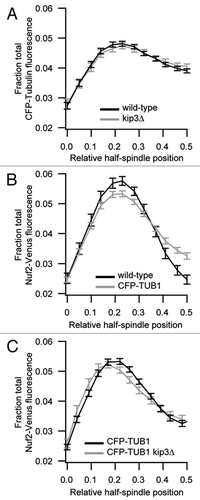
Figure 5 Spindle length is not altered in the kip3Δ mutant strain. Histograms of Spc110-mCherry foci separations in live asynchronous cells. Solid curves are single Gaussian fits. (A) Wild-type strain MSY107-33B, N = 201. (B) kip3Δ mutant strain MMWY19-2A, N = 218.
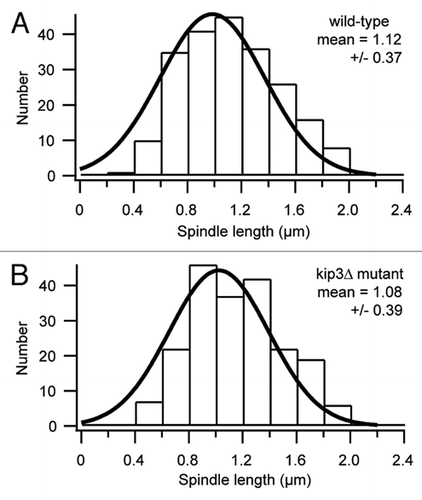
Figure 6 Kip3 Localization. The distribution of Kip3-GFP relative to Nuf2-Cherry in 86 spindles of MSY263-23B was categorized as Two Peaks (47%), High at Equator (28%) or Asymetric (26%). Representative traces show Kip3-GFP in black and Nuf2-Cherry in grey.
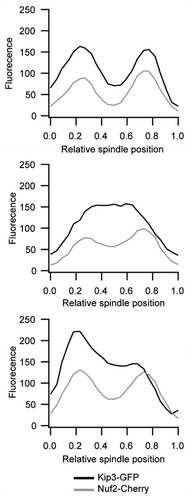
Figure 7 Interkinetochore and pole-kinetochore distances are altered in the kip3Δ mutant. Distribution of distances measured between pairs of CEN3 tagged with GFP and Spc110-mCherry, marking the spindle poles, in live movies of metaphase cells. Solid bold curves are Gaussian fits. Wild-type strain MMWY61n2 in black is 23 cells from 5 experiments; kip3Δ mutant strain MMWY67n14 in grey is 32 cells from 6 experiments. (A) Comparison of normalized distance from pole to nearest CEN3-GFP focus. The origin of the x-axis marks the spindle pole. (B) Comparison of normalized distance between CEN3-GFP foci. The x-axis shows the distance between CEN3-GFP foci pairs.
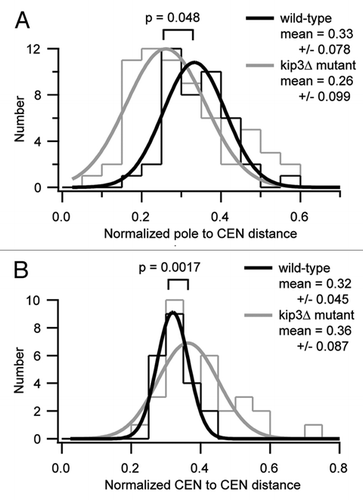
Table 1 Yeast strains
Table 2 Plasmids