Abstract
Ets1 is a member of the Ets family of transcription factors.
Introduction
Ets (E-twenty-six-specific) family proteins are transcription factors that activate or repress the expression of genes that are involved in various biological processes, including cellular proliferation, differentiation, development, transformation and apoptosis.Citation1 Currently there are 29 human Ets family members which were assigned based on presence of a highly conserved DNA-binding Ets domain.Citation2 The Ets domain is an 85-amino acid winged helix-turn-helix DNA-binding domain, which recognizes a core motif, 5′-GGA(A/T)-3′, often referred to as an Ets-binding site (EBS).Citation3,Citation4
Ets1, a member of the Ets family, was initially identified as the protooncogene corresponding to v-ets of the E26 leukemia virus.Citation5,Citation6 As in a wide range of sequence-specific transcription factors, the DNA-binding activity of Ets1 is in an autoinhibited state. The autoinhibition of Ets1 is mediated by structural coupling of the regions flanking the Ets domain.Citation7–Citation11 The NMR structure of a partially inhibited Ets1 fragment, aa 301–441, shows that the inhibitory regions, which are folded as helices HI1 and HI2 N-terminal to the ETS domain and as H4 C-terminal to the ETS domain, are packed together on the Ets domain to form an inhibitory module.Citation12 Deletion of either region or disruption of the inhibitory module by point mutations of Ets1 resulted in 10- to 20-fold increases in DNA-binding affinity.Citation7–Citation11 It is also interesting that helix HI1 unfolds and disrupts the inhibitory module upon DNA binding.Citation13 Ets1 autoinhibition is counteracted by direct interaction of the autoinhibitory regions with regulatory partners, for example Runx1,Citation14–Citation18 Runx2Citation19,Citation20 and Pax5,Citation21 or by DNA-mediated homodimerization.Citation22–Citation24 In the latter case, two Ets1 molecules were found to bind cooperatively to palindromic sequences in which two head-to-head EBS were separated by four base pairs.Citation22,Citation24 EBS palindromes are present in the promoters of stromelysin-1 (refs. Citation23–Citation26) and p53.Citation27 Correspondingly, Ets1 appears to be among the main factors involved in the regulation of the stromelysin-1 (ref. Citation28) and p53 (refs. Citation29 and Citation30), genes through its effective binding to EBS palindromes.
Stromelysin-1 (also referred to as matrix metalloproteinase-3) is involved in extracellular matrix remodeling during physiological processes such as morphogenesis, growth and wound repair.Citation31,Citation32 However, when misregulated, its expression is associated with erosive processes such as rheumatoid and osteoarthritis,Citation33 or invasive pathologies such as tumor growth and metastasis.Citation34–Citation36 In the stromelysin-1 promoter, an EBS palindrome located between positions -216 and -201 is essential for basal and phorbol-12-myristate-13-acetate-,Citation25 platelet-derived growth factor-,Citation37 or interleukin-1β-induced expression.Citation38 Ets1 and Ets2, but not other Ets family members, were found to bind and activate the stromelysin-1 promoter via its EBS palindrome.Citation23–Citation26 Finally, it was established that an endogenously expressed Ets1 is actually the main activator of the stromelysin-1 promoter.Citation28
The parameters of a cooperative binding of two Ets1 molecules to the human stromelysin-1 promoter EBS palindrome has been characterized by a combination of surface plasmon resonance (SPR), electrophoretic mobility shift assay (EMSA) and photo cross-linking.Citation24 Recently, Lamber et al.Citation39 reported the crystal structure of the Ets1 dimer bound to the stromelysin-1 palindrome. However, a critical hydrogen bond and the inhibitory residues encoded by exon VII which are required for cooperative DNA binding were not included in their model. As a result, the true mechanism of Ets1 cooperative binding to the EBS palindrome remains unreported. Here we describe a new crystal structure of the Ets1 dimer bound to stromelysin-1 promoter DNA. The structure reveals an essential features of Ets1•Ets1 interaction and provides a plausible model of Ets1 cooperative binding to the EBS palindrome. The model was verified both in vitro with SPR and in vivo by transient transcription-based assays.
Results
Overall structure.
Crystallization experiments produced two types of crystals, one belonging to the monoclinic space group C2 and another belonging to the orthorhombic space group C2221. Both crystals diffract up to 3 Å resolution, but the orthorhombic crystals diffracted with a high anisotropy and were excluded from further studies. The structure of the monoclinic crystal was solved by the molecular replacement method and refined to an Rfree of 28.9%. Two Ets1 molecules (amino acid residues 280–441) bind the stromelysin-1 promoter EBS palindrome facing each other with autoinhibitory domains and form a DNA-mediated dimer [further referred to as (Ets1)2•DNA complex] (). No electron density was found for the amino acid residues 280–301 and 438–441 of each Ets1, and the linker between the inhibitory helices HI1 and HI2 was partially disordered for both Ets1. The adjacent DNA molecules are related by two-fold screw symmetry and connected by Watson-Crick base pairing of overhanging G and C bases, forming continuous duplexes. Within the (Ets1)2•DNA complex, the Ets1•Ets1 interactions are observed at two equivalent positions close to DNA (referred as interaction areas I). Moreover, the oppositely located (Ets1)2•DNA complexes interact via protruding HI1 helices at four nearly identical positions (referred as interaction areas II) forming an Ets1 tetramer ().
Ets1•Ets1 interface at interaction areas I.
Ets1•Ets1 interactions in both areas I bury a total of 650 Å2 of protein surface. In each area I, the amino acid residues (331–334) from the loop HI2-H1 of one Ets1 interact with the residues (379–382) close to the C-terminal part of H2 of another Ets1. Except for the potential hydrogen bonds Gly333 N⋯Asn380 O and Asn380 ND2⋯Gly333 O (), the remaining interactions are van der Waals interactions (). The donor-to-acceptor distance for both hydrogen bonds (3.0–3.2 Å) is within the range for a typical N-H⋯O hydrogen bond in protein crystals.Citation40 However, the θ (N-H⋯O) angle for Gly333 N⋯Asn380 O (105°/122°) points to a significantly weaker hydrogen bond compared to the stronger Asn380 ND2⋯Gly333 O hydrogen bond (θ = 158°/146°).Citation40 Thus, the latter critical hydrogen bond appears to be a major contributor for Ets1 cooperation at interaction area I. This hydrogen bond was missing from the structure of (Ets1)2•DNA reported by Lamber and coauthors.Citation39
Ets1•Ets1 interface at interaction areas II.
As we described above, in our crystals the HI1•Ets1 interactions involve four similar areas connecting two (Ets1)2•DNA complexes (). In each area, the N-terminus of HI1 from one molecule packs against the C-terminus of H4 of another molecule forming numerous contacts with H4, HI2 and a linker between HI1 and HI2. These interactions stabilize the entire “inhibitory module” of Ets1 ( and B). Comparison of HI1•Ets1 interactions with corresponding interactions in the crystal structure of the Ets1•Ets1 dimer (pdb code 1gvj) revealed their similarity (). The only significant differences were observed for the amino acid residues 314–318 comprising part of the linker between the HI1 and HI2. These residues were well structured in Ets1•Ets1 crystals but changed their conformations and become partially disordered in (Ets1)2•DNA crystals. In the (Ets1)2•DNA structure (2nny) reported by Lamber and coauthorsCitation39 the HI1 helix was described as a random coil. However, the electron density map indicates that in our structure the residues corresponding to HI1 are folded as an a-helix ().
Replacement of HI1.
The HI1•Ets1 interactions observed between the two closely packed (Ets1)2•DNA complexes raised a possibility of HI1•Ets1 interactions within the single (Ets1)2•DNA molecule in the absence of closely packed neighboring molecule. However, modeling of HI1•Ets1 interactions within a single (Ets1)2•DNA molecule indicates that the separation between HI1 and the docking site for HI1 is too long (>27 Å). Consequently, the formation of intermolecular HI1•Ets1 interactions within (Ets1)2•DNA is unlikely since it requires significantly longer linkers between HI1 and HI2. The Phe304 and Tyr307 of HI1 are the key residues contributing to HI1 interactions with Ets1 (). That is why we examined whether a fragment with a similar arrangement of aromatic residues exists N-terminal to HI1 that would be capable of reaching Ets1, thereby replacing HI1 interaction with Ets domain. Indeed, the inspection of sequences N-terminal to helix HI1 revealed a segment (aa 282–291) which has two aromatic amino acids (Tyr283 and Phe286) and has the potential to substitute for the Phe304 and Tyr307 of HI1 in complex formation with Ets1 (). We hypothesized that within (Ets1)2•DNA, the amino acid residues 282–291 of each Ets1 can form a helix (further referred as HI1′) and mediate the dimerization of Ets1 in place of HI1 as was observed in the crystal structures ().
In vivo and in vitro DNA binding studies.
To test our model, we disrupted the Ets1•Ets1 interaction by inducing point mutations in the most critical residues and determined the effect of these mutations on cooperative binding of Ets1 to stromelysin-1 promoter DNA by SPR and transcriptional assays.
To verify the importance of the intermolecular hydrogen bond between Asn380 ND2 and Gly333 O, Asn380 was mutated to alanine (N380A). Furthermore, as discussed above, in the case of HI1′ interaction with the Ets domain, the positions of Phe304 and Tyr307 of HI1 would be substituted by Tyr283 and Phe286 of HI1′, respectively. The studies performed in the Wolberger laboratory revealed that the mutation of Phe304 to alanine disrupts the HI1 interaction with Ets1.Citation13 Therefore, to verify our hypothesis that HI1′ is capable of interacting with Ets1 in a manner similar to that of HI1, we mutated Tyr283 to alanine (Y283A). We also prepared a double mutant Y283A/N380A to check the simultaneous effect of these two mutations. To prepare Ets1 with completely disrupted cooperative DNA-binding properties, we mutated Gly333 to alanine (G333A). Gly333 is located in the loop HI2-H1 and has φ and ψ values that are not favorable for other residues. Thus, any mutation of Gly333, including G333A, is expected to change the correct conformation of loop HI2-H1 and consequently destabilize the HI2 packing on the surface of the Ets domain.
Transient transfection assays () demonstrated that each mutant Ets1 was less active than the wild-type Ets1 at stimulating the stromelysin-1 promoter at a low (5 ng) dose. However, as expected, the loss of cooperative DNA binding was compensated by using higher amounts of the Ets1 expression vectors, especially for Y283A and N380A. The mutants with more disrupted interaction areas, including double mutant Y283A/N380A and G333A, did not fully recover their activities even at the higher 45 ng dose of Ets1 expression vectors.
For quantitative characterization of the Ets1 DNA-binding parameters, we carried out SPR experiments both with wild-type stromelysin-1 promoter DNA and with DNA having a 4 nt insertion between the EBS (). SPR experiments revealed a 5 to 8-fold reduction in cooperative binding of N380A, Y283A and Y283A/N380A Ets1 to a stromelysin-1 promoter compared with a wild-type Ets1. Similar loss of cooperativity was observed also for a wild-type and mutant Ets1 molecules when a 4 nt insertion has been introduced between the EBS (). This is because separation of EBS on DNA prevents direct interaction of Ets1 molecules.
Materials and Methods
Expression and purification of Ets1280–441.
The Ets1280–441 coding sequences were cloned into the pET3c vector (Novagen) after PCR amplification. Escherichia coli BL21 (DE3) was transformed with a resultant plasmid pEts280–441. The transformant was precultured in 120 ml of LB medium, containing 0.1 mg/ml ampicillin at 37°C for 16 h. 14 ml of the culture medium was inoculated into 800 ml of SB medium (3.2% trypton, 2% yeast extracts and 0.5% NaCl), containing 0.3 mg/ml ampicillin. Cells were grown at 37°C with circular shaking at 200 rpm. When the absorbance of the culture medium at 600 nm reached between 0.5 and 0.6, IPTG was added to the medium at a final concentration of 0.5 mM. After 2 h of additional shaking cells were harvested by centrifugation and frozen at −80°C.
Cell pellets (around 12 g of wet weight of the cells) obtained from 3.2 liters of culture were suspended in 100 ml of 50 mM sodium phosphate buffer (pH 7.4) containing 1 M NaCl, 1 mM EDTA, 1 mM PMSF, 5 mM 2-mercaptoethanol and 10% glycerol. The solution was subjected to three rounds of treatment with EmulsiFlex. The solution was centrifuged at 15,000 rpm at 4°C for 30 min. Polyethyleneimine was added to the supernatant at a final concentration of 0.07% and the solution was stirred gently for 1 h at 4°C. The precipitate was removed by centrifugation at 15,000 rpm at 4°C for 20 min. Ammonium sulfate was added to the supernatant at 80% and the solution was stirred gently for 2 h at 4°C. The precipitate was collected by centrifugation and suspended in 20 ml of 20 mM sodium phosphate buffer (pH 7.5) containing 1 mM EDTA, 5 mM 2-mercaptoethanol, 0.05 M NaCl and 10% glycerol (buffer A). The solution was dialyzed against buffer A. The dialyzate was injected on a HiTrapSP HP column (5 ml) equilibrated with buffer A. Elution was done by a linearly increasing NaCl concentration from 0.05 M to 1 M in buffer A at 2 ml/min at 4°C. Fractions containing Ets1280–441 were collected and diluted by adding buffer A to a final NaCl concentration of around 0.1 M in the solution. The solution was injected on a HiTrap HeparinHP column (1 ml) equilibrated with buffer A. Elution was done by increasing NaCl concentration in buffer A from 0.05 M to 1 M at 0.5 ml/min. The Ets1280–441 fractions were collected. A half volume of 2 M ammonium sulfate in buffer A was added to the solution of Ets1280–441. Then, the mixture was injected to a HiTrap Phenyl HP column (5 ml) equilibrated with buffer A, containing 1 M ammonium sulfate (buffer B). Elution was done by decreasing the ammonium sulfate concentration from 1 M to 0 M in buffer B. The Ets1280–441 fractions were collected and concentrated. The solution was injected on a HiLoad superdex 200 pg column (333 ml) equilibrated with buffer A, containing 0.45 M NaCl (buffer C). Elution was done at 1.5 ml/min by using buffer C. The Ets1280–441 fractions were concentrated and stored at −20°C.
Preparation of DNA.
A double-strand oligonucleotide corresponding to the stromelysin-1 promoter EBS palindrome was prepared by annealing synthetic oligonucleotides 5′-CAG GAA GCA CTT CCT G-3′ and 5′-GCA GGA AGT GCT TCC T-3′ synthesized by the Eppley Molecular Core laboratory of University of Nebraska Medical Center. Each of the oligonucleotides were dissolved in 10 mM Tris-HCl (pH 7.5) 1 mM EDTA and 1 M NaCl at a concentration of 0.2 mM. Oligonucleotide pairs were annealed by heating to 95°C for 5 min and gradually cooling to room temperature over 3 h by using a PCR thermal cycler. The DNA solution was desalted, dried and dissolved in10 mM Tris-HCl (pH 8.0).
Crystallization.
Ets1280–441 and the stromelysin-1 EBS palindrome dsDNA were mixed in 2:1.05 ratio, incubated at room temperature for 20 min in 5 mM Tris (pH 8.5) and 5 mM DTT and concentrated to 3.4 mg•ml−1. Crystallization screening was performed using Natrix screen kit (Hampton Research) by the sitting-drop vapor-diffusion method at 295 K by mixing 1 µl protein•DNA solution with 1 µl reservoir solution. Small crystals appeared in the 7th condition of the Natrix screen kit. The optimization of crystal growth conditions were performed with variation of additives and the concentration of components. Diffraction-quality crystals were finally obtained at 295 K in 15 mM ammonium chloride, 15 mM magnesium chloride, 0.7 M NDSB-195, 40 mM MES buffer (pH 6.5) and 11.5% v/v 2-Propanol. Under the same conditions crystals grew either as rhombic plates () or as extended thin rectangular prisms (). The rhombic crystals belong to the orthorhombic space group C2221 with unit cell parameters a = 78.24 Å, b = 185.4 Å and c = 148 Å, and diffract to a maximum of 3.3 Å resolution. The prism-shaped crystals belong to the monoclinic space group C2 and diffract to 3 Å resolution. The latter crystals were used for structure determination and refinement ().
Diffraction data collection.
The crystals were soaked in cryoprotectant for a few seconds, scooped in nylon-fiber loop and flash cooled in a dry nitrogen stream at 100 K. The cryoprotectant solution contained 15 mM ammonium chloride, 15 mM magnesium chloride, 40 mM MES pH 6.0, 0.5 M NDSB-195, 20% v/v ethylene glycol and 5% w/v PEG 8000.
Preliminary X-ray examinations of crystals were carried out using a Rigaku R-AXIS IV imaging plate with Osmic VariMax™ HR mirror-focused Cu Kα radiation from a Rigaku FR-E rotating-anode generator operated at 45 kV and 45 mA. The final data set was collected on Argonne National Laboratory Advanced Photon Source beamline 24ID-C using an ADSC Q315 detector. All intensity data were indexed, integrated and scaled with DENZO and SCALEPACK from the HKL2000 program package. The crystal parameters and data-processing statistics are summarized in .
Structure determination.
The structure was determined by the molecular replacement method starting with the coordinates of Ets1 (PDB entry 1gvj). The major manual rebuilding of the initial model was performed with TURBO-FRODO software. The model was refined at 3.0 Å resolution to an Rcryst of 24.2% and an Rfree of 28.9%. CNS version 1.1,Citation43 was used for all crystallographic computing. Application of zonal scalingCitation44 and bulk solvent correction improved the quality of electron density maps. The final refinement statistics are provided in . The figures containing molecular structures were drawn with PyMOL.Citation45
Transient transfection assays.
The pGL3 WT and pGL3 M1M2 promoter/reporter gene constructs were obtained from M. Aumercier (Lille Cedex, France).Citation28 pGL3 WT contains the 5′ flanking region of the stromelysin-1 gene, which includes the EBS palindrome driving expression of luciferase reporter protein. pGL3 M1M2 is identical to pGL3 WT except both Ets sites have been disrupted as described previously.Citation28 The expression vector for Ets1, pCMV-Tag2a-FlagEts1, was described previously.Citation46 It contains a cDNA sequence for Ets1, which is Flag epitope-tagged at its N-terminus. The expression vector Ets1Y283A was generated from the Ets1 expression vector by site-directed mutagenesis converting tyrosine 283 to an alanine using the primer pair 5′-CGG GTC CCC TCC GCT GAC AGC TTC GAC TAC-3′ and its complement. The expression vector Ets1N380A was generated from the Ets1 expression vector by converting asparagine 380 to an alanine using the primer pair 5′-GGA GAT GGG GAA AGA GGA AAG CCA AAC CTA AGA TGA ATT ATG-3′ and its complement. The expression vector Ets1Y283A/N380A was generated from Ets1Y283A by using the Ets1N380A primer pair described above. The expression vector Ets1G333A was generated from the Ets1 expression vector by converting glycine 333 to an alanine using the primer pair 5′-GCT ACA CAG GAA GTG CGC CGA TCC AGC TGT G-3′ and its complement.
Stock cultures of 293T cells were maintained in Dulbecco's modified Eagle's medium (DMEM, Invitrogen, Carlsbad, CA) supplemented with 10% fetal bovine serum (FBS, HyClone, Logan, UT) as reported previously.Citation47 Stock cultures and all experimental cultures were maintained at 37°C in a moist atmosphere of 95% air and 5% CO2.
293T cells were seeded at 200,000 cells per 60-mm dish and transfected in duplicate the following day using the calcium phosphate precipitation method as described previously.Citation48 In addition to 2 µg of the promoter/reporter construct, the cells were cotransfected with 50 ng of pTK-RL (Promega, Madison, WI) to normalize for any differences in transfection efficiency. Where indicated, varying amounts of Ets1 expression vectors were cotransfected with the promoter/reporter construct. To maintain equal amounts of total DNA in each transfection, DNA from the empty vector, CMV5, was added as needed. The cells were incubated overnight with the DNA-CaPO4 precipitate before being washed with serum-free medium and refed with DMEM supplemented with 10% FBS. Luciferase activity was measured 48 hours after transfection using the Dual-Luciferase Reporter Assay System (Promega, Madison, WI). Expression levels of wild-type Ets1 and each of the Ets1 mutants were determined by transiently transfecting 293T cells separately with an expression vector for each of these proteins. Nuclear extracts were prepared and the expression levels of Ets1 and its mutant counterparts were determined by western blot analysis using the M2 antibody, which recognizes the Flag epitope present at the N-terminus of each protein, as described previously.Citation46,Citation49
Surface plasmon resonance.
The Ets1 fragment containing residues 276–441 was prepared using protocols similar to preparation of Ets280–441. Site-directed mutagenesis inducing point mutation of Ets1276–441 was carried out using a QuikChange Site-Directed Mutagenesis kit (STRATAGENE). The strategy for the expression and purification of the mutated Ets1 proteins was the same as that used with the wild-type Ets1276–441. A BIACORE 2000 biosensor system (GE Healthcare Bio-Sciences KK) was used to measure the interaction between Ets1276–441 or its mutants and two double-stranded DNA fragments () derived from the stromelysin-1 promoter, respectively.
The biotinated DNA was bound to the biosensor chip CM4 via streptavidin preimmobilized to dextran on the chip surface using the standard amine coupling procedure described by the manufacturer. The ligand was diluted to 2 nM in 10 mM HEPES (pH 7.4) containing 150 mM NaCl, 5 mM MgCl2, 2 mM dithiothreitol and 0.005% Tween 20, and applied to the sensor chip surface at a rate of 20 µl/min until around 30 resonance units were obtained. The running buffer was 10 mM HEPES (pH 7.4) containing 150 mM NaCl, 5 mM MgCl2, 2 mM dithiothreitol and 0.005% Tween 20; as analytes, Ets1276–441 or its mutants were diluted to various concentrations in the same solution and then injected over the immobilized ligand at a rate of 100 µl/min until the injected volume reached 250 µl. Dissociation of the analytes was then measured by injecting the running buffer alone. All experiments were performed at 25°C. Data were analyzed with BIA evaluation version 3.1 using a nonlinear least squares method to obtain the association and dissociation rate constants (ka and kd, respectively). For this, the global fitting of the association and dissociation phases of the response curves using a 1:1 binding model was applied. The fittings were considered satisfactory if χ2 < 2. The equilibrium dissociation constants (KD) were calculated from the equation KD = kd/ka. The standard deviation was calculated from four or three experiments.
Accession numbers.
Atomic coordinates and structure factors of (Ets1)2•DNA have been deposited in the Protein Data Bank with accession number 3mfk.
Conclusions
According to the accepted mechanism of Ets1 autoinhibition, the HI1, HI2 and H4 helices are packed to form a part of an inhibitory module within an Ets1 monomer; upon DNA binding HI1 is dissociated and disordered, reducing the stability of the inhibitory module and increasing the DNA-binding affinity of Ets1.Citation12,Citation13 However, the contribution of the residues 302–330, which contain HI1 and HI2, to Ets1 autoinhibition is marginal (≈2-fold) compared with residues 244–301 N-terminal to HI1 (>10-fold).Citation12,Citation17 These residues are flexible and function by masking the DNA-binding surface of the Ets domain.Citation12,Citation41 Phosphorylation of serines 251, 282 and 285 reduces the mobility of residues N-terminal to HI1 and enhances autoinhibition dramatically (50-fold).Citation41,Citation42 Thus, the accumulated data indicates that the HI1 and HI2 helices contribute to Ets1 autoinhibition not by allosteric conformational changes in the Ets domain, but by directing the inhibitory residues N-terminal to HI1 to mask the Ets domain DNA-binding surface ().
Interestingly, in the case of Ets1 binding to the EBS palindrome the inhibitory sequences are absolutely required for cooperative DNA binding.Citation22,Citation24 Detailed mapping of the inhibitory regions involved in cooperative DNA binding has been performed in the Aumercier laboratory and revealed that DNA binding is optimal when all inhibitory residues from 245 to 331 are present.Citation24 The level of cooperativity was reduced upon N-terminal truncation up to residues 280 and further reduced upon truncation up to residue 301, pointing to an important contribution of the residues located within the removed fragments. The remaining fragment (301–441) was a minimal fragment exhibiting cooperative binding, albeit with significantly reduced cooperativity and a mixture of complexes with noncooperative Ets1 binding.Citation24 The data from the Aumercier laboratory also shows that phosphorylation of Ets1 significantly reduces, but does not eliminate cooperative binding to the EBS palindrome.Citation24 These reported data, together with our above described experiments, support the model of Ets1 cooperative binding to the EBS palindrome in which the Ets1 molecules cooperate via interactions in areas I and areas II, assuming that in areas II the “inhibitory module” building function of HI1 is rescued by HI1′. The binding of HI1′ is beneficial in two ways: first, it stabilizes the entire “inhibitory module,” providing stable Ets1•Ets1 contacts in interaction areas I; second, it helps to keep inhibitory sequences (especially Ser282 and Ser285) away from the DNA-binding surface of the Ets domain ().
Figures and Tables
Figure 1 Overall view of (Ets1)2•DNA complex. (A) Cartoon representation of (Ets1)2•DNA complex (top) and the same complex with the Ets1 molecule drawn as surfaces and rotated 180° to highlight DNA docking (bottom). Each interaction area I in the top image is marked by shadow. A close-up view of intermolecular (B) hydrogen bonds and (C) van der Waals contacts in interaction area I. The hydrogen bonds are shown as black dashed lines and the van der Waals interactions are shown as pale green dashed lines.
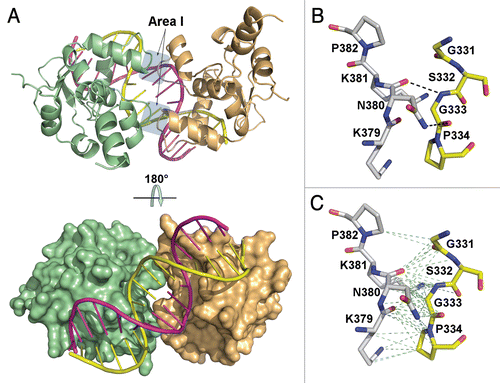
Figure 2 Intermolecular interactions between two (Ets1)2•DNA complexes. The molecules are drawn as cartoons with cylindrical α-helices and each Ets1 is shown in different color. The approximate locations of interaction areas II are shadowed in the left image. The right image is a 90° rotation of the left image.
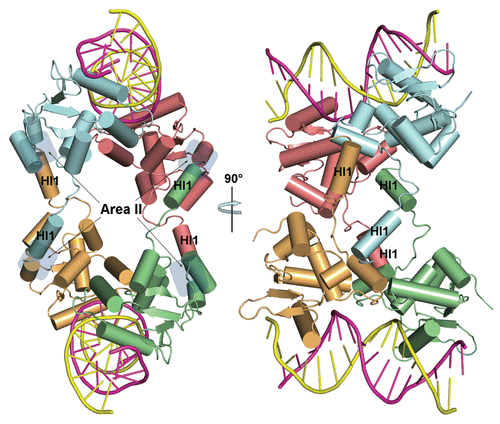
Figure 3 The Ets1•Ets1 interactions in area II. (A) The docking of HI1 helix (yellow ribbon) into the surface of the Ets domain (light orange). The Ets1 fragments involved in intermolecular interactions are highlighted by pale cyan. (B) View as in part (A) except the Ets domain is drawn as cartoon. (C) Comparison of HI1 helix interaction with the Ets domain in crystal structures of (Ets1)2•DNA and the Ets1 dimer (1gvj). The HI1 and HI2 helices and the Ets domain of the (Ets1)2•DNA structure are colored in yellow and sand, respectively. The corresponding residues of the Ets1 dimer structure are colored in cyan and blue, respectively. (D) A view of the portion of 2Fo-Fc Fourier map (mesh) contoured at 1σ and covering the residues of the HI1 helix and those in its surroundings.
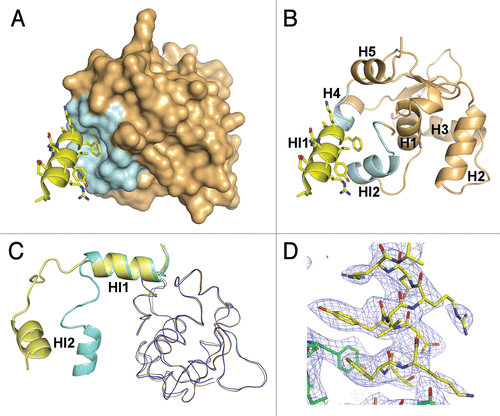
Figure 4 The model of (Ets1)2•DNA complex formation. (A) Alignment of amino acid sequences of helix HI1 with the inhibitory sequences N-terminal to HI1. The aligned aromatic residues are highlighted in red, and the serines 282 and 285 which phosphorylation enhances the Ets1 autoinhibition are marked in yellow. The dark red bars above and below the sequences indicate the residues capable of forming helices HI1′ and HI1, respectively. (B) The cartoon of Ets1 cooperative binding to the EBS palindrome. In DNA-free Ets1, the HI1 helix interacts with the Ets domain and directs the N-terminal disordered sequences containing the phosphorylated serines to mask the DNA-binding surface of Ets1. Upon binding to the EBS palindrome, the HI1 dissociates from the Ets domain and becomes disordered. Instead, the HI1′ sequences become folded as a helix which binds to the Ets domain of neighboring Ets1. This enhances the stability of interaction area I (dashed areas). The HI' binding also places phosphoserines (yellow stars) away from the DNA-binding surface of Ets1, reducing their inhibitory function.
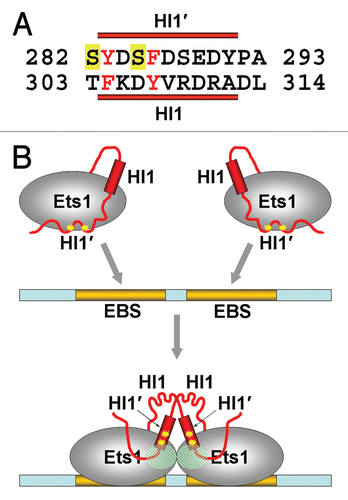
Figure 5 In vitro studies of Ets1 cooperative binding to stromelysin-1 promoter. (A) Effects of wild-type Ets1 and Ets1 mutants on the Stromelysin-1 promoter. 293T cells were transfected with 2 µg of the promoter/reporter gene construct plus 50 ng of the TK-RL normalizing vector. (B) Effects of Ets1 on the activity of the Stromelysin-1 promoter with wild-type and disrupted EBS. 293T cells in 60 mm tissue culture dishes were transfected with 2 µg of the promoter/reporter gene constructs pGL3 WT and pGL3 M1M2 plus 50 ng of the TK-RL normalizing vector. In both parts, where indicated, Ets1 expression vectors were added. Reporter activity was normalized to that of TK-RL and the activity of pGL3 WT was set to 1. All other values are shown relative to the promoter in the absence of transfected Ets1 vectors. The data shown represents the mean and standard deviation of duplicate samples from a representative experiment. Each experiment was repeated at least twice and similar results were obtained.
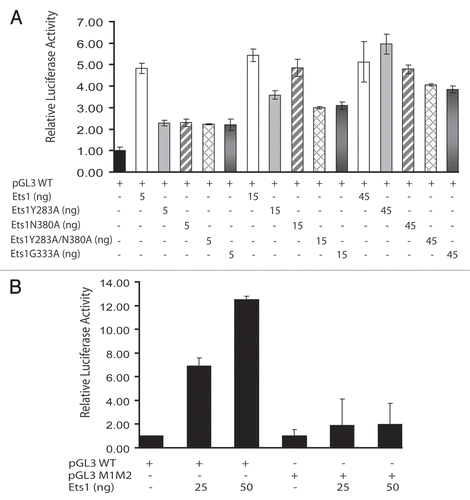
Figure 6 Photomicrograph of (Ets1)2•DNA crystals. (A) Orthorhombic and (B) monoclinic crystals of (Ets1)2•DNA.
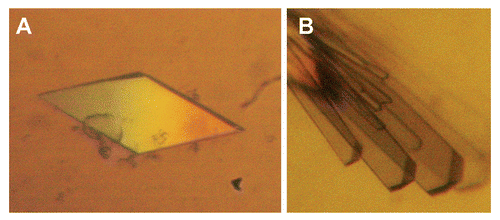
Table 1 Kinetic and dissociation constants of Ets1 binding to stromelysin-1 promoter
Table 2 Data collection and refinement statistics
Acknowledgements
We thank M. Aumercier for pGL3 WT and pGL3 M1M2 promoter/reporter gene constructs, J. Lovelace and G.E. Borgstahl for maintenance and management of the Eppley Institute's X-ray Crystallography facility and D.G. Vassylyev for the zonal scaling instruction files. Primers and oligonucleotides for crystallization were synthesized in the Eppley Institute's Molecular Biology Core facility. The Eppley Institute's core facilities are supported by the Cancer Center Support Grant P30CA036727. This work is supported by NIGMS grant R01GM082923 to T.H.T. and the Nebraska Department of Health grant 2009-32 to A.R. This work is also based upon research conducted at the Northeastern Collaborative Access Team beamlines of the Advanced Photon Source, supported by award RR-15301 from the National Center for Research Resources at the National Institutes of Health. Use of the Advanced Photon Source is supported by the U.S. Department of Energy, Office of Basic Energy Sciences, under Contract No. DE-AC02-06CH11357.
References
- Seth A, Watson DK. ETS transcription factors and their emerging roles in human cancer. Eur J Cancer 2005; 41:2462 - 2478
- Gallant S, Gilkeson G. ETS transcription factors and regulation of immunity. Arch Immunol Ther Exp (Warsz) 2006; 54:149 - 163
- Donaldson LW, Petersen JM, Graves BJ, McIntosh LP. Secondary structure of the ETS domain places murine Ets-1 in the superfamily of winged helix-turn-helix DNA-binding proteins. Biochemistry 1994; 33:13509 - 13516
- Nye JA, Petersen JM, Gunther CV, Jonsen MD, Graves BJ. Interaction of murine ets-1 with GGA-binding sites establishes the ETS domain as a new DNA-binding motif. Genes Dev 1992; 6:975 - 990
- Leprince D, Gegonne A, Coll J, de Taisne C, Schneeberger A, Lagrou C, et al. A putative second cell-derived oncogene of the avian leukaemia retrovirus E26. Nature 1983; 306:395 - 397
- Nunn MF, Seeburg PH, Moscovici C, Duesberg PH. Tripartite structure of the avian erythroblastosis virus E26 transforming gene. Nature 1983; 306:391 - 395
- Hagman J, Grosschedl R. An inhibitory carboxyl-terminal domain in Ets-1 and Ets-2 mediates differential binding of ETS family factors to promoter sequences of the mb-1 gene. Proc Natl Acad Sci USA 1992; 89:8889 - 8893
- Jonsen MD, Petersen JM, Xu QP, Graves BJ. Characterization of the cooperative function of inhibitory sequences in Ets-1. Mol Cell Biol 1996; 16:2065 - 2073
- Lim F, Kraut N, Framptom J, Graf T. DNA binding by c-Ets-1, but not v-Ets, is repressed by an intramolecular mechanism. EMBO J 1992; 11:643 - 652
- Petersen JM, Skalicky JJ, Donaldson LW, McIntosh LP, Alber T, Graves BJ. Modulation of transcription factor Ets-1 DNA binding: DNA-induced unfolding of an alpha helix. Science 1995; 269:1866 - 1869
- Wasylyk C, Kerckaert JP, Wasylyk B. A novel modulator domain of Ets transcription factors. Genes Dev 1992; 6:965 - 974
- Lee GM, Donaldson LW, Pufall MA, Kang HS, Pot I, Graves BJ, et al. The structural and dynamic basis of Ets-1 DNA binding autoinhibition. J Biol Chem 2005; 280:7088 - 7099
- Garvie CW, Pufall MA, Graves BJ, Wolberger C. Structural analysis of the autoinhibition of Ets-1 and its role in protein partnerships. J Biol Chem 2002; 277:45529 - 45536
- Wotton D, Ghysdael J, Wang S, Speck NA, Owen MJ. Cooperative binding of Ets-1 and core binding factor to DNA. Mol Cell Biol 1994; 14:840 - 850
- Sun W, Graves BJ, Speck NA. Transactivation of the Moloney murine leukemia virus and T-cell receptor beta-chain enhancers by cbf and ets requires intact binding sites for both proteins. J Virol 1995; 69:4941 - 4949
- Gu TL, Goetz TL, Graves BJ, Speck NA. Autoinhibition and partner proteins, core-binding factor beta (CBFbeta) and Ets-1, modulate DNA binding by CBFalpha2 (AML1). Mol Cell Biol 2000; 20:91 - 103
- Goetz TL, Gu TL, Speck NA, Graves BJ. Autoinhibition of Ets-1 is counteracted by DNA binding cooperativity with core-binding factor alpha2. Mol Cell Biol 2000; 20:81 - 90
- Kim WY, Sieweke M, Ogawa E, Wee HJ, Englmeier U, Graf T, et al. Mutual activation of Ets-1 and AML1 DNA binding by direct interaction of their autoinhibitory domains. EMBO J 1999; 18:1609 - 1620
- Wai PY, Mi Z, Gao C, Guo H, Marroquin C, Kuo PC. Ets-1 and runx2 regulate transcription of a metastatic gene, osteopontin, in murine colorectal cancer cells. J Biol Chem 2006; 281:18973 - 18982
- Sato M, Morii E, Komori T, Kawahata H, Sugimoto M, Terai K, et al. Transcriptional regulation of osteopontin gene in vivo by PEBP2alphaA/CBFA1 and ETS1 in the skeletal tissues. Oncogene 1998; 17:1517 - 1525
- Garvie CW, Hagman J, Wolberger C. Structural studies of Ets-1/Pax5 complex formation on DNA. Mol Cell 2001; 8:1267 - 1276
- Venanzoni MC, Robinson LR, Hodge DR, Kola I, Seth A. ETS1 and ETS2 in p53 regulation: Spatial separation of ETS binding sites (EBS) modulate protein: DNA interaction. Oncogene 1996; 12:1199 - 1204
- Wasylyk C, Gutman A, Nicholson R, Wasylyk B. The c-Ets oncoprotein activates the stromelysin promoter through the same elements as several non-nuclear oncoproteins. EMBO J 1991; 10:1127 - 1134
- Baillat D, Begue A, Stehelin D, Aumercier M. ETS-1 transcription factor binds cooperatively to the palindromic head to head ETS-binding sites of the stromelysin-1 promoter by counteracting autoinhibition. J Biol Chem 2002; 277:29386 - 29398
- Buttice G, Kurkinen M. A polyomavirus enhancer A-binding protein-3 site and Ets-2 protein have a major role in the 12-O-tetradecanoylphorbol-13-acetate response of the human stromelysin gene. J Biol Chem 1993; 268:7196 - 7204
- Basuyaux JP, Ferreira E, Stehelin D, Buttice G. The Ets transcription factors interact with each other and with the c-Fos/c-Jun complex via distinct protein domains in a DNA-dependent and -independent manner. J Biol Chem 1997; 272:26188 - 26195
- Tuck SP, Crawford L. Characterization of the human p53 gene promoter. Mol Cell Biol 1989; 9:2163 - 2172
- Baillat D, Leprivier G, Regnier D, Vintonenko N, Begue A, Stehelin D, et al. Stromelysin-1 expression is activated in vivo by Ets-1 through palindromic head-to-head Ets binding sites present in the promoter. Oncogene 2006; 25:5764 - 5776
- Reisman D, Eaton E, McMillin D, Doudican NA, Boggs K. Cloning and characterization of murine p53 upstream sequences reveals additional positive transcriptional regulatory elements. Gene 2001; 274:129 - 137
- Baillat D, Laitem C, Leprivier G, Margerin C, Aumercier M. Ets-1 binds cooperatively to the palindromic Ets-binding sites in the p53 promoter. Biochem Biophys Res Commun 2009; 378:213 - 217
- Sternlicht MD, Lochter A, Sympson CJ, Huey B, Rougier JP, Gray JW, et al. The stromal proteinase MMP3/stromelysin-1 promotes mammary carcinogenesis. Cell 1999; 98:137 - 146
- Vu TH, Werb Z. Matrix metalloproteinases: Effectors of development and normal physiology. Genes Dev 2000; 14:2123 - 2133
- Malemud CJ, Goldberg VM. Future directions for research and treatment of osteoarthritis. Front Biosci 1999; 4:762 - 771
- Nelson AR, Fingleton B, Rothenberg ML, Matrisian LM. Matrix metalloproteinases: biologic activity and clinical implications. J Clin Oncol 2000; 18:1135 - 1149
- Zucker S, Cao J, Chen WT. Critical appraisal of the use of matrix metalloproteinase inhibitors in cancer treatment. Oncogene 2000; 19:6642 - 6650
- Johansson N, Ahonen M, Kahari VM. Matrix metalloproteinases in tumor invasion. Cell Mol Life Sci 2000; 57:5 - 15
- Kirstein M, Sanz L, Quinones S, Moscat J, Diaz-Meco MT, Saus J. Cross-talk between different enhancer elements during mitogenic induction of the human stromelysin-1 gene. J Biol Chem 1996; 271:18231 - 18236
- Quinones S, Buttice G, Kurkinen M. Promoter elements in the transcriptional activation of the human stromelysin-1 gene by the inflammatory cytokine, interleukin 1. Biochem J 1994; 302:471 - 477
- Lamber EP, Vanhille L, Textor LC, Kachalova GS, Sieweke MH, Wilmanns M. Regulation of the transcription factor Ets-1 by DNA-mediated homo-dimerization. EMBO J 2008; 27:2006 - 2017
- Desiraju GR, Steiner T. The weak hydrogen bond in structural chemistry and biology. International Union of Crystallography Monographs on Crystallography 1999; 9 New York Oxford University Press
- Pufall MA, Lee GM, Nelson ML, Kang HS, Velyvis A, Kay LE, et al. Variable control of Ets-1 DNA binding by multiple phosphates in an unstructured region. Science 2005; 309:142 - 145
- Cowley DO, Graves BJ. Phosphorylation represses Ets-1 DNA binding by reinforcing autoinhibition. Genes Dev 2000; 14:366 - 376
- Brünger ATAP, Clore GM, DeLano WL, Gros P, Grosse-Kunstleve RW, Jiang JS, et al. Crystallography and NMR system (CNS): a new software system for macromolecular structure determination. Acta Crystallogr Sect D 1998; 54:905 - 921
- Vassylyev DG, Vassylyeva MN, Perederina A, Tahirov TH, Artsimovitch I. Structural basis for transcription elongation by bacterial RNA polymerase. Nature 2007; 448:157 - 162
- DeLano WL. The PyMOL Molecular Graphics System DeLano Scientific 2002; San Carlos CA, USA http://www.pymol.org
- Kopp JL, Wilder PJ, Desler M, Kim JH, Hou J, Nowling T, et al. Unique and selective effects of five Ets family members, Elf3, Ets1, Ets2, PEA3 and PU.1, on the promoter of the type II transforming growth factor-beta receptor gene. J Biol Chem 2004; 279:19407 - 19420
- Wiebe MS, Nowling TK, Rizzino A. Identification of novel domains within Sox-2 and Sox-11 involved in autoinhibition of DNA binding and partnership specificity. J Biol Chem 2003; 278:17901 - 17911
- Ma YG, Rosfjord E, Huebert C, Wilder P, Tiesman J, Kelly D, et al. Transcriptional regulation of the murine k-FGF gene in embryonic cell lines. Dev Biol 1992; 154:45 - 54
- Kopp JL, Wilder PJ, Desler M, Kinarsky L, Rizzino A. Different domains of the transcription factor ELF3 are required in a promoter-specific manner and multiple domains control its binding to DNA. J Biol Chem 2007; 282:3027 - 3041