
Abstract
Kinetochore attachment to the ends of dynamic microtubules is a conserved feature of mitotic spindle organization that is thought to be critical for proper chromosome segregation. Although kinetochores have been described to transition from lateral to end-on attachments, the phase of lateral attachment has been difficult to study in yeast due to its transient nature. We have previously described a kinetochore mutant, DAM1-765, which exhibits lateral attachments and misregulation of microtubule length. Here we show that the misregulation of microtubule length in DAM1-765 cells occurs despite localization of microtubule associated proteins Bik1, Stu2, Cin8, and Kip3 to microtubules. DAM1-765 kinetochores recruit the spindle checkpoint protein Bub1, however Bub1 localization to DAM1-765 kinetochores is not sufficient to cause a cell cycle arrest. Interestingly, the DAM1-765 mutation rescues the temperature sensitivity of a biorientation-deficient ipl1-321 mutant, and DAM1-765 chromosome loss rates are similar to wild-type cells. The spindle checkpoint in DAM1-765 cells responds properly to unattached kinetochores created by nocodazole treatment and loss of tension caused by a cohesin mutant. Progression of DAM1-765 cells through mitosis therefore suggests that satisfaction of the checkpoint depends more highly on biorientation of sister kinetochores than on achievement of a specific interaction between kinetochores and microtubule plus ends.
Acknowledgements
We thank Sue Biggins for helpful advice and critical reading of the manuscript. This work was funded by NIGMS RO1-GM40506 to T.N.D. E.G.M. was supported by NCRR P41-RR011823. M.M.S. and M.M.W. were supported by National Institute of General Medical Sciences grant T32-GM07270.
Figures and Tables
Figure 1 Localization of kinetochore and microtubule-binding components in wild-type (left) and DAM1-765 mutant spindles (right). Each spindle component was GFP-tagged in a strain expressing Nuf2-mCherry. Fluorescence distributions were analyzed as described in Materials and Methods. The black line in each part represents the average Nuf2 (kinetochore) distribution. The center of the x-axis represents the spindle equator, with the spindle poles approximately at positions 0 and 1. The error bars in each part represent the standard error of the mean for the component with the fewest spindles analyzed. (A) Core kinetochore components: Mtw1 (red, MSY255-1C, MSY255-15C), Spc105 (blue, MSY267-2A, MSY267-7D). (B) Plus-end binding proteins: Bik1 (red, pWY266-8B, MSY58), Bim1 (blue, MSY304-18C), Stu2 (green, MSY307-16C, MSY307-18D). (C) Plus-end directed motors: Cin8 (blue, MSY306-5C, MSY305-14C), Kip3 (red, MSY263-23B, MSY263-46D).
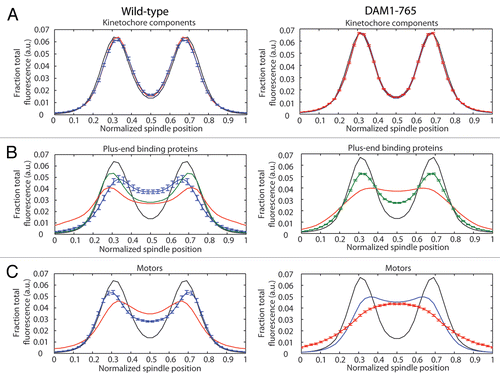
Figure 2 Mad1 does not localize to kinetochores in unperturbed DAM1-765 cells. Kinetochores are labeled with Nuf2-mCherry (red) and Mad1 is labeled with GFP (green). Bars are 1 µm. (A) Mad1-GFP localizes to the nuclear envelope in both wild-type (MSY198-11D) and DAM1-765 (MSY197-3B) cells. (B) Mad1-GFP localizes to unattached DAM1-765 kinetochore clusters generated by treatment with nocodazole, but not to the main kinetochore cluster, which is presumably still attached to the spindle.
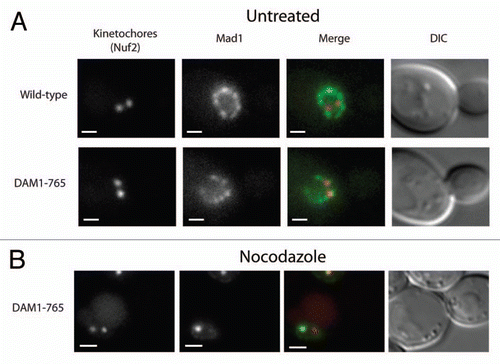
Figure 3 Bub1 localizes to DAM1-765 metaphase kinetochores. Bub1 fluorescence at kinetochores was analyzed as described in Materials and Methods for (A) small-budded cells and (B) metaphase spindles. In merged images, Nuf2-mCherry is in red and Bub1-GFP is in green. Bars are 1 µm. Histograms of total kinetochore (Nuf2) and Bub1 fluorescence for wild-type (solid grey, MSY202-8C) and DAM1-765 (black outline, MSY201-4C) kinetochore clusters are plotted.
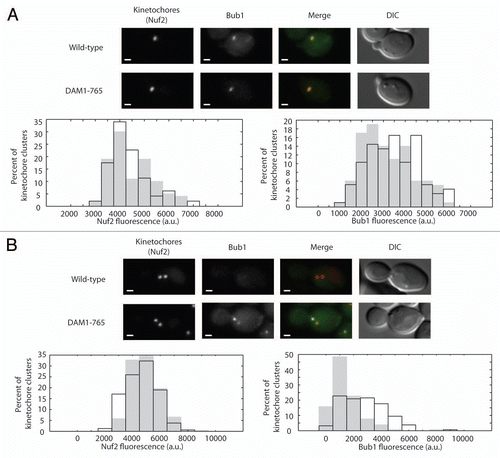
Figure 4 Deletion of BIK1 or KIP3 does not reproduce DAM1-765 levels of Bub1 recruitment to kinetochores. Total Bub1 fluorescence on metaphase spindles was analyzed as described in Materials and Methods. (A) Histograms of total Bub1 fluorescence for wild-type (solid grey, MSY319-1D) and DAM1-765 (black outline, MSY318-7A) spindles are plotted. the DAM1-765 histogram is shifted toward higher Bub1 fluorescence values relative to wild-type. (B) Histograms of total Bub1 fluorescence for bik1Δ (solid black bars, MSY331-2D), wild-type (solid grey bars) and DAM1-765 (black outline) spindles are plotted. The bik1Δ histogram overlaps with wild-type. (C) Histograms of total Bub1 fluorescence for kip3Δ (solid black bars, MSY317-10C), wild-type (solid grey bars) and DAM1-765 (black outline) spindles are plotted. The kip3Δ histogram is shifted relative to wild-type, but does not reproduce the high levels of Bub1 fluorescence measured in DAM1-765 spindles.
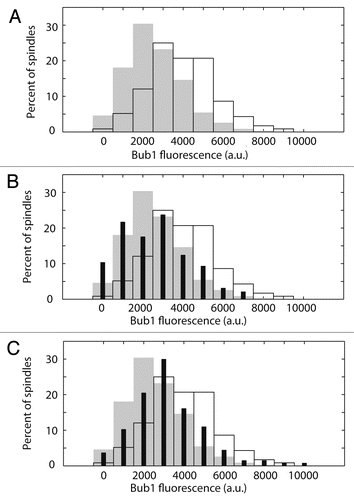
Figure 5 (A) Flow cytometry of DAM1-765 cells reveals a slight cell cycle delay. Cells were synchronized with alpha factor, released at 30°C and re-arrested with alpha factor in the following G1. Samples were fixed for flow cytometry every 10 minutes. The fraction of cells with a 2N DNA content at each time point was determined as described in Materials and Methods. The graph represents the average of two experiments, with the strains aligned according to when 50% of the cells reached a 2N DNA content. Wild-type, dashed line, circles (MSY216-1A); DAM1-765, solid line, squares (MSY165-19B). (B) DAM1-765 cells delay in response to lack of tension caused by mcd1-1 and the delay is Ipl1-dependent. Cells were synchronized at 25°C with alpha factor, released at 37°C and re-arrested with alpha factor in the following G1. Samples were fixed for flow cytometry every 10 minutes. DAM1-765 mcd1-1, solid line, squares (MSY289-32D), DAM1-765 mcd1-1 ipl1-321 dashed line, circles (MSY312-12B).
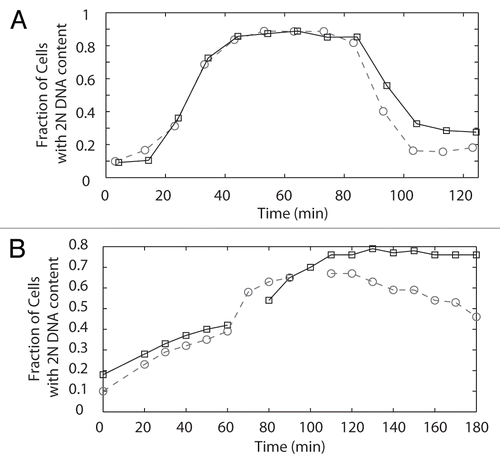
Figure 6 (A) Bir1 localizes between metaphase kinetochores in both DAM1-765 and wild-type cells. Wild-type and DAM1-765 strains carrying Nuf2-CFp and Bir1-Venus (MSY279-6C and MSY279-7B) were imaged and fluorescence distributions analyzed as described in Materials and Methods. The solid lines represent average Nuf2 (kinetochore) fluorescence and the dashed lines represent average Bir1 fluorescence. Error bars are the standard error of the mean. (B) DAM1-765 rescues ipl1-321 temperature-sensitivity. The indicated yeast strains were grown in liquid culture at 25°C to mid-log phase (MSY216-1A, MSY165-19B, PWY261-2B, pWY261-3D, SFY233-2D). Cells were diluted to a density equal to approximately 5 Klett units. 5-fold serial dilutions were spotted (3 µl per spot) onto YPD plates and grown at the indicated temperatures for 2–3 days.
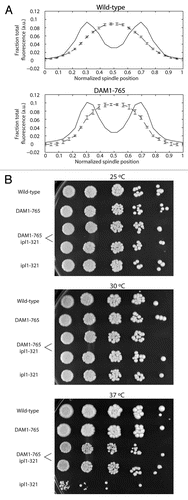
Table 1 Yeast strains