
Abstract
Ears boost their sensitivity by means of active, force-generating processes to augment the minute vibrations induced by soft sounds. These processes can alter auditory frequency–tuning in a level-dependent way. In the antennal hearing organ of Drosophila, for example, the active process shifts the best-frequency (BF) of the antennal sound receiver when the sound intensity is varied, tuning the receiver to conspecific songs. Here we show that this level-dependent tuning can be reproduced by an active transduction model as proposed for vertebrate hair cells and the Drosophila ear. We further show that the direction of the frequency shift depends on the system to which the molecular modules for auditory transduction connect: If this system is mass-less such as the sensory hair bundles of bullfrog saccular hair cells, the BF of the displacement response will increase as the sound intensity declines. Conversely, BF will decrease with declining intensity if the transduction modules couple to inertial systems such as the fly’s antennal sound receiver or cupulae in the fish lateral line.
Acknowledgements
This work was supported by a research fellowship from the Volkswagen Foundation (to Björn Nadrowski), grants from the Volkswagen Foundation and the German BMBF Bernstein Network for Computational Neuroscience (to Martin C. Göfert), and a start-up grant from the University of Göttingen.
Figures and Tables
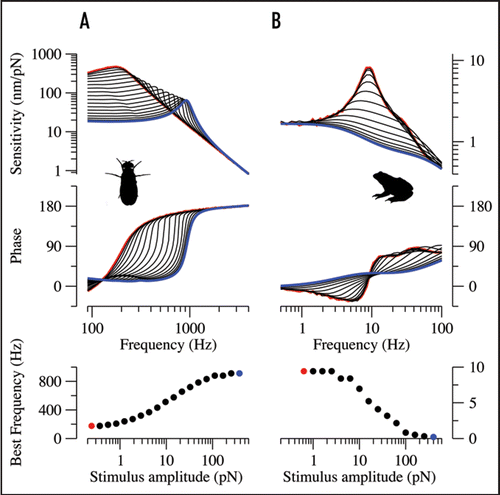
Figure 1 Numerically simulated response functions of the Drosophila sound receiver (A) and the sensory hair bundle of bullfrog saccular hair cells (B) using models and parameter values from references 12 (‘fly 6’) and 18, respectively. Response functions are shown for different forcing amplitudes (for stimulus forces, see lower panel). Blue lines and circles correspond to the strongest stimuli, red lines and circles to the weakest stimuli. Upper, amplitude, which provides a measure of sensitivity. Middle: phase. Lower, BF as a function of the stimulus force. Both systems display nonlinear regimes in which the BF continuously shifts with the amplitude of forcing, yet their BFs shift in different directions.
Addendum to: