Abstract
It is still not clear how organisms regulate the size of appendages or organs during development. During development, Dictyostelium discoideum cells form groups of ~2x10⁴ cells. The cells secrete a protein complex called counting factor (CF) that allows them to sense the local cell density. If there are too many cells in a group, as indicated by high extracellular concentrations of CF, the cells break up the group by decreasing cell-cell adhesion and increasing random cell motility. As a part of the signal transduction pathway, CF decreases the activity of glucose-6-phosphatase to decrease internal glucose levels. CF also decreases the levels of fructose-1,6-bisphosphate and increases the levels of glucose-6-phosphate and fructose-6-phosphate. In this review, we focus on how a secreted signal used to regulate the size of a group of cells regulates many basic aspects of cell metabolism, including the levels of pyruvate, lactate, and ATP, and oxygen consumption.
Acknowledgements
Richard H. Gomer was an Investigator of the Howard Hughes Medical Institute. This work was supported in part by the Dongguk University research fund of 2009 and by NIH GM074990.
Figures and Tables
Figure 1 Cells with different levels of extracellular CF have different levels of pyruvate, lactate, lactate formation in lysates, and ATP. countin−, wild-type (WT) and smlA− cells were starved by shaking in PBM, harvested at the times indicated, and the levels of metabolites were measured in the three cell lines. (A) Pyruvate levels. At 0 hours, the differences between smlA− and WT cells, and between smlA− and countin− cells were significant. At 2 hours of starvation, the difference between smlA− and countin− cells was significant. In addition, a t-test indicated that the difference at 4 hours between smlA− and countin− cells was significant. Values are means ± SEM from at least 4 independent assays. (B) Lactate levels. The measured values of lactate in smlA− cells at 2, 4 and 6 hours of starvation were 8.9 ± 7.7, 5.9 ± 6.0 and 9.7 ± 8.4 pmol/mg protein, respectively. At 0 and 2 hours, the differences between smlA− and WT, WT and countin−, and smlA− and countin− cells were significant. At 4 and 6 hours of starvation, the differences between smlA− and WT, and smlA− and countin− cells were significant. Values are means ± SEM from at least 6 independent assays. (C) The formation of lactate in lysates. The negative values for smlA− at 2, 4 and 6 hours indicate that lactate was used faster than it was made. At 0 hours, the difference between smlA− and WT lysates was significant, and at 2 hours of starvation, the differences between smlA− and WT, WT and countin−, and smlA− and countin− lysates were significant. At 4 and 6 hours of starvation, the differences between smlA− and WT, and smlA− and countin− lysates were significant. Values are means ± SEM from 6 independent assays. (D) ATP levels. At 4 hours of starvation, the differences between smlA− and WT, WT and countin−, and smlA− and countin− cells were significant. At 6 hours of starvation, the differences between smlA− and WT, and smlA− and countin− cells were significant. Values are means ± SEM from five independent assays.
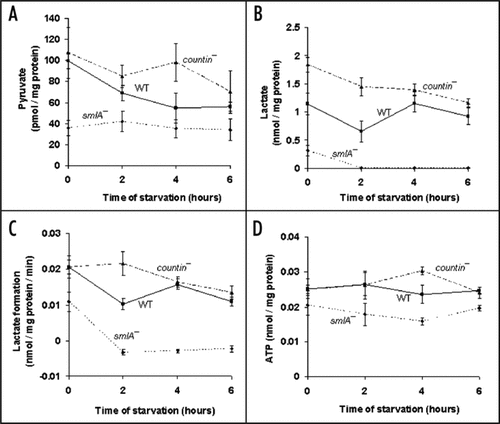
Figure 2 Cells with different amounts of extracellular CF have different levels of oxygen consumption. countin−, wild-type and smlA− cells were starved by shaking in PBM, and harvested at the times indicated. The oxygen consumption was then measured; a high decrease in oxygen saturation corresponds to a high O2 utilization by cells. At 2 and 4 hours of starvation, the differences between smlA− and WT, WT and countin−, and smlA− and countin− cells were significant with p < 0.05. Values are means ± SEM from three independent assays.
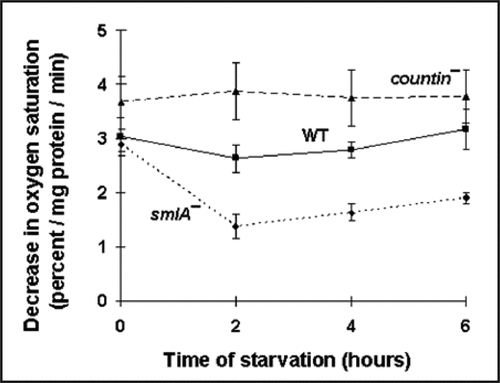
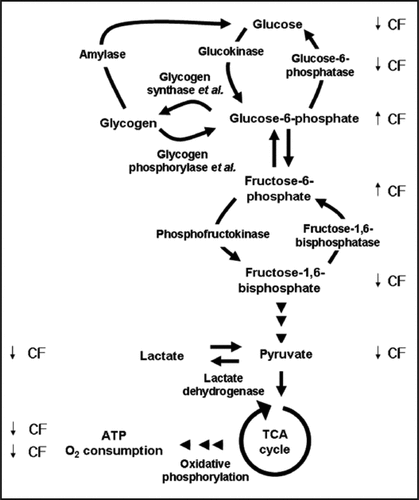
Figure 3 The effects of CF on metabolism. Glycogen phosphorylase and glycogen synthase catalyze part of the reactions that are shown in the drawing, and are therefore noted as enzyme et al. The levels of glucose, glucose- 6-phosphate, fructose-6-phosphate and fructose-1,6-bisphosphate were measured by Jang et al.Citation22 and Jang and Gomer.Citation28 The arrows indicate the effects of CF on the levels of each intermediates or metabolites (up arrow for increasing the levels, and down arrow for decreasing the levels).