
Abstract
Declines in the stocks of domesticated honey bees in some countries have been attributed to disease, which is at odds with an increasing global trend in the total number of hives. Based on data on annual growth rates in hive numbers and honey production for 87 countries, we tested the hypothesis that geographic heterogeneity in the growth of the domesticated honey-bee population can be attributed to disease. In contrast to predictions of this hypothesis, changes in honey production varied in proportion to changes in hive number. Also, growth in honey production was not more spatially heterogeneous than growth in hive numbers, as expected under a scenario of contagious pests. We argue that although disease aggravates production costs, it has less effect on changes in national hive numbers than labor costs, so that geographic variation in the growth of the global honey-bee stock reflects the global division of human labor that is a hallmark of economic globalization, rather than persistent and pervasive biological causes.
Acknowledgements
We thank Vanina Chalcoff, Lucas Garibaldi, Carolina Morales, Malena Sabatino and Mariana Tadey for useful discussion. Partial funding by the Argentina National Council for Research (PIP 5066) (M.A.A.), the National University of Comahue (B126/04) (M.A.A.) and the Natural Sciences and Engineering Research Council of Canada (L.D.H.) is acknowledged.
Figures and Tables
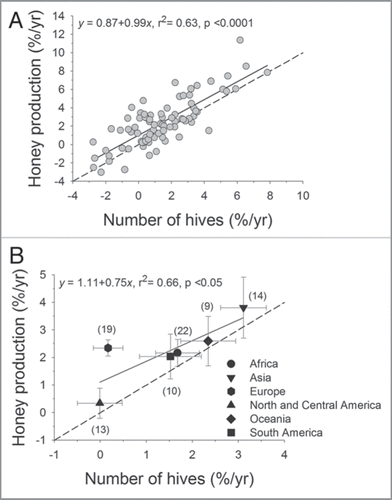
Figure 1 Relations between the annual growth rates in honey-bee stocks and honey production for (A) 87 countries and (B) six continents. Solid lines indicate the fitted linear regressions and dashed lines depict equal growth in both variables. In (B), points represent continental means ± SE, and sample sizes (number of countries) are provided in parentheses.
Addendum to: