Abstract
The F-BAR domain is emerging as an important player in membrane remodeling pathways. F-BAR domain proteins couple membrane remodeling with actin dynamics associated with endocytic pathways and filopodium formation. Here, we provide a comprehensive analysis of F-BAR domain proteins in terms of their evolutionary relationships and protein function. F-BAR domain containing proteins can be categorized into five subfamilies based on their phylogeny which is consistent with the additional protein domains they possess, for example, RhoGAP domains, Cdc42 binding sites, SH3 domains, and tyrosine kinase domains. We derive a protein-protein interaction network suggesting that dynamin1/2, N-WASP, Huntingtin, intersectin and Cdc42 are central nodes influencing F-BAR domain protein function.
Figures and Tables
Figure 1 Evolutionary relationships of F-BAR domain-containing proteins (tree generated with MEGA4,Citation49). Structural alignment of three available crystal structures of FBP17, CIP4 and FCHO2 (PDBs: 2EFL, 2EFK and 2V0O) was created using MUSTANGCitation50 implemented in YASARA.Citation51 The resulting structure-based alignment was used as seed to align orthologues, retrieved from OMA,Citation52 and each of the three seed proteins (seed-driven alignment was generated by MAFFT using EINSI settings for multidomain proteins).Citation53 Fragmentary sequences were removed and the resulting alignment was trimmed at the conserved borders of the structural seed alignment in JalviewCitation54 and using Cd-hit,Citation55 and overall redundancy was removed by allowing a maximal sequence identity of 90%. This alignment was converted to HMM, calibrated (seed = 0) and searched with HMMerCitation56 against UniRef100,Citation57 (Release 15.9 which consists of 10,011,983 entries). The resulting 744 hits with E-values below 0.01 were then added to the alignment (as before with seed and borders from structural alignment and redundancy removal). This alignment was then used after conversion to HMM for a second iteration of the search against UniRef100. This HMMer search returned 1287 proteins with E-values below 0.01. For clarity of the representation of phylogenetic relationships we selected only proteins from nine representative species (Saccharomyces cerevisiae, Schizosaccharomyces pombe, Caenorhabditis elegans, Drosophila melanogaster, Xenopus tropicalis, Gallus gallus, Danio rerio, Mus musculus and Homo sapiens) which reduced the 1287 proteins to 305 for further analysis. Next, we generated a neighbour joining treeCitation58 based only on the curated alignment of the F-BAR domain regions with pairwise gap deletion, JTT as distance measure and 200 bootstrapCitation59 replicates (generated within MEGA4,Citation49). Sequence and domain analysis of the full length proteins was carried out using the ANNIE resourceCitation60 and CD-Search.Citation61 Domain architecture images were created using the MyDomains image creator (http://www.expasy.ch/tools/mydomains/). Paralogous relationships were inferred for two proteins from the same organism by using T-BLASTN against the organism’s genome and confirming non-overlapping genomic/chromosomal location as mapped with the Map Viewer tool from NCBI.Citation62,Citation63 Additional files that are provided as supplementary material include the sequence accession numbers and names of the 305 F-BAR proteins used for the phylogenetic tree, as well as the key to the gene names used in the interaction network. Alignments and HMMs are available on request from the authors.
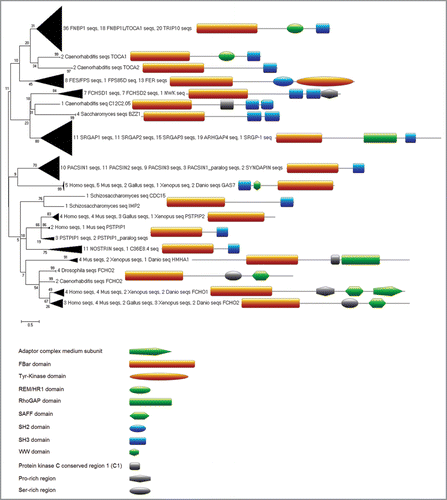
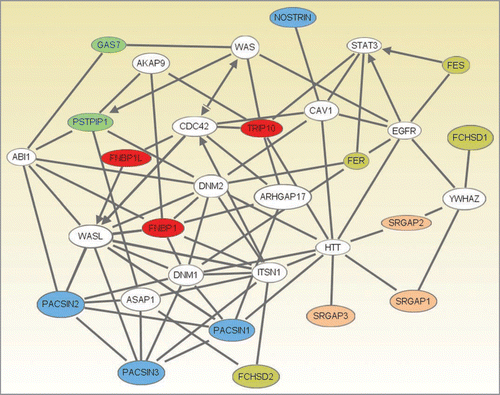
Figure 2 An interaction network between several F-BAR domain-containing proteins generated using Ingenuity Pathway Analysis (Ingenuity® Systems, www.ingenuity.com). Genes or gene products are represented as nodes, and the biological relationship between two nodes is represented as a line. All lines are supported by at least one reference from the literature, from a textbook, or from canonical information stored in the Ingenuity Pathways Knowledge Base. Human, mouse and rat orthologues of a gene are stored as separate objects in the Ingenuity Pathways Knowledge Base, but are represented as a single node in the network. The F-BAR domain-containing proteins are colored according to their categorization into one of five subfamilies. Subfamilies (colour): 1, pink; 2, olive; 3, red; 4, blue; 5, green, see text for details. Network Generation. A data set containing identifiers for the F-BAR domain-containing proteins was uploaded into Ingenuity Pathway Analysis (Ingenuity Systems, www.ingenuity.com). The identifiers were mapped to their corresponding gene objects in the Ingenuity Pathways Knowledge Base. Networks of these genes were then algorithmically generated based on their connectivity. All five generated networks were merged and the resulting network was grown to form a larger network, using the all molecules option. Molecules that do not directly interact with F-BAR domain-containing proteins were removed. From the 20 F-BAR domain-containing genes that were found in the merged networks, PSTPIP2, FCHO2, FCHO1 and ARHGAP4 were removed as they were linked to the rest of the network by only a single line via genes that are non-specifically connected to several hundreds of other genes.