
Abstract
The power of eukaryote genomics relies strongly on taxon sampling. This point was underlined in a recent analysis of red algal genome evolution in which we tested the Plantae hypothesis that posits the monophyly of red, green (including plants), and glaucophyte algae. The inclusion of novel genome data from two mesophilic red algae enabled us to robustly demonstrate the sisterhood of red and green algae in the tree of life. Perhaps more exciting was the finding that >1800 putative genes in the unicellular red alga Porphyridium cruentum showed evidence of gene-sharing with diverse lineages of eukaryotes and prokaryotes. Here we assessed the correlation between the putative functions of these shared genes and their susceptibility to transfer. It turns out that genes involved in complex interactive networks such as biological regulation and transcription/translation are less susceptible to endosymbiotic or horizontal gene transfer, when compared to genes with metabolic and transporter functions.
Acknowledgments
This research was supported by grants from the National Science Foundation (EF 08-27023, DEB 09-36884). We acknowledge the support of our colleagues in the RedToL project (lead PI, Hwan Su Yoon).
Figures and Tables
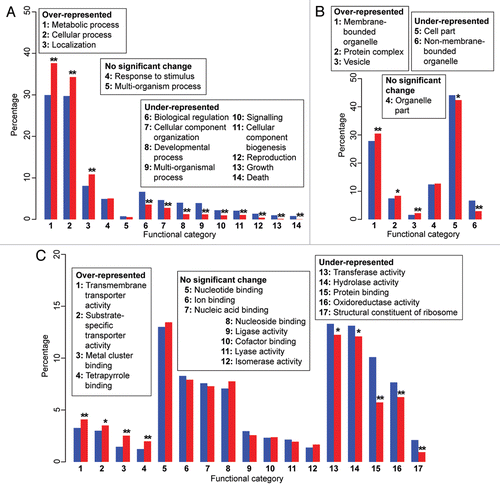
Figure 1 Annotated functional categories of proteins encoded by Porphyridium cruentum. The charts are organized based on three principal categories in the Gene Ontology database: (A) biological process, (B) cellular component and (C) molecular function. The blue bars show the proportional representation of the functional categories (in percentage) across the overall dataset (8,082 annotated genes), whereas the red bars show the proportional representation of the same functional categories (in percentage) among the 1,808 genes implicated in E/HGT. The categories are numbered independently for each panel, as shown in the legends. Significance of over- or under-representation is represented by single (p ≤ 0.05) and double asterisks (p ≤ 0.01), as inferred based on the approach of Chan et al.Citation17
Addendum to: