Abstract
Regenerating gene 1A (REG1A) plays an important role in tissue regeneration and in cell proliferation in epithelium origin tumors; however, its role in melanoma has not been explored in details. The objective of this study was to identify whether REG1A is expressed in cutaneous melanoma and if REG1A expression status can predict prognosis in cutaneous melanoma patients with metastasis. We also determined whether epigenetic regulation of the promoter region regulates REG1A expression. AJCC stage III cutaneous melanoma specimens with clinically well annotated stage III lymph node melanoma metastasis tissue microarray were assessed by IHC. MALDI-TOF-mass spectrometry and HM450K array were used to identify REG1A promoter region CpG site methylation. Chemotherapeutic agent response by melanoma cells as related to REG1A protein expression was assessed. Post-surgery melanoma patients followed by adjuvant chemotherapy with high REG1A expression had a significantly better prognosis (disease-specific survival) compared with patients with low REG1A expression (log rank test; p = 0.0013). The demethylating reagent 5-Aza-2′-deoxycytidine activated REG1A promoter region resulting in enhanced REG1A mRNA and protein expression in melanoma cell lines. Promoter region CpG methylation was shown to regulate REG1A expression in melanoma cells. Moreover, melanoma lines with high REG1A mRNA expression were more susceptible to Dacarbazine and Cisplatin, as compared with those with low REG1A mRNA expression. In conclusion, REG1A expression status may be useful as a biomarker in melanoma patients for sensitivity to these chemotherapeutic agents. The epigenetic regulation of the REG1A promoter region may offer a potential therapeutic approach to improve chemotherapy for metastatic melanoma patients.
Introduction
Cutaneous melanoma is poorly responsive in general to radio- and chemo-therapy; hence, resection of the primary tumor and regional lymph nodes (LN) has been considered as effective curative approach in early stage melanoma treatment.Citation1,Citation2 In metastatic melanoma, stage IIIb and IIIc patients have been treated with surgery followed by adjuvant chemotherapies, which are accompanied by major side effects and limited durable response.Citation3 Although recent clinical trials showed that new-targeted drugs (i.e., Vemurafenib and Ipilimumab) can improve disease outcome of stage IV metastatic melanoma patients,Citation4,Citation5 the efficacy of these drugs as adjuvant treatment for long-term survival is not known. Durable response to chemotherapy remains a significant problem in metastatic melanoma, and significant improvement is still needed to prolong median survival beyond five years in stage IIIb/c and IV melanoma patients. A reliable biomarker for chemosensitivity to existing key chemotherapy agents (Cisplatin and Dacarbazine) could help melanoma patients and clinicians to make better choices about adjuvant therapy.
The human regenerating gene (REG) family belongs to the lectin superfamily and encodes five small, secreted proteins, including REG1A. It was originally isolated from pancreatic islet β cells as an endogenous growth factorCitation6,Citation7 and was subsequently shown to have an important role in tissue regeneration as well as cell proliferation in the mucous of the gastrointestinal tract.Citation8,Citation9 Recent evidence demonstrated that aberrant REG1A expression is associated with carcinogenesis in several organs, such as esophagus,Citation10,Citation11 stomach,Citation12,Citation13 colon,Citation14,Citation15 pancreas,Citation16 liver,Citation17 lung,Citation18 breast,Citation19 and bladder.Citation20
REG1A can be a prognostic factor in patients with T4 locally advanced squamous cell esophageal cancer treated with definitive chemoradiotherapy without surgery,Citation10,Citation11 treated with neoadjuvant chemoradiotherapy followed by curative esophagectomy, and in patients with T2–T4 squamous cell esophageal cancer treated with esophagectomy followed by adjuvant chemotherapy.Citation21 These evidences suggest that REG1A is also a potential sensitivity biomarker to chemotherapy and radiotherapy in squamous cell esophageal cancer. There are no reports on REG1A expression in cutaneous metastatic melanomas to date as all past studies have been mostly performed on epithelium origin tumors.
CpG site hypermethylation can cause silencing of tumor-related genes in various types of cancers.Citation22 Aberrant CpG island hypomethylation can result in the activation of these genes. Epigenetic aberrations have been shown to be important in the regulation of oncogenes and tumor-related gene expression.Citation23-Citation27
Our study focused on the analysis of REG1A expression in melanomas and response to known melanoma chemotherapy drugs. We hypothesized that CpG methylation status in the promoter region regulates the expression of REG1A in melanoma cells and that REG1A expression has the potential to be a prognostic and/or chemosensitive biomarker in patients with metastatic melanoma.
Results
REG1A IHC analysis and disease outcome
Immunohistochemistry (IHC) analysis of formalin-fixed melanoma LN metastasis tissue microarray (TMA) specimens (n = 126) was performed. As these specimens showed that there were variable levels of REG1A expression in melanoma cells; we assessed the relation between REG1A protein expression and long-term survival. The mean IHC staining intensity (MSI) for the 126 patients was 25.8 ± 12.4 (range 5.8 to 62.6). We set the MSI median value 22.9 as a cut-off point to divide the 126 patients into two groups: REG1A-high patients (≥ 22.9, n = 63) and REG1A-low melanoma patients (< 22.9, n = 63). Patient characteristics are summarized in . Because adjuvant group melanoma patients were diagnosed with more advanced stage (p = 0.009) (Table S1) and showed poor and disease-free survival (DFS; p < 0.0001) (Fig. S1), we analyzed the specimens of the surgery group alone and adjuvant groups separately.
Table 1. Clinicopathological features of surgery group and adjuvant group
Analysis of 10-y disease-specific survival (DSS) and DFS showed that REG1A-high patients had a significantly better prognosis in DSS compared with the low patients only among adjuvant group (n = 27) (p = 0.0013) but not among all 126 patients or surgery alone group (n = 99) ().
Figure 1. DSS and DFS of 126 AJCC Stage III melanoma patients. (A–C), Disease-specific survival (DSS) and (D–F), disease-free survival (DFS) of AJCC stage III melanoma patients. (A and D) all patients (n = 126), (B and E) adjuvant group (n = 27), and (C and F), surgery treated group (n = 99).
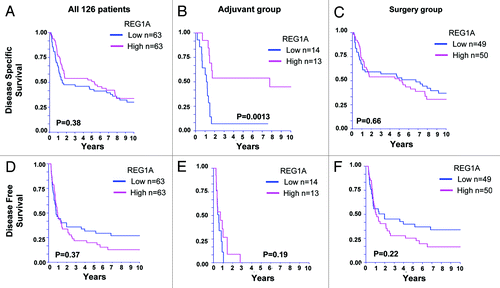
Univariable and stepwise multivariable Cox PH regression analysis showed that only pathological stage showed statistically significant association to DSS in the surgery alone group (). However, in the adjuvant group, REG1A was the only significant covariate that showed association to 10-y DSS (p = 0.003 HR 4.3, 95%CI 1.6–11.4). The power was 81.6% at 1.7% significance level adjusting for the multiple comparisons (in the overall group, adjuvant group, and surgery only group, ). If no multiple comparison adjustment was performed, the power was 90% at 5% significance level.
Table 2A. : DSS - Surgery group
Table 2B. DSS - Adjuvant group
Changes on DNA methylation landscape of the genomic region encoding REG1A gene
To evaluate methylation changes of REG1A gene during melanoma metastasis, we analyzed 32 specimens representing different stages of melanoma by using Illumina Infinium HumanMethylation450 BeadChip (HM450K) arrays. We mapped the chromosome 2 region (chr2:79 347 545–79 350 567) encoding REG1A to evaluate changes in the methylation landscape that can provide insight of REG1A epigenetic aberrations. Unsupervised hierarchical cluster analysis revealed the existence of two main clusters (Fig. S2A). Cluster A contains specimens with low level of DNA methylation in this region, where we identified a high frequency of stage IV specimens. Significant lower DNA methylation level of REG1A gene was observed in metastatic melanomas compared with normal tissue (Wilcoxon; p = 0.001) and primary melanomas (Wilcoxon; p = 0.03, Fig. S2B). No significant differences were observed between DNA methylation level of normal melanocytes and primary melanomas (Wilcoxon; p = 0.16). A similar trend was observed for each analyzed CpG site (Fig. S2C).
Demethylation upregulates REG1A mRNA and protein expression
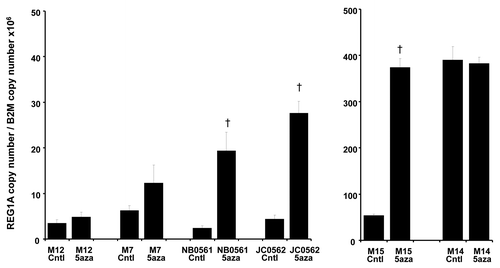
To assess whether methylation was one of the regulatory mechanisms for REG1A expression, cell lines were treated with the demethylating agent, 5-Aza-2′-deoxycytidine (5-Aza), and then assessed by reverse transcription-quantitative PCR (RT-qPCR) (). After 5-Aza treatments, REG1A mRNA expression status was upregulated in 4 of 6 melanoma lines, of which 3 (NB0561, JC0562, M15) were significantly upregulated (Student t test; p < 0.05).
Figure 2. The mRNA expression of REG1A mRNA of melanoma lines. The mRNA expression of 6 melanoma lines treated or not treated with 5-Aza was evaluated by RT-qPCR. After 5-Aza treatments, 4 of 6 lines showed upregulated REG1A mRNA expression. One line (M14), which had high REG1A expression, did not show upregulated REG1A mRNA expression after 5-Aza treatment. Error bar shows standard deviation of 3 cell lines. § p < 0.05.
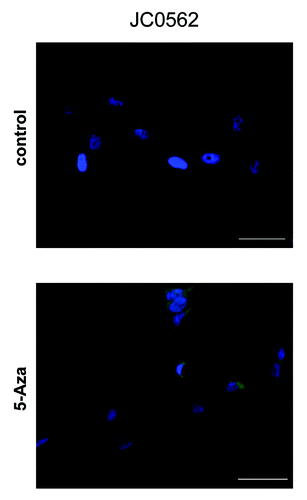
In further assessment, REG1A protein expression was analyzed by fluorescence IHC. Melanoma cell line JC0562 was treated and non-treated with 5-Aza. JC0562 treated with 5-Aza showed higher fluorescence and enhanced cytoplasmic staining of REG1A protein compared with controls without 5-Aza (). These results were consistent with RT-qPCR results.
Figure 3. The REG1A protein expression of melanoma lines. The REG1A protein expression of control and 5-Aza treated melanoma lines were evaluated by fluorescence immunocytochemistry analysis. REG1A protein was labeled with Alexa Fluor 488 (green) and nuclei were labeled with DAPI (blue). (A) Control line (DMSO only; MS = 42.8%,). (B) corresponding 5-Aza treated lines (MS = 17.8%). Bar represents 20 μm. MS(%) = CpG #6 Methylation Status
To determine whether methylation of REG1A gene in melanoma lines was related to protein level, western blot analysis was performed. High REG1A expression in M14 and M15 cells and low REG1A expression in JC0562 and NB0561 was observed (Fig. S3).
Methylation of REG1A gene promoter region
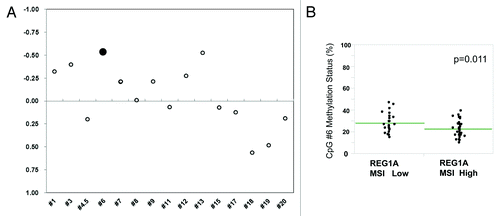
We performed quantitative MassARRAY methylation analysis of 16 CpG sites (from -2055 to +117) of the promoter region of REG1A using the six established melanoma lines. The methylation pattern in REG1A promoter region varied among the six melanoma lines treated and non-treated with 5-Aza. In the six lines assessed, 73.6% of CpG sites (mean, range 50.0–91.7%) showed lower methylation status after 5-Aza treatment compared with without 5-Aza treatment (Fig. S4A-D). Integrative mRNA expression and DNA methylation analysis demonstrated that CpG #6 (-1886bp) had the best inverse correlation between mRNA expression and methylation status among these 16 CpG sites in the REG1A promoter region (Pearson’s r = -0.53, p < 0.05; ). Using this approach, we confirmed that M14, which showed high mRNA expression even without 5-Aza treatments, showed low methylation level (13.3%) of CpG #6 compared with the three cell lines significantly affected by 5-Aza treatment (42.7% JC0562, 20.7% M15 and 29.7% NB0561). M14 had low methylation status of CpG sites in the REG1A promoter region including CpG #6. On the other hand, JC0562 had high methylation level of CpG sites including CpG #6 which was decreased after 5-Aza treatment. Taken together, these results indicated that REG1A gene expression is regulated by gene promoter DNA methylation in cutaneous melanoma cell lines.
Figure 5. Methylation status of CpG#6 among 60 tissue specimens from TMA. (A) The Pearson’s correlation value between CpG methylation ratio (MassARRAY) and mRNA expression (qRT-PCR) of control and 5-Aza treated 6 melanoma lines (JC0562, NB0561, M12, M7, M15, M14) was calculated at each individual CpG island. Closed circle (CpG#6) represents lowest Pearson value (r = -0.53). (B) Methylation status of CpG#6 among 30 REG1A MSI high and 30 MSI Low samples from TMA slide. REG1A-high expressing tumors showed significantly lower methylation status compare with REG1A-low expressing tumors (p = 0.0105).
CpG methylation status and protein expression in melanoma tumors
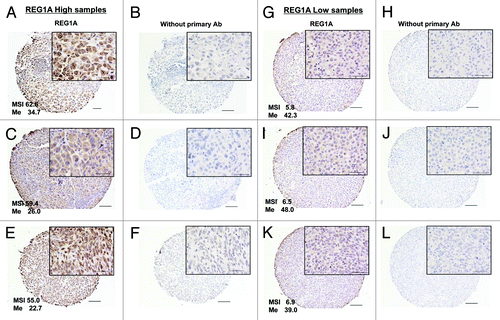
The relation between CpG site methylation status of the REG1A promoter region and REG1A protein expression was assessed for each individual melanoma tumor in the TMA. Thirty REG1A-MSI-high tumors (MSI 37.5–62.6, mean 43.0) and 30 REG1A-MSI-low tumors (MSI 5.8–15.5, mean 11.7) were assessed (). The REG1A-MSI-high tumors showed a significantly lower methylation status of CpG island #6 compared with the REG1A-MSI-low tumors (p = 0.011) ().
Figure 4. REG1A expression analysis by IHC LN TMA. Whole TMA core views are 100x and partial views are 400x. Bar represents 100 μm in 100x and 20um in 400x. (A, C, and E); Strong REG1A expression tumors and respective MSI values showing low Me (%). (B, D, and F) Controls without primary Ab staining of (A, C, and E), respectively. (G, I, and K) Weak REG1A expression tumors and respective MSI values showing high Me (%). (H, J, and L) Controls without primary Ab IHC staining from the tumors of (G, I, and K), respectively. Me (%): CpG #6 methylation status.
REG1A correlation with chemosensitivity
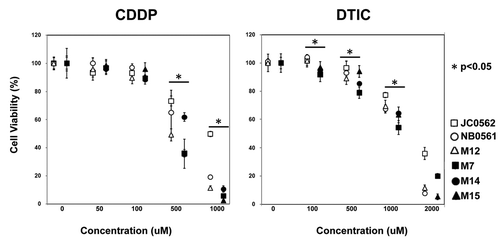
Melanoma cell lines with higher REG1A mRNA expression (M7, M14 and M15) showed significantly lower cell viability after 24h with 500 µM (p = 0.015) and 1 mM (p = 0.001) Cisplatin (CDDP; Sigma-Aldrich) treatment compared with melanoma lines with lower REG1A expression (JC0562, NM0561 and M12) (). Similarly, melanoma lines with higher REG1A mRNA expression also showed significant lower cell viability compared with melanoma lines with lower REG1A expression after 100 µM (p = 0.002), 500 µM (p = 0.047) and 1 mM (p = 0.002) Dacarbazine (DTIC; Sigma-Aldrich) treatment.
Figure 6. Chemosensitivity of melanoma lines for DTIC or CDDP treatment. Variable cell number after 24hrs treatments with DTIC (0 to 2mM) or CDDP (0 to 1mM) was evaluated with cell proliferation assay. Three closed and 3 open markers represent REG1A mRNA higher melanoma lines and lower lines, respectively. Luminescence intensity of each control (DMSO alone) defined as 100%. Error bar shows standard deviation of 3 cell lines. *p < 0.05 (REG1A mRNA higher melanoma lines vs lower lines).
Discussion
In this study, we established that the expression of REG1A is heterogeneous and is regulated by gene promoter DNA methylation status in cutaneous melanoma cell lines and clinical tumor specimens. DNA hypomethylation was more frequently observed in metastatic melanoma compared with primary and nevi specimens. Further, REG1A-MSI-high expression status was the only significant factor for the better prognosis (10-y DSS) among AJCC stage III melanoma patients who were treated with surgery followed by adjuvant chemotherapy. We also confirmed that melanoma cell lines with high REG1A mRNA expression had higher chemosensitivity compared with low REG1A expression cell lines. These results suggest that REG1A expression status has the potential to be a useful chemosensitive biomarker in patients with metastatic melanoma.
We previously reported that DNA methylation status of promoter region of tumor-related genes is closely related to gene expression and prognosis of melanoma patients.Citation25-Citation27 This approach was successfully used previously by our groups with MassARRAY analysis in colonCitation28 and breast cancer tumors.Citation29
Among the melanoma patients in this study, all adjuvant group patients were pathologically diagnosed as AJCC stage IIIb or IIIc with multiple LN metastasis and treated with adjuvant chemotherapy after surgery. On the other hand, among the surgery group, 72% were diagnosed as stage IIIb and IIIc but were not treated with adjuvant chemotherapy because of their higher age (mean = 56 y), compared with adjuvant patients (mean = 51y) and their clinical conditions after surgery. Therefore, the number of patients censored adjuvant group was 27. In comparing adjuvant group patients with worse DSS and DFS to surgery group, REG1A-MSI-high patients showed similar DSS rates as surgery treated group. However, REG1A-MSI-low patients had an extremely poor DSS (< 10% of 5-y DSS). Taken together, our results indicated that REG1A status has the potential to predict chemosensitivity, and therefore may be helpful in selection of patients that will benefit from adjuvant chemotherapy based on CDDP and DTIC. However, there is a need for a prospective multicenter study on a larger cohort of adjuvant chemotherapy patients to validate this conclusion.
We elucidated that REG1A-high melanoma cells were responsive to both of CDDP and DTIC. CDDP is the first member of a platinating agent and exerts anticancer effects via multiple mechanisms, yet its most prominent mode of action involves the generation of DNA lesions followed by the activation of the DNA damage response and the induction of mitochondrial apoptosis.Citation30 DTIC is a second-generation DNA alkylating agent and exhibits cell cycle dependent anticancer activity by interfering with DNA replication.Citation31 Cancer cells with high doubling rate are generally considered to be more sensitive to chemotherapy because checkpoint dysfunction leads to enhanced cell cycle progression.Citation32 A recent report showed that REG1A activates cyclin D1 signaling and is correlated with cell cycle progression.Citation33 Moreover, other cancers showed close relationship between REG1A expression and cancer progression.Citation12-Citation20
The HM450K array analysis showed that metastatic melanoma cells tend to have lower REG1A DNA methylation level than early stages of melanoma and benign nevi. This low DNA methylation was widely associated with an increment in the mRNA expression level. Our study revealed that REG1A-high melanoma cells acquire high growth rate and become more sensitive to CDDP and DTIC treatment.
In conclusion, the present study demonstrates that promoter methylation is one of the regulatory mechanisms for REG1A expression in melanoma lines and in clinical tumor specimens. REG1A expression status regulated by epigenetic activity may be useful as a chemosensitive biomarker in patients with cutaneous metastatic melanoma.
Materials and Methods
Cell lines
Six cutaneous melanoma cell lines (M7, M12, M14, M15, NB0561, JC0562) were established at JWCI from melanoma metastasis. Cell lines were cultured in RPMI 1640 (Mediatech, Inc., Manassas, VA), supplemented with 10% (v/v) heat-inactivated fetal bovine serum (Gemini Bio-Products), and antibiotics (100 U/ml penicillin and 100 μg/ml streptomycin) and maintained in a humidified atmosphere of 5% CO2, 95% air at 37ºC.
5-Aza-2’-deoxycytidine (5-Aza) treatment
All six melanoma cell lines were seeded (2 × 10⁵ cells) in 10-cm dishes 24 h before treatment with 10μM of 5-Aza (Sigma-Aldrich) for 48 h. The DNA and RNA were used for quantitative DNA methylation analysis and RT-qPCR analysis, respectively, as previously described.Citation26,Citation27
DNA bisulfite treatment and quantitative DNA methylation analysis
Quantitative DNA methylation analysis was performed using Matrix-Assisted Laser Desorption/Ionization Time-of-flight Mass Spectrometry (MALDI-TOF-MS) as previously described.Citation28,Citation29 Five primer sets were designed with EpiDesigner (SEQUENOM) to assess methylation status of the promoter region from -2,055 bp to +117 bp (intron 1) of REG1A (Fig. S5). Sixteen of 20 CpG sites in the promoter region could be evaluated semi-quantitatively with the five primer sets (Fig. S6A). Primers REG1A05 was designed to target CpG site (CpG island #6).
Reverse transcription-quantitative PCR
Details of RT-qPCR were described in elsewhere.Citation29 Primers and probes were designed using Oligo6 (Molecular Biology Insights, Inc.) (Fig. S6B). Real-time PCR was performed in a 384-well ABI PRISM Optical Reaction Plate (Applied Biosystems) using the ABI 7900HT Fast Real-Time PCR System (Applied Biosystems) in blinded fashion. Minimum Information for Publication of Quantitative Real-Time PCR Experiments (MIQE) guidelines were used for assessment and presentation of results.Citation34
Fluorescence immunocytochemistry
JC0562 and M15 melanoma cell lines were seeded (5 × 10⁴ cells) in a 4-chamber culture glass slide (BD Falcon) 24 h before treatment with 10μM of 5-Aza or DMSO for 48 h. After fixation with 4% paraformaldehyde and permeabilization with Tween20, cells were incubated with anti-REG1A antibody (Ab)(2.5 μg/mL) for 60min and Alexa Fluor 488 goat anti-rabbit IgG (2 μg/mL) for additional 60min at room temperature in the dark. The slides were then mounted with ProLong gold antifade reagent with DAPI (Invitrogen).
Melanoma patients
All tissue specimens for this study were obtained according to protocol guidelines set forth by JWCI and approved by the Western Institutional Review Board (WIRB). Formalin-fixed archival tissues (FFPE) of melanoma LN metastasis were obtained from a cohort of 160 patients diagnosed with AJCC Stage III and used to construct TMA. Patients (n = 34) who had pre-treatment history (previous melanoma treatment or neoadjuvant chemotherapy) were excluded from this study. For the remaining 126 patients assessed in this study, the characteristics were summarized in . Twenty-seven patients (21%) who were treated with adjuvant chemotherapy within 2 y after the surgery were defined as the adjuvant group. Adjuvant chemotherapies include CDDP and/or DTIC as key chemotherapeutic agents. Ten-years DSS and DFS were measured from surgery date. The longest follow-up period was 16 y, with a median follow-up of 3.5 y. DNA methylation landscape of REG1A promoter region in HM450K arrays, 4 benign nevi, 7 primary melanomas (AJCC Stage II), and 21 distant organ metastasis (AJCC Stage IV) was assessed by HM450K arrays (Fig. S2).
Melanoma LN metastasis tissue microarray (TMA)
The TMA construction consisted of 160 LN metastatic specimens (duplicate cores) from well clinically annotated AJCC Stage III melanoma patients was previously described.Citation26 Controls in the TMA included tumor negative lymph nodes (negative) and melanoma cell lines (positive).
Immunohistochemistry (IHC)
IHC procedures were described previously.Citation26 Briefly, for antigen retrieval, slides were incubated in 1× citrate buffer (pH 6.0, DBS) at 100°C in a water bath for 40 min. After blocking peroxidase treatment, tissue sections were incubated with anti-human REG1A Ab (2.5 μg/mL, rabbit polyclonal Ab, BioVendor) at room temperature in a humid chamber for 1h, and visualized by CSAII kit (Dako) and DAB Peroxidase Substrate Kit (Vector Laboratories) according to manufacturer’s instructions. For the negative control, one serial TMA section was stained in parallel with the same procedure except the primary Ab.
Photographs of IHC staining were taken for analysis using the Nikon Eclipse Ti microscope and NIS elements software (Nikon). To quantitatively evaluate REG1A expression, we employed the imaging software, ImageJ (http://rsb.info.nih.gov/ij/index.html), which allows to calculate staining intensity. IHC staining intensity values of specimens on the slides without primary Ab were subtracted from those of corresponding samples on slide with the primary Ab to exclude influence of pigmentation and background staining.Citation26 The mean value of staining intensity (MSI) of duplicate cores was reported for each specimen. IHC evaluation was performed in a blind manner of the specific patient’s clinical data.
Western blotting
Protein was isolated from melanoma cell lines as previously described.Citation35 Protein concentrations were determined using the Pierce BCA assay (Thermo Scientific). Membranes were immunoblotted overnight with primary rat monoclonal anti-REG1A Ab (1:200, R&D SYSTEM).
After immunoblotting, the membranes were washed with 1×TBS containing 0.1% Tween-20 and followed by 1 h incubation with horseradish peroxidase-conjugated goat anti-rat Ab (Cell Signaling). Immunoreactive bands were visualized with the SuperSignal West Dura Extended Substrate kit (Thermo Scientific) and the densities of protein bands were quantified by Alpha-Ease FCTM software (version 3.1.2, Alpha Innotech).
DNA isolation and bisulfite treatment from TMA
Tissue cores from TMA slides were captured by the laser capture microdissection (LCM) method using the VERITASTM system (Arcturus). DNA was extracted from a total area of approximately 1 mm2 from two serial 5 μm TMA slides, bisulfite-treated, and quantitative DNA methylation analysis was performed as described previously.Citation26
Chemosensitivity assay
We examined the relations between REG1A mRNA expression and chemosensitivity against two known chemotherapy drugs for melanoma treatment: CDDP and DTIC. Six melanoma cell lines were divided into two groups, three cell lines with low REG1A mRNA expression (NB0561, JC0562, and M12) and three cell lines with high REG1A expression (M7, M14 and M15). An amount of 1 × 10³ cells were treated with serial concentrations of 0 to 1 mM CDDP or 0 to 2 mM DTIC. After 24 h treatment, cell viability was determined by CellTiter-Glo® Luminescent Cell Viability Assay Kit (Promega). All experiments were performed in triplicate and the data was expressed as mean ± SD and compared with control.
Genome-wide DNA methylation profiling
The genome-wide DNA methylation assays were performed using Infinium HumanMethylation450 BeadChip (HM450K) following the manufacturer’s protocol (Illumina, Inc.; www.illumina.com). Sodium bisulfite modification (SBM) was performed on 500 ng of genomic DNA using Zymo EZ DNA methylation kit (Zymo Research). After conversion, 200 ng of SBM-DNA were whole-genome amplified and enzymatically fragmented. The DNA was hybridized in the Infinium Human Methylation 450K BeadChip. The chips were scanned with Illumina iScan, and the data was extracted using the R package methylumi on Bioconductor. The methylation levels were reported as β-value (β = intensity of the Methylated allele/[intensity of the Unmethylated allele + intensity of the Methylated allele]), and calculated using the signal intensity value for each CpG site. The β values were corrected by using the recently published method.Citation36
Biostatistical analysis
The Student’s t-test and Wilcoxon test (for continuous variables) and χ2 test and Fisher’s exact test (for categorical variables) were performed to compare the differences between the REG1A-high and -low groups. Survival curves were generated using the Kaplan-Meier method and compared using log-rank test. Univariable and multivariable survival analyses were done using Cox’s proportional hazards (Cox PH) regression model. All statistical analyses were performed using SAS 9.2 (SAS Institute, Cary, NC). P-values ≤ 0.05 (two-sided) were considered statistically significant. This biomarker prognostic study complied with the REMARK Guidelines.Citation37
Additional material
Download Zip (364.7 KB)Acknowledgements
This work was supported by P0 CA029605 from the NIH, NCI, the Leslie and Susan Gonda (Goldschmied) Foundation (Los Angeles, CA) (DH), The Dr. Miriam and Sheldon G. Adelson Medical Research Foundation (DH), and Ruth and Martin H. Weil Fund (Los Angeles, CA) (DH).
Disclosure of Potential Conflicts of Interest
No potential conflicts of interest were disclosed.
Supplemental Materials
Supplemental materials may be found here: www.landesbioscience.com/journals/epigenetics/articles/25810
References
- Mocellin S, Pasquali S, Rossi CR, Nitti D. Interferon alpha adjuvant therapy in patients with high-risk melanoma: a systematic review and meta-analysis. J Natl Cancer Inst 2010; 102:493 - 501; http://dx.doi.org/10.1093/jnci/djq009; PMID: 20179267
- Morton DL, Thompson JF, Cochran AJ, Mozzillo N, Elashoff R, Essner R, et al, MSLT Group. Sentinel-node biopsy or nodal observation in melanoma. N Engl J Med 2006; 355:1307 - 17; http://dx.doi.org/10.1056/NEJMoa060992; PMID: 17005948
- Kirkwood JM, Moschos S, Wang W. Strategies for the development of more effective adjuvant therapy of melanoma: current and future explorations of antibodies, cytokines, vaccines, and combinations. Clin Cancer Res 2006; 12:2331s - 6s; http://dx.doi.org/10.1158/1078-0432.CCR-05-2538; PMID: 16609054
- Flaherty KT, Puzanov I, Kim KB, Ribas A, McArthur GA, Sosman JA, et al. Inhibition of mutated, activated BRAF in metastatic melanoma. N Engl J Med 2010; 363:809 - 19; http://dx.doi.org/10.1056/NEJMoa1002011; PMID: 20818844
- Hodi FS, O’Day SJ, McDermott DF, Weber RW, Sosman JA, Haanen JB, et al. Improved survival with ipilimumab in patients with metastatic melanoma. N Engl J Med 2010; 363:711 - 23; http://dx.doi.org/10.1056/NEJMoa1003466; PMID: 20525992
- Terazono K, Yamamoto H, Takasawa S, Shiga K, Yonemura Y, Tochino Y, et al. A novel gene activated in regenerating islets. J Biol Chem 1988; 263:2111 - 4; PMID: 2963000
- Watanabe T, Yonekura H, Terazono K, Yamamoto H, Okamoto H. Complete nucleotide sequence of human reg gene and its expression in normal and tumoral tissues. The reg protein, pancreatic stone protein, and pancreatic thread protein are one and the same product of the gene. J Biol Chem 1990; 265:7432 - 9; PMID: 2332435
- Miyaoka Y, Kadowaki Y, Ishihara S, Ose T, Fukuhara H, Kazumori H, et al. Transgenic overexpression of Reg protein caused gastric cell proliferation and differentiation along parietal cell and chief cell lineages. Oncogene 2004; 23:3572 - 9; http://dx.doi.org/10.1038/sj.onc.1207333; PMID: 15116092
- Unno M, Itoh T, Watanabe T, Miyashita H, Moriizumi S, Teraoka H, et al. Islet beta-cell regeneration and reg genes. Adv Exp Med Biol 1992; 321:61 - 6, discussion 67-9; http://dx.doi.org/10.1007/978-1-4615-3448-8_8; PMID: 1449083
- Hayashi K, Motoyama S, Sugiyama T, Izumi J, Anbai A, Nanjo H, et al. REG Ialpha is a reliable marker of chemoradiosensitivity in squamous cell esophageal cancer patients. Ann Surg Oncol 2008; 15:1224 - 31; http://dx.doi.org/10.1245/s10434-008-9810-8; PMID: 18259819
- Motoyama S, Sugiyama T, Ueno Y, Okamoto H, Takasawa S, Nanjo H, et al. REG I expression predicts long-term survival among locally advanced thoracic squamous cell esophageal cancer patients treated with neoadjuvant chemoradiotherapy followed by esophagectomy. Ann Surg Oncol 2006; 13:1724 - 31; http://dx.doi.org/10.1245/s10434-006-9075-z; PMID: 17009160
- Sekikawa A, Fukui H, Fujii S, Ichikawa K, Tomita S, Imura J, et al. REG Ialpha protein mediates an anti-apoptotic effect of STAT3 signaling in gastric cancer cells. Carcinogenesis 2008; 29:76 - 83; http://dx.doi.org/10.1093/carcin/bgm250; PMID: 18024479
- Yoshino N, Ishihara S, Rumi MA, Ortega-Cava CF, Yuki T, Kazumori H, et al. Interleukin-8 regulates expression of Reg protein in Helicobacter pylori-infected gastric mucosa. Am J Gastroenterol 2005; 100:2157 - 66; http://dx.doi.org/10.1111/j.1572-0241.2005.41915.x; PMID: 16181363
- Astrosini C, Roeefzaad C, Dai YY, Dieckgraefe BK, Jöns T, Kemmner W. REG1A expression is a prognostic marker in colorectal cancer and associated with peritoneal carcinomatosis. Int J Cancer 2008; 123:409 - 13; http://dx.doi.org/10.1002/ijc.23466; PMID: 18452172
- Lee WS, Seo G, Shin HJ, Yun SH, Yun H, Choi N, et al. Identification of differentially expressed genes in microsatellite stable HNPCC and sporadic colon cancer. J Surg Res 2008; 144:29 - 35; http://dx.doi.org/10.1016/j.jss.2007.02.005; PMID: 17950328
- Kimura N, Yonekura H, Okamoto H, Nagura H. Expression of human regenerating gene mRNA and its product in normal and neoplastic human pancreas. Cancer 1992; 70:1857 - 63; http://dx.doi.org/10.1002/1097-0142(19921001)70:7<1857::AID-CNCR2820700708>3.0.CO;2-8; PMID: 1525759
- Cavard C, Terris B, Grimber G, Christa L, Audard V, Radenen-Bussiere B, et al. Overexpression of regenerating islet-derived 1 alpha and 3 alpha genes in human primary liver tumors with beta-catenin mutations. Oncogene 2006; 25:599 - 608; http://dx.doi.org/10.1038/sj.onc.1208860; PMID: 16314847
- Minamiya Y, Kawai H, Saito H, Ito M, Hosono Y, Motoyama S, et al. REG1A expression is an independent factor predictive of poor prognosis in patients with non-small cell lung cancer. Lung Cancer 2008; 60:98 - 104; http://dx.doi.org/10.1016/j.lungcan.2007.09.012; PMID: 17964685
- Sasaki Y, Minamiya Y, Takahashi N, Nakagawa T, Katayose Y, Ito A, et al. REG1A expression is an independent factor predictive of poor prognosis in patients with breast cancer. Ann Surg Oncol 2008; 15:3244 - 51; http://dx.doi.org/10.1245/s10434-008-0137-2; PMID: 18781363
- Geng J, Fan J, Wang P, Fang ZJ, Xia GW, Jiang HW, et al. REG1A predicts recurrence in stage Ta/T1 bladder cancer. Eur J Surg Oncol 2009; 35:852 - 7; http://dx.doi.org/10.1016/j.ejso.2008.12.007; PMID: 19167858
- Sato Y, Motoyama S, Nanjo H, Ito S, Yoshino K, Sasaki T, et al. REG1A expression status suggests chemosensitivity among advanced thoracic esophageal squamous cell carcinoma patients treated with esophagectomy followed by adjuvant chemotherapy. [Epub Ahead of Print] Ann Surg Oncol 2013; http://dx.doi.org/10.1245/s10434-013-2983-9; PMID: 23645481
- Greenberg ES, Chong KK, Huynh KT, Tanaka R, Hoon DS. Epigenetic biomarkers in skin cancer. Cancer Lett 2012; http://dx.doi.org/10.1016/j.canlet.2012.01.020; PMID: 22289720
- Rodenhiser D, Mann M. Epigenetics and human disease: translating basic biology into clinical applications. CMAJ 2006; 174:341 - 8; http://dx.doi.org/10.1503/cmaj.050774; PMID: 16446478
- Hoon DS, Spugnardi M, Kuo C, Huang SK, Morton DL, Taback B. Profiling epigenetic inactivation of tumor suppressor genes in tumors and plasma from cutaneous melanoma patients. Oncogene 2004; 23:4014 - 22; http://dx.doi.org/10.1038/sj.onc.1207505; PMID: 15064737
- Kitago M, Martinez SR, Nakamura T, Sim MS, Hoon DS. Regulation of RUNX3 tumor suppressor gene expression in cutaneous melanoma. Clin Cancer Res 2009; 15:2988 - 94; http://dx.doi.org/10.1158/1078-0432.CCR-08-3172; PMID: 19336521
- Nguyen T, Kuo C, Nicholl MB, Sim MS, Turner RR, Morton DL, et al. Downregulation of microRNA-29c is associated with hypermethylation of tumor-related genes and disease outcome in cutaneous melanoma. Epigenetics 2011; 6:388 - 94; http://dx.doi.org/10.4161/epi.6.3.14056; PMID: 21081840
- Tanemura A, Terando AM, Sim MS, van Hoesel AQ, de Maat MF, Morton DL, et al. CpG island methylator phenotype predicts progression of malignant melanoma. Clin Cancer Res 2009; 15:1801 - 7; http://dx.doi.org/10.1158/1078-0432.CCR-08-1361; PMID: 19223509
- Yoshimura T, Nagahara M, Kuo C, Turner RR, Soon-Shiong P, Hoon DS. Lymphovascular invasion of colorectal cancer is correlated to SPARC expression in the tumor stromal microenvironment. Epigenetics 2011; 6:1001 - 11; http://dx.doi.org/10.4161/epi.6.8.16063; PMID: 21725199
- Kagara N, Huynh KT, Kuo C, Okano H, Sim MS, Elashoff D, et al. Epigenetic regulation of cancer stem cell genes in triple-negative breast cancer. Am J Pathol 2012; 181:257 - 67; http://dx.doi.org/10.1016/j.ajpath.2012.03.019; PMID: 22626806
- Galluzzi L, Senovilla L, Vitale I, Michels J, Martins I, Kepp O, et al. Molecular mechanisms of cisplatin resistance. Oncogene 2012; 31:1869 - 83; http://dx.doi.org/10.1038/onc.2011.384; PMID: 21892204
- Neyns B, Tosoni A, Hwu WJ, Reardon DA. Dose-dense temozolomide regimens: antitumor activity, toxicity, and immunomodulatory effects. Cancer 2010; 116:2868 - 77; http://dx.doi.org/10.1002/cncr.25035; PMID: 20564393
- Miyata H, Doki Y, Shiozaki H, Inoue M, Yano M, Fujiwara Y, et al. CDC25B and p53 are independently implicated in radiation sensitivity for human esophageal cancers. Clin Cancer Res 2000; 6:4859 - 65; PMID: 11156245
- Takasawa S, Ikeda T, Akiyama T, Nata K, Nakagawa K, Shervani NJ, et al. Cyclin D1 activation through ATF-2 in Reg-induced pancreatic beta-cell regeneration. FEBS Lett 2006; 580:585 - 91; http://dx.doi.org/10.1016/j.febslet.2005.12.070; PMID: 16405968
- Bustin SA, Benes V, Garson JA, Hellemans J, Huggett J, Kubista M, et al. The MIQE guidelines: minimum information for publication of quantitative real-time PCR experiments. Clin Chem 2009; 55:611 - 22; http://dx.doi.org/10.1373/clinchem.2008.112797; PMID: 19246619
- Narita N, Tanemura A, Murali R, Scolyer RA, Huang S, Arigami T, et al. Functional RET G691S polymorphism in cutaneous malignant melanoma. Oncogene 2009; 28:3058 - 68; http://dx.doi.org/10.1038/onc.2009.164; PMID: 19561646
- Triche TJ Jr., Weisenberger DJ, Van Den Berg D, Laird PW, Siegmund KD. Low-level processing of Illumina Infinium DNA Methylation BeadArrays. Nucleic Acids Res 2013; 41:e90; http://dx.doi.org/10.1093/nar/gkt090; PMID: 23476028
- McShane LM, Altman DG, Sauerbrei W, Taube SE, Gion M, Clark GM, Statistics Subcommittee of the NCI-EORTC Working Group on Cancer Diagnostics. REporting recommendations for tumour MARKer prognostic studies (REMARK). Eur J Cancer 2005; 41:1690 - 6; http://dx.doi.org/10.1016/j.ejca.2005.03.032; PMID: 16043346