Abstract
The study of aberrant DNA methylation in cancer holds the key to the discovery of novel biological markers for diagnostics and can help to delineate important mechanisms of disease. We have identified 12 loci that are differentially methylated in serous ovarian cancers and endometrioid ovarian and endometrial cancers with respect to normal control samples. The strongest signal showed hypermethylation in tumors at a CpG island within the ZNF154 promoter. We show that hypermethylation of this locus is recurrent across solid human epithelial tumor samples for 15 of 16 distinct cancer types from TCGA. Furthermore, ZNF154 hypermethylation is strikingly present across a diverse panel of ENCODE cell lines, but only in those derived from tumor cells. By extending our analysis from the Illumina 27K Infinium platform to the 450K platform, to sequencing of PCR amplicons from bisulfite treated DNA, we demonstrate that hypermethylation extends across the breadth of the ZNF154 CpG island. We have also identified recurrent hypomethylation in two genomic regions associated with CASP8 and VHL. These three genes exhibit significant negative correlation between methylation and gene expression across many cancer types, as well as patterns of DNaseI hypersensitivity and histone marks that reflect different chromatin accessibility in cancer vs. normal cell lines. Our findings emphasize hypermethylation of ZNF154 as a biological marker of relevance for tumor identification. Epigenetic modifications affecting the promoters of ZNF154, CASP8, and VHL are shared across a vast array of tumor types and may therefore be important for understanding the genomic landscape of cancer.
Introduction
DNA methylation is an epigenetic modification that plays an important role in development and disease.Citation1-Citation3 The study of patterns of aberrant methylation in cancer has attracted a significant amount of attention during the past decade.Citation4-Citation9 As a result, a wide variety of data acquisition technologies and computational methods for the analysis and interpretation of DNA methylation data are currently available.Citation10 Several studies have explored the biological relevance of differential methylation at CpG islands and shores,Citation11 the functional implications of promoter vs. gene body methylationCitation12 and the interplay between histone marks and DNA methylation.Citation13-Citation15 Considerable effort has also been devoted to investigate mutational events that could explain cancer-related aberrant methylation through their effect on the epigenetic machinery.Citation16,Citation17 Recently, the development of clinically relevant diagnostic tests for cancer based on methylation biomarkers measured in blood, urine, and other body fluidsCitation18-Citation22 have provided a glimpse into the biomedical applications that may become mainstream in the near future.Citation23
DNA methylation experiments performed by individual laboratories provide evidence for the identification of shared signatures of differential methylation that can separate tumors from normal controls.Citation21,Citation24,Citation25 Even though these studies are typically restricted to relatively small numbers of samples due to technical and clinical constraints, they also provide certain methodological advantages such as a homogeneous workflow that can help to reduce biases across samples associated with technological variation in platforms, locations, and times of analysis.Citation26,Citation27 Small-scale studies also make it easier for researchers to evaluate specific samples in greater detail, possibly going back to the bench to carry out additional experiments or to acquire complementary types of biological information from those samples. However, attempts to infer and validate reproducible methylation patterns of even moderate complexity frequently require large-scale studies over hundreds or thousands of samples, which involve collaborations between multiple research groups, often including international consortia.Citation28-Citation34 Exploiting the benefits of in-depth analyses of small samples while satisfying the need for statistical significance and reproducibility associated with large sample sizes requires the adoption of integrative strategies that can fill the gap between these two common approaches.
Working under this premise, we searched for DNA methylation patterns that occur in multiple cancer types and may therefore be involved in common pathways responsible for the development and progression of cancer. We have found that some differential methylation signatures shared by a set of ovarian and endometrial cancer samples collected and analyzed in our laboratory are recurrent across (1) cancer cell lines from the Encyclopedia of DNA Elements (ENCODE)Citation35 and (2) a compendium of tissue samples from 16 different cancer types collected by The Cancer Genome Atlas (TCGA). We have observed cancer-related hypermethylation of a CpG island at the promoter of ZNF154 and hypomethylation of two genomic regions near the CASP8 and VHL promoters. Methylation at these locations is correlated with gene expression, as well as DNaseI hypersensitivity and histone marks that correspond to closed chromatin in heavily methylated loci. Taken as a whole, our analyses point to the existence of shared epigenetic signatures among different cancer types that may be relevant for developing diagnostic markers and delineating mechanisms of tumorigenesis. Studies involving smaller numbers of samples and cancer types in complementary publications are congruent with this idea.Citation36-Citation38
Results
Initial experiments were targeted at identifying DNA methylation patterns that discriminated a set of ovarian and endometrial tumor samples from normal control samples. We then compared our results with publicly available DNA methylation data from TCGA and ENCODE to address whether those patterns—which include differential methylation and negative correlation between methylation and gene expression—were shared across data sets derived from multiple cancer types and diverse cell lines.
Patterns of differential methylation shared by serous ovarian cancers and endometrioid ovarian and endometrial cancers
In previous work,Citation25 we identified genomic locations of differential methylation in high-grade serous ovarian tumors vs. normal control samples. Additionally, we identified a larger set of loci whose levels of methylation could be used to differentiate tissue samples originating as ovarian high-grade serous cancer, ovarian endometrioid cancer, and endometrial endometrioid cancer from normal controls based on hierarchical clustering results.
Using a larger sample collection that comprises 164 samples and a new methodological approach, we have identified a set of 12 loci that are differentially methylated at significant levels both in high-grade serous ovarian cancers (83 tumors vs. 16 controls) and in ovarian and endometrial cancers of the endometrioid histopathological subtype (53 tumors vs. 12 controls). All 83 serous tumors that we analyzed were located in ovary, whereas the endometrioid samples contained a mixture of 27 ovarian endometrioid tumors and 26 endometrial endometrioid tumors. Of the 12 differentially methylated locations that we identified, one locus was consistently hypermethylated in tumors, while the other 11 loci exhibited lower levels of methylation in tumors than in controls (; ).
Table 1. Differentially methylated loci in ovarian and endometrial cancer
Figure 1. Methylation levels in tumors vs. normal controls for ovarian and endometrial cancer samples. For each probe, points associated with individual samples are drawn over the corresponding boxplots and violin-plots. The vertical axis shows the β value associated with each point, with values ranging from 0 (completely unmethylated) to 1 (completely methylated). Median values of methylation for each sample class are shown in .
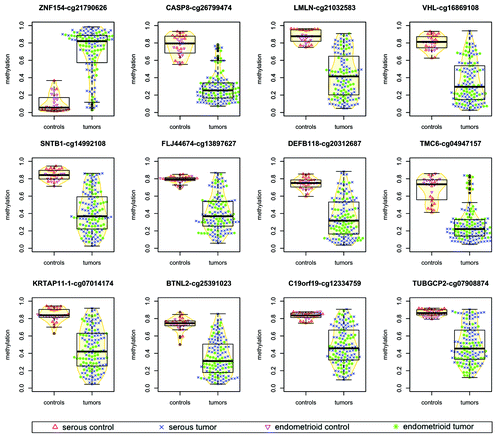
The signal identified as hypermethylation in tumors with respect to controls was discovered at the locus interrogated by Illumina probe cg21790626, based on a very stringent selection criterion that combines statistical significance and magnitude of effect (see “Materials and Methods”). This position has the strongest signal in terms of differential methylation among any of the significantly hyper- or hypomethylated loci and is located within a CpG island (chr19:58 220 189–58 220 517) immediately downstream of the transcription start site of ZNF154.
Methylation at cg21790626 was correlated with increased, widespread methylation of CpG islands across the genomes of ovarian and endometrial endometrioid tumor samples, as shown by analysis of a reference set of 380 probes located at CpG islands (; Spearman correlation = 0.730, P < 2.2e-16). Correlation was also significant for more than 32% of a million sets of 380 probes that were randomly chosen at CpG islands across the entire genome in endometrioid samples, whereas only 5% of those sets reached statistical significance in the serous cases (). This agrees with our previous report of a CpG island methylator phenotype (CIMP) for the endometrioid, but not serous histopathological subtype.Citation25 Nevertheless, methylation of the cg21790626 locus remains a good discriminative feature to separate the majority of serous tumors from controls.
Figure 2. Methylation at the ZNF154 promoter is correlated with widespread methylation of CpG islands in endometrioid tumors. (A) Hierarchical clustering of all our ovarian and endometrial cancer samples using the 500 probes with the highest variance in methylation, selected as in Kolbe et al.Citation25 The heat map shows levels of methylation as β values associated with each pair of probe (columns) and sample (rows). Top horizontal color bar shows which of the probes are located within CpG islands. The vertical color bar on the left shows the level of methylation at cg21790626-ZNF154 for each individual sample. The vertical color bar on the right shows the sample class, including serous controls (SC), serous tumors (ST), endometrioid controls (EC), endometrioid tumors (ET) and papillary serous tumors of low malignant potential (LMP). (B) DNA methylation at cg21790626-ZNF154 vs. average DNA methylation at the set of 380 probes from the top panel that are located within CpG islands. Each point in the plot corresponds to an individual sample. (C) Distribution of P values for Spearman correlation coefficients between DNA methylation at cg21790626-ZNF154 and average methylation at sets of 380 probes that were randomly selected in CpG islands across the entire genome. Each of the two histograms shows results for one million random choices of probe sets.
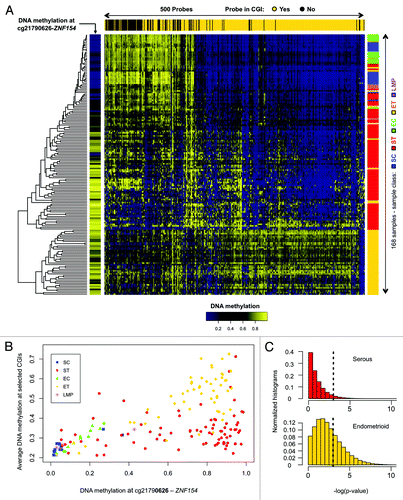
also shows methylation levels for four ovarian papillary serous tumors of low malignant potential (LMP) that were not among the 164 samples used in our original analysis of differential methylation. Three of these samples have low levels of methylation at ZNF154 and low levels of overall methylation in the reference set of CpG islands, while the fourth exhibits intermediate levels for both indicators. Although most LMP tumors are indolent, some show rare progression to aggressive tumors.Citation39 The lack of high levels of ZNF154 methylation in all four LMP samples is consistent with relatively normal DNA methylation patterns when examined at the top 500 most discriminative sites ().
A small number of tumor samples (19 of 136, 14%) show relatively low levels of methylation at the cg21790626 location (; Fig. S1). Their median methylation level is 14.4% (9.5% SD), compared with controls at 5.6% (9.9% SD), and the rest of tumors at 83.8% (15.1% SD). The majority of these 19 tumor samples also score incongruently at the 11 loci selected for significant hypomethylation in cancer (Fig. S1) and 15 out of the 19 exhibit patterns that closely resemble the ones observed in normal controls according to the hierarchical clustering at 500 discriminative sites shown in . This suggests that they may share an infrequent, although recognized phenotype analogous to CIMP-0 (CpG island methylator phenotype zero) in colorectal cancers.Citation40,Citation41 Such a low-intensity (zero) methylator phenotype has been reported to occur in ovarian tumors by Strathdee et al. using a minimal set of genes.Citation42 A subset of serous-like endometrial tumors with minimal DNA methylation changes compared with normal endometrium has also been described in the TCGA marker paper on endometrial carcinoma.Citation34
Differential methylation across multiple cancer types and tumor cell lines
We narrowed the list of 12 differentially methylated loci identified in our study of gynecological tumors down to seven loci that were also differentially methylated in 23 cancer cell lines compared with 28 non-cancer cell lines from ENCODE (; ). Each of these seven loci (ZNF154, VHL, BTNL2, FLJ44674, KRTAP11–1, DEFB118, and CASP8) also showed differential methylation in a majority (at least 13 of 16, 81.25%) of the cancer types that we examined from TCGA data (; ). Based on the consistency of these results, differential methylation at these genomic locations implicates them as a panel of reliable diagnostic markers to distinguish tumors from healthy tissue in multiple cancer types. Here we focus further on the analysis of the loci in the ZNF154, VHL, and CASP8 promoters.
Table 2. Differentially methylated loci in ovarian and endometrial cancer and human cell lines
Figure 3. Seven of the 12 loci selected from our ovarian and endometrial cancer analysis show differential methylation in cancer vs. normal cell lines from ENCODE. The heat map shows β values that reflect the level of methylation associated with each probe (columns) in each cell line (rows). The color side bar on the left distinguishes cell lines that were derived from cancer (magenta), normal (green) or unspecified (black) tissues. Unsupervised hierarchical clustering based on pairwise correlations was used to order rows and columns. Median levels of methylation in cancer and normal cell lines are provided in .
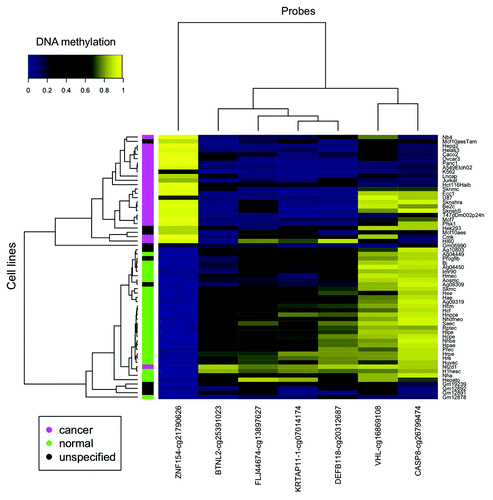
Table 3. TCGA data: types of cancer and number of methylation and expression data samples
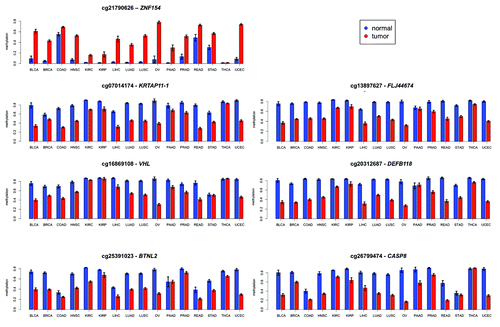
Figure 4. Mean levels of methylation in tumors (red) vs. normal controls (blue) at the genomic locations shown in for 16 types of cancer from TCGA. Error bars show a 95% confidence interval centered at the mean. The number of samples used for each cancer type is provided in .
Negative correlation between DNA methylation and gene expression
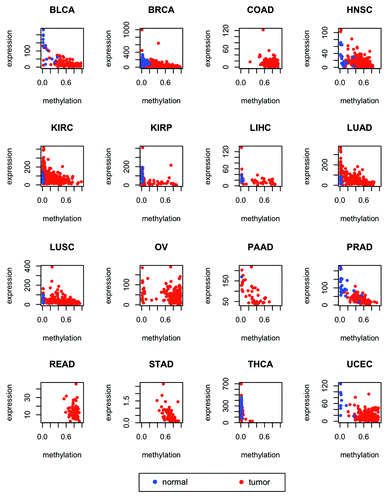
Probes associated with genes ZNF154, VHL, and CASP8 exhibit significant levels of negative correlation between methylation and gene expression in at least half of all the cancer types included in our study (; ; Figs. S2 and S3). Specifically, ZNF154 is expressed at low levels in normal tissues. The data that we used had been normalized by TCGA to set the upper quartile count at 1000 for each cancer type (with the exception of stomach cancer, see “Materials and Methods” for details). The median value of expression in controls for ZNF154 is 63, while the median expression value computed over all the 20 501 genes in the data set is 200 (these two quantities were averaged across tissue types, excluding stomach and thyroid, as well as types with no expression data for controls). ZNF154 expression levels drop even lower in cancer samples, with a median value of expression in tumors equal to 30 (while the median background value for all genes in tumors is 192). In contrast, CASP8 and VHL show higher overall levels of expression than ZNF154 and are more highly expressed in tumors than in controls. The median levels of CASP8 expression across cancer types are 673 in tumors and 481 in controls. Likewise, the median levels of expression for VHL are 734 in tumors and 645 in controls. Whereas probe cg21790626-ZNF154 falls within a CpG island at the promoter of ZNF154, probe cg16869108-VHL is located at the south shore (i.e., within a distance of 2 kb downstream) of a CpG island at the VHL promoter. In contrast, probe cg26799474-CASP8 is not associated with any known CpG island, shore or shelf, but is located within 1 kb downstream from the transcription start site. The fact that all these probes are located at or near promoters may be indicative of methylation-mediated gene silencing in tumor and normal conditions, respectively. Therefore, these three loci should also be taken into account as putative biological markers that could confer functional consequences, in light of the negative correlations with transcription levels. The other loci that we examined, including cg20312687-DEFB118, cg07014174-KRTAP11–1, and cg25391023-BTNL2, did not show significant levels of correlation between methylation and expression for many of the cancer types that we investigated, while in the case of probe cg13897627-FLJ44674 no expression data was available for the FLJ44674 transcript.
Table 4. Correlation between methylation and expression at differentially methylated loci
Figure 5. Expression of ZNF154 vs. methylation at probe cg21790626 in different cancer types from TCGA for tumors (red) and normal controls (blue). RNA-Seq data was used for the STAD type and RNA-Seq V2 was used for all the other types (see “Materials and Methods” for details). Combined methylation and expression data were not available for any normal controls of the COAD, OV, READ, and STAD types. Values of Spearman correlation, together with their associated levels of significance, are provided in .
Targeted methylation across multiple cancer types and tumor cell lines
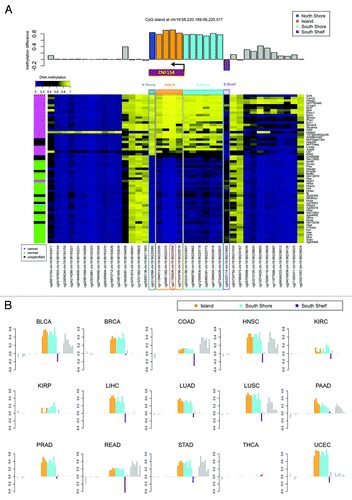
The recurrent hypermethylation of ZNF154 across multiple tumor samples indicated a targeted mechanism of DNA methylation rather than a random or spurious event. Specifically, this locus was heavily methylated in 22 out of the 23 cancer cell lines (with the exception of NT2-D1, a pluripotent human testicular embryonal carcinoma cell line, ) and in tumor samples from 15 out of the 16 cancer types from TCGA (the only exception being thyroid cancer, , which behaved as an outlier at most of the other significant probe sites). In contrast, methylation levels remained consistently low in control samples from the majority of tissue types, with slight exceptions in three tissues from the gastrointestinal tract (colon, rectum, and stomach; ). To further investigate the scope of the CpG island methylation, we examined an extended region using data from the high-resolution Illumina 450K methylation arrays. With this data set, hypermethylation in tumors was detectable at all four probes located in the CpG island, both in cancer cell lines from ENCODE () and tumor samples from TCGA (), with the exception of thyroid. In fact, hypermethylation was also observed at all probes located within the north and the south shores in ENCODE cell lines (), and the south shore in TCGA tumors (, data not available for the north shore from TCGA). Of note, ovarian cancer was excluded from the results shown in because no TCGA data were available from the Illumina 450K platform.
Figure 6. Methylation near the CpG island at chr19:58 220 189–-58 220 517, which is located at the promoter of gene ZNF154 and contains probe cg21790626 (highlighted in red). (A) Methylation levels in ENCODE cell lines depicted in the heat map show β values for each pair of probe (columns) and cell line (rows). Rows are ordered according to decreasing values of methylation at cg21790626 from top to bottom. The color side bar on the left shows cancer (magenta), normal (green), and unspecified (black) cell line annotations as provided by ENCODE. Probes located within the north shore (blue), island (orange), south shore (cyan), and south shelf (purple) are highlighted. The bar plot above the heat map shows the difference in median methylation in cancer cell lines minus median methylation in normal cell lines for each individual probe. (B) Difference in median methylation in tumors vs. controls at probes neighboring CpG island chr19:58 220 189–58 220 517 in different cancer types from TCGA. Ovarian cancer is excluded because no data from the Illumina 450K platform were available from TCGA at the time of our analysis. The color notation and the probe locations are the same as in the top panel. Positive values correspond to hypermethylation in tumors. Bars corresponding to probes that were marked as “not available” (NA) in level 3 data from TCGA (including the probe located within the north shore from panel A) are shown as empty horizontal gaps.
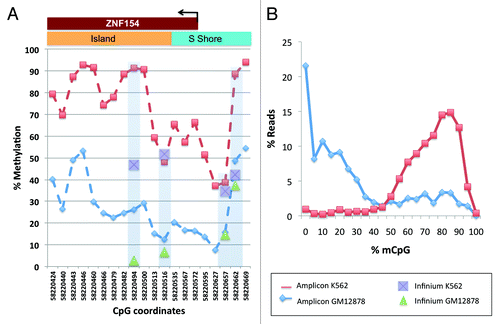
To independently validate these findings and further extend the scope of analysis, we performed amplicon sequencing of bisulfite treated genomic DNA harvested from K562 and GM12878 cell lines (). We chose these two lines because they are Tier 1 cell lines from ENCODE analyses (http://www.genome.gov/26524238) and have the most extensive characterization of all cell lines used in ENCODE. Constrained by the placement of primers for amplifying bisulfite treated DNA, we selected a 302 base pair interval, centered 24 bases downstream from the ZNF154 transcription start site and containing 20 CpG dinucleotides (12 of these were located in the annotated CpG island). We observed a significant difference in DNA methylation levels where the majority of amplicons showed strong methylation across the CpG island in K562 cells, but not in GM12878 cells (), consistent with our analysis of ENCODE and TCGA data ( and ). Furthermore, considering methylation along individual DNA fragments (i.e., sequencing reads), we found methylation in the majority of CpGs from K562 amplicons, whereas most CpGs in GM12878 were not methylated (). These data support the conclusion that DNA methylation at this locus specifically affects a relatively wide region (300–500 bp) in most tumors and tumor-derived cell lines, but not in normal tissues or immortalized cell lines derived from normal cells.
Figure 7. Methylation levels from our amplicon sequencing analysis, measured in K562 and GM12878 cell lines at individual CpGs on the forward strand of the genomic interval around the transcription start site of ZNF154 (chr19:58 220 404–58 220 705). (A) Percent methylation for each of the 20 CpG dinucleotides in the interval; CpGs are marked by their C-coordinates on chromosome 19. Methylation values from ENCODE data at probes from Illumina Infinium arrays within this region are shown for comparison purposes. (B) Distribution of reads as a function of methylated CpG fraction. K562 has most reads with 10 or more (≥50%) CpGs methylated, while the situation is reversed for GM12878.
A similar analysis of the Illumina 450K methylation array data at the VHL (chr3:10 183 306–10 183 941) and CASP8 (chr2:202 097 173–202 098 951) promoter regions shows consistent hypomethylation across a wide variety of cell lines and cancer types (Figs. S4 and S5). In these cases the separation between tumor cell lines and non-tumor cell lines was less precisely defined than for ZNF154. Moreover, CASP8 was consistently hypomethylated in all 16 tumors, whereas VHL showed negligible signals in kidney renal papillary cell carcinoma and thyroid cancer.
Chromatin accessibility
To further investigate the regulatory function of the differentially methylated loci associated with ZNF154, CASP8, and VHL, we analyzed chromatin properties at those sites. We observed statistically significant levels of association between DNaseI hypersensitivity and the normal vs. cancer designation in ENCODE cell lines, which is indicative of regulatory chromatin structure at the unmethylated ZNF154 CpG island. The DNaseI hypersensitivity cluster located at chr19:58 219 906–58 220 755 contained peak signals for a much larger fraction of normal cell lines than cancer cell lines (87.3% in controls vs. 25% in cancer, P = 4.5e-09, one-sided Fisher's exact test). This association remained significant, but was reversed, at the genomic locations near the CASP8 promoter (33.8% in controls vs. 78.5% in cancer, P = 5.8e-05, cluster located at chr2:202 098 006–202 098 275) and the VHL promoter (53.5% in controls vs. 89.4% in cancer, P = 5.5e-04, cluster located at chr3:10 184 306–10 185 010). The mean hypersensitivity signals measured in cancer vs. non-cancer cell lines () further reinforced the conclusion of statistically significant differences. More precisely, the mean DNaseI hypersensitivity at the ZNF154 promoter was 4.7-fold higher in normal than in cancer cell lines (31.50 in normal vs. 6.75 in cancer, P = 1.3e-07, one-sided t-test). It was 4.4-fold higher in cancer than in normal cell lines for CASP8 (115.36 in cancer vs. 26.39 in normal, P = 0.0310) and 3.2-fold higher in cancer than in normal cell lines for VHL (18.54 in cancer vs. 5.87 in normal, P = 0.0074). These observations of chromatin structure are consistent with the patterns of differential promoter methylation that we find across different types of cancer, wherein open chromatin co-locates with unmethylated regions and closed chromatin co-locates with methylated DNA.Citation43
Figure 8. Chromatin accessibility at the ZNF154, CASP8, and VHL loci. (A) Comparison of DNaseI hypersensitivity signals in normal vs. cancer cell lines. Mean values were computed over 71 normal and 28 cancer cell lines. (B) Comparison of histone marks H3K4me3 and H3K27ac. In the ZNF154 case, mean values were computed over the entire CpG island. In the CASP8, VHL, and GAPDH cases, mean values were computed over a 52 bp region centered at the CpG dinucleotide interrogated by the corresponding Illumina probes. Results were averaged over 8 normal and 4 cancer cell lines from ENCODE. The mean value for each histone mark, averaged across all genes and cell lines, is provided as a background reference (dashed, blue horizontal line). In both panels, housekeeping gene GAPDH was included for control purposes, error bars show 95% confidence intervals for each estimated mean, P values are provided corresponding to a one-sided t-test comparison and significant results are highlighted with a red star (see “Materials and Methods” for details).
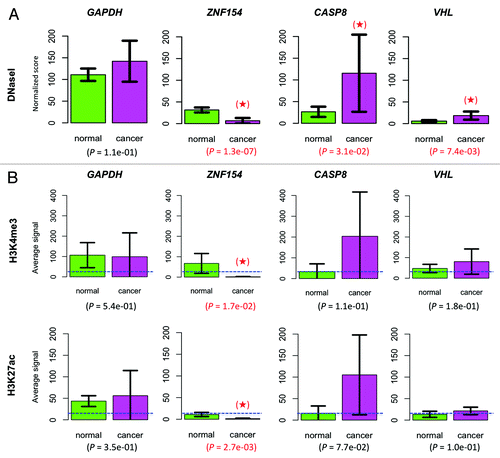
Finally, we analyzed levels of the H3K4me3 and H3K27ac histone marks for these three regions near the ZNF154, CASP8, and VHL promoters in cancer and normal cell lines using ENCODE data. High levels of H3K4me3 and H3K27ac are associated with promoters of actively transcribed genes.Citation44 The H3K4me3 mark has been reported to protect CpG islands from DNA methylation.Citation45,Citation46 Consistent with our DNaseI analysis, the CpG island at the ZNF154 promoter exhibits active chromatin modifications and shows higher average levels of H3K4me3 and H3K27ac in normal cell lines than in cancer cell lines (). These histone mark differences were statistically significant (P = 0.0168 for H3K4me3 and P = 0.0027 for H3K27ac; one-sided t-tests). As was the case for DNaseI hypersensitivity, the histone modification pattern is reversed in the hypomethylated regions at CASP8 and VHL, where we observe higher levels of H3K4me3 and H3K27ac in cancer cell lines than in normal cell lines (). These results support the conclusion that CASP8 and VHL are being upregulated in cancer, although the differences failed to reach statistical significance. This fact can be explained by the weaker differential signal associated with the two hypomethylated loci, which may not be reliably detectable given the small number of samples used in the analysis and the consequent restrictions on the statistical power of our tests (histone modification data were only available for 8 normal and 4 cancer cell lines). Alternatively, marks at these loci may be less consistent across different cell lines than they are at the ZNF154 locus.
Discussion
ZNF154 (also known as pHZ-92) is located at 19q13.4 and encodes a member of the Krüppel C2H2-type zinc finger protein family, containing 12 C2H2-type zinc-finger domains and one KRAB domain. Some zinc-finger proteins are known to play active roles in transcriptionCitation47,Citation48 and some are known to be expressed at low levels,Citation49 which is consistent with our analysis of TCGA RNA-Seq data. Certain proteins encoding specific zinc-finger domains have been reported to recognize non-methylated DNA and to recruit chromatin-modifying elements to CpG islands,Citation50 and there is evidence for the implication of several zinc-finger transcription factors in cancer.Citation51-Citation55 Hypermethylation of ZNF154 has previously been reported by independent sources to occur in bladder,Citation18,Citation56 breast,Citation57 head and neck,Citation58,Citation59 hepatocellular,Citation60 lung,Citation29 ovarian,Citation25,Citation61 prostate,Citation62 and renalCitation63 cancers. Still, very little is known about the biological function of the protein encoded by ZNF154, and the possible functional significance of its diminished expression in cancer cell types has not been explored. Recently, this locus was included in a list of 220 genes that are methylated in more than 5% of analyzed tumor samples in tissues from 7 different cancer types.Citation38 The authors of that study reported hypermethylation of probes cg08668790 and cg21790626 in more than 20% of the tumor samples for acute-myeloid leukemia, breast, prostate, lung and ovarian cancer, as well as in between 5% and 20% of the tumors in glioblastoma and colorectal cancer. However, our results provide evidence for a magnitude of effect that goes well beyond occurrence in a relatively restricted fraction of samples. In this respect, our study is the first, to our knowledge, to stress the remarkable combination of signal strength and ubiquity across multiple cancer types that makes this genomic region stand out from the rest and that advocates its exploration as a diagnostic biomarker to distinguish tumors from healthy tissues. Furthermore, our work constitutes the first combined study of DNA methylation and gene expression that delineates epigenetic silencing of the ZNF154 promoter across multiple cancer types. Our results are also the first to demonstrate that hypermethylation is observed across the entire CpG island located at the ZNF154 promoter, rather than only at one or a few array-specific loci.
Besides the ZNF154 promoter, we also examined the region surrounding two of the probes that exhibited differential hypomethylation in cancer, near VHL and CASP8. Even though our results for VHL and CASP8 are weaker than for ZNF154, we are the first group to report pan-cancer differential methylation at specific genomic regions located near the promoters of these two genes (Figs. S4 and S5). Both VHL and CASP8 are known tumor suppressor genes.Citation24,Citation64-Citation67 Cancer-related hypomethylation of CASP8 and VHL has been reported in lung squamous carcinomaCitation29 and in head and neck cancer.Citation58 CASP8 is a cysteine protease known to play an important role in cell apoptosis. Demethylation of CASP8 can restore gene expression and induce apoptosis,Citation65 and therefore the low levels of methylation observed at this locus in tumors might be indicative of a flawed or ineffectual death-triggering mechanism (i.e., an attempt to trigger apoptosis that arrives too late, or that is counteracted by some other biological process). VHL encodes a protein that functions as a part of the VCB-CUL2 complex, which is involved in protein degradation. Targets of this complex include elements of the hypoxia-inducible factor (HIF) complex, which is involved in adaptation to changing oxygen levels and a variety of cellular functions including cell-cycle control, cell division, differentiation, extracellular matrix assembly and angiogenesis.Citation67 Silencing of VHL due to hypermethylation of the CpG island at its promoter in a set of patients with clear-cell renal carcinomas was one of the first known examples of a tumor suppressor being silenced by aberrant DNA methylation in cancer.Citation24 Our analysis of TCGA data does not reveal hypermethylation of this CpG island as a recurrent event across cancer types, but it shows recurrent hypomethylation over two of the probes located within its south shore (Fig. S5). Future studies to determine whether hypomethylation at the south shore of VHL leads to activation of this gene will be important, because restoration of VHL function in VHL-deficient tumors has been proposed as a therapeutic approach to cancer treatment.Citation66
The remarkable consistency of the differential methylation signatures presented in our analysis across many types of solid tumors and cell lines suggests the existence of a recurrent epigenetic mechanism that targets these loci in cancer,Citation14,Citation68,Citation69 but not in normal conditions. Whether aberrant methylation is a cause or a consequence of tumorigenesis remains to be elucidated. Answering this question will require a better understanding of the molecular machinery involved in methylation and demethylation at specific genomic targets, placing a special emphasis on the extent and significance of the events that are suspected to alter proper cellular function in tumor cells.
Materials and Methods
Data
Gynecologic cancer samples
Sample preparation
Ovarian, endometrial and fallopian tube tissues were handled as published in Kolbe et al.Citation25 Additional endometrial normal and ovarian endometrioid tumor samples were provided by the Cooperative Human Tissue Network, funded by the National Cancer Institute. Samples are from post-menopausal individuals with atrophic endometrium obtained from routine hysterectomy or pelvic resection for non-endometrial cancers, whereas endometrioid endometrial tumors were from premenopausal or perimenopausal women. The NIH Office of Human Subjects Research determined that research using these samples was not “human subjects research” per the Common Rule (45 CFR 46).
DNA was isolated following the protocol of Trizol reagent (Invitrogen) and treated with sodium bisulfite according to the protocol of EZ DNA Methylation Kit (Zymo Research), with slight modification. One-half microgram of DNA was used for each conversion reaction. The hybridization reaction was performed according to the HumanMethylation27 Illumina BeadChip protocol and scanned using an Illumina iScan System.
DNA methylation data for TCGA ovarian tumors
Methylation data were obtained from the TCGA data repository (https://tcga-data.nci.nih.gov/tcga/) for ovarian serous carcinoma.Citation31 Samples were primarily drawn from batch 9 of the ovarian carcinoma data set, which included 8 normal fallopian tube controls and 39 tumors. An additional 4 controls were provided in batch 40. These data were acquired using the same HumanMethylation27 platform from Illumina as our own samples. We downloaded TCGA data that had been annotated as level 3 data, which represents calculated β values mapped to the genome, per sample (wiki.nci.nih.gov/display/TCGA/Data+level#Datalevel-level3).
The 12 normal fallopian tube controls from TCGA comprise all control samples made available by the Consortium for this type of cancer at the time of our analysis. The addition of tumor samples from batch 9 increased statistical power through a larger sample size and ensured that no probe was selected for being differentially methylated in TCGA vs. non-TCGA samples. The leave-one-batch-out comparison across several folds as part of our feature selection process (see “Statistical analysis” section below) protects against potential biases that are TCGA-specific. We also performed hierarchical clustering of all our samples - using the same approach as in Kolbe et al.Citation25 - where we confirmed that TCGA controls clustered with our own normal fallopian tube controls, and TCGA serous tumors clustered with our serous tumors ().
Methylation data filters
Starting from the full set of 27 578 probes in the Illumina HumanMethylation27 BeadChip array, we first discarded all probes that are masked as NA (Not Available) in the level 3 files from the TCGA database. A probe is masked as NA at level three if (1) the detection P value is greater than 0.05 (which means that the measured signal is not significantly different from background), (2) the probe contains known SNPs after comparison with the dbSNP database or (3) the probe contains DNA sequences of known repetitive elements in more than 10 bp of each 50 bp probe sequence.Citation31 After all NA-labeled probes were removed, a total of 24 049 probes remained. We next discarded all probes with a detection P value above 0.05 in our own data sets, which led to a set of 22 437 remaining probes. After discarding probes mapped to the X-chromosome,Citation25 we obtained the final set of 21 528 probes that we used in our statistical analysis.
To ensure data quality, all probes were reviewed against a list of known cross-reactive probes.Citation70 None of the probes reported in and were included in that list. Chen et al.Citation70 also provided a list of SNPs that confound the differential methylation data. All probes with known SNPs at the interrogated CpG nucleotide were removed in our data pre-processing step. However, among the 12 probes reported in and , probes cg21032583 (LMLN), cg20312687 (DEFB118), cg04947157 (TMC6), cg07014174 (KRTAP11-1), and cg12334759 (ODF3L2) contained annotated SNPs within the 50 bp probe hybridization sequences. Probe cg07014174 (KRTAP11-1) contains a SNP at the single-base extension position (rs201993626, with a very low frequency of 1/2184 in dbSNP137).
Cell-line data from ENCODE
The methylation data for immortalized cell lines is available through the UCSC Human Genome Browser: HAIB Methyl450K track. Methylation data were acquired using the Illumina Infinium HumanMethylation 450K Bead Array platform. Beta values in the original data set had been scaled by 1000, although we removed this scaling factor to ensure that methylation values used in our study were normalized between 0 and 1, as was the case for the other data sets. The data were from Release 1 (December 2011), and included corrections that were made in May 2012. More details about the cell lines can be found in Table S1.
For the analysis of DNaseI hypersensitivity, we used data from the Digital DNaseI Hypersensitivity Clusters track at UCSC. This track includes clusters of DNaseI hypersensitivity peaks for a total of 125 ENCODE cell lines or conditions. A total of 99 out of the 125 samples were annotated as having either cancer (n = 28) or normal (n = 71) karyotypes in the ENCODE cell line metadata, which means that the cell lines were derived from either cancerous or normal tissues.Citation71 The DNaseI hypersensitivity signal values for every cell line at each of the three clusters that we evaluated, which are located in the ZNF154, CASP8, and VHL promoters, are provided as Table S2.
For the analysis of histone marks, we used data from the Broad Histone track of the UCSC Genome Browser, which contained histone modifications measured using ChIP-Seq. In particular, we studied values of H3K4me3 and H3K27ac. We downloaded .bigWig files containing signal information for 8 normal cell lines: GM12878, HSMM (skeletal muscle myoblasts), HSMMtube (skeletal muscle myotubes), HUVEC (umbilical vein endothelial), Monocytes-CD14+_RO01746, NH-A (astrocytes), NHEK (epidermal keratinocytes), and Osteobl (osteoblasts). We also downloaded data for 4 cancer cell lines: DND41 (T cell leukemia), HeLa-S3 (cervical carcinoma), HepG2 (hepatocellular carcinoma), and K562 (chronic myelogenous leukemia).
Bisulfite amplicon sequencing
Sample preparation
For comparison of K562 and GM12878 cell lines, we used the EZ DNA Methylation-Direct Kit (Zymo Research) and used 20 ng of total genomic DNA for bisulfite conversion. To generate a 302 bp PCR product from ZNF154, we used 2 primers: Forward (5′- GGTTTTTATT TTAGGTTTGA-3′) and reverse
(5′-AAATCTATAA AAACTACATT ACCTAAAATA CTCTA-3′). PCR reactions used 0.25 μL of 5 U/μL AmpliTaq Gold DNA Polymerase with GeneAmp 10× PCR Buffer (Applied Biosystems), 5 μL of 25 mM MgCl2, 6 μL of 2.5 mM dNTP mix, 1.5 μL of each 12.5 μM primers, in 50 μL total volume. Cycling conditions were 96 °C for 5 min; followed by 96 °C for 30 s; 48 °C for 30 s; 72 °C for 60 s for 45 cycles; and a 72 °C for 7 min final extension. Products were verified by electrophoresis on a 1.5% agarose gel. Products were sequenced at the NIH Intramural Sequencing Center using the MiSeq platform.
Computational methods
Sequenced 200 base paired-end reads were stitched together to produce single 302 bp reads (over 4 000 000 reads for each sample). For convenience, the methylation status of the reads was analyzed using bismark (version 7.0.9),Citation72 which used the bowtie2 aligner (version 2.1.0).Citation73 Bismark alignment and accompanying tools generate output in a convenient format, providing single-C level methylation (more precisely, non-conversion after bisulfite treatment) statistics and allowing easy post-processing, e.g., counting numbers of methylated CpGs per individual reads ().
TCGA Data
DNA methylation data
To assess levels of differential methylation observed in ovarian and endometrial cancer samples and in the ENCODE cell lines at the seven specific genomic locations shown in , we downloaded methylation data from TCGA corresponding to 16 different cancer types (http://tcga-data.nci.nih.gov/tcga), as shown in together with the number of available samples for each type. These were the only cancer types for which methylation data were available for both tumors and controls at the start of our analysis (February 2013). The TCGA methylation data were generated using either the Illumina HumanMethylation27 or the Illumina HumanMethylation450 platforms. All data were level 3 data.
RNA-Seq data
We also downloaded RNA-Seq data from the same TCGA sample set in order to analyze the correlation between DNA methylation at loci of interest and the expression of associated genes. With the exception of stomach cancer, data for all cancer types were labeled as RNA-Seq Version 2. They had been analyzed at the University of North Carolina using the Illumina HiSeq platform and the SeqWare Pipeline project, version 0.7.0 with the MapspliceRSEM workflow and MapSpliceCitation74 for genome alignment. We utilized RSEM expression estimatesCitation75 at the gene level, which had been normalized to set the upper quartile count at 1000. For the stomach cancer (STAD) type, we used RNA-Seq data (as opposed to RNA-Seq V2), and more precisely RPKM values that came from the Illumina Genome Analyzer (GA) platform.
Exploratory analysis of batch effects
Large-scale data sets, such as the methylation data provided by TCGA, include samples collected in different institutions at different times, and therefore are prone to batch effects.Citation27,Citation76 We took several steps to assess the impact of biased variation in our analysis. For example, we considered three different surrogate variables: tissue source of origin, batch ID, and plate ID (as defined by TCGA). First, we performed an exploratory visual analysis by drawing a separate heat map for each cancer type where samples were arranged along the vertical axis based on an unsupervised correlation clustering (using the top 500 probes in terms of variance, results not shown). We observed that samples sharing the same “tumor” or “control” label clustered together, but the surrogate variables exhibited a rather heterogeneous arrangement without noticeable clusters, which suggests that batch effects have a small impact on these data sets.Citation76 Next, we computed the Dispersion Separability Criterion (DSC) metricCitation77 for each individual cancer type, as suggested by the TCGA Batch Effect tool and website from the MD Anderson Center (http://bioinformatics.mdanderson.org/main/TCGABatchEffects:Overview). DSC values for every cancer type were below 0.5, which corresponds to negligible batch effects (Fig. S6A). We also computed the total variability of the class label that is explained by the top five principal components in each cancer type and we compared it to the variability explained for the surrogate variables (Fig. S6B). For most cancer types, the top five principal components explain a much larger percentage of the variability in the class label than the variability in the surrogate variables, which is an additional indicator of minimal batch effects.
Statistical analysis
All computations involved in our data analysis were performed using the R statistical package. All the genomic coordinates mentioned in this manuscript correspond to the GRCh37/hg19 build of the human genome.
Selection of differentially methylated probes in gynecologic cancer samples
In the case of serous tumors vs. controls, we first discarded all probes lacking differential methylation between tumors and controls based on a two-tailed Wilcoxon rank-sum test. For this, we followed a leave-one-batch-out (LOBO) approach because the set of 99 samples for the serous case (including 16 controls) came from six different batches (based on collection times and tissue sources). Leaving out samples associated with each batch, one batch at a time, we ran a two-tailed Wilcoxon rank-sum test for each genomic location. We used Holm’s correction for multiple hypotheses. For each fold of the LOBO loop, we obtained a set of loci that were differentially methylated between tumors and controls when samples associated with a particular batch were left out. We chose our preliminary set of differentially methylated loci as the set of genomic locations that had adjusted P values below 0.05 for every fold of the LOBO loop. We then computed the difference between median methylation in tumors and median methylation in controls for each probe, and we ranked all the 21 528 probes according to the value of this difference. We created a second ranking using difference of means instead of difference of medians. Our list of probes that are hypermethylated in serous tumors, as compared with controls, was chosen as the probes that (1) appeared in the list of probes that had been preselected using the Wilcoxon LOBO procedure and (2) were ranked among the top 100 scorers in terms of the largest differences in tumors minus controls using both the mean and median based rankings. This list contained a total of 13 probes. The set of probes hypomethylated in tumors were selected using the same criterion, but requiring that the probes were among the top 100 scorers in terms of the largest differences in controls minus tumors. This list contained a total of 62 probes and is provided, together with the list of 13 hypermethylated probes, as Table S3. We ran the same analysis for endometrioid vs. control samples, for which we had 53 tumor samples and 12 normal endometrial controls coming from 7 different batches. We obtained 7 probes that are hypermethylated in endometrioid tumors and 53 probes that are hypomethylated in endometrioid tumors, respectively (Table S4). Our final list of hypermethylated genomic locations in ovarian and endometrial cancer was obtained as the set of probes that were present both in the serous and endometrioid lists of hypermethylated probes. This list consisted of a single element, namely probe cg21790626 located at the promoter of ZNF154. Our final list of loci hypomethylated in tumors was obtained following the same approach and contained 11 different probes ().
Correlation of ZNF154 and CpG island methylation on a genome-wide scale () was measured by first selecting the top 500 probes of the highest variance levels across all our samples (following the procedure described in Kolbe et al.Citation25) and then discarding probes that were not located in CpG islands. A total of 380 probes remained, which constituted the reference set used in . We then randomly selected a million sets of 380 probes located at CpG islands across the entire genome. For each one of those sets, we computed the Spearman correlation coefficient between the vector of average β values across the 380 probes and the vector of β values for probe cg21790626-ZNF154. We also computed the corresponding P values, using the standard algorithm implemented by the ‘cor.test’ function from the R statistical package. We did this separately for the serous and endometrioid cases (). The vertical, discontinuous line drawn at -log(0.05) shows the threshold for statistical significance. A total of 321 100 random sets (~32%) had P values above this threshold for the endometrioid case, while only 52 322 random sets (~5%) reached statistical significance using the serous samples.
Analysis of correlation between methylation and expression using TCGA data
Using the samples for which we had both methylation and expression data, we computed Spearman correlation coefficients for each probe-gene pair in . Probe-gene assignments had originally been made using the annotations provided by Illumina for the HumanMethylation27 platform. Probe cg13897627 (FLJ44674), was not associated with any transcripts for which expression data were available and therefore we ignored it for the purpose of our correlation analysis.
Analysis of DNaseI hypersensitivity
For the test of association analysis, we compared the fraction of normal and cancer cell lines that were included in each DNaseI hypersensitivity cluster, or equivalently the sets of cell lines showing non-zero signal (i.e., peaks) of DNaseI hypersensitivity. We used a one-sided Fisher’s exact test to assess statistical significance. For comparison of the mean values of DNaseI hypersensitivity in cancer vs. normal cell lines (), we computed the mean value of methylation over the 71 normal cell lines and the 28 cancer cell lines assayed by ENCODE. The error bars in show a 95% confidence interval centered at the sample mean (i.e., an interval that extends to a distance of 1.96 times the standard error of the mean at each side of the mean value). We provide results for GAPDH, which is a well-known housekeeping gene, as a positive control for which every one of the 125 cell lines has non-zero DNaseI hypersensitivity signal.
Analysis of histone modifications
We extracted mean signal values over the three regions of interest from .bigWig files using the bigWigAverageOverBed utility developed by Jim Kent at UCSC. We ran the code using two different options: one which computed averages over all bases within the island with non-covered bases counting as zeroes and a second one where averages were computed using only covered bases and ignoring the rest. The results that we report correspond to the first run, but the conclusions of the analysis were consistent for the two runs. For the case of ZNF154, we computed the average value of the histone marks over the entire CpG island located at chr19:58 220 189–58 220 517, which contains probe cg21790626. In order to evaluate histone marks near the probes associated to CASP8 and VHL, we computed averages over 52 bp regions centered at the CpG dinucleotide interrogated by the corresponding Illumina probe. Mean values in cancer vs. normal cell lines at these regions for the two histone marks used in our analysis are shown in , where we also provide error bars showing a 95% confidence interval for each of the estimated means. As we had done for the DNaseI hypersensitivity analysis, we included results for housekeeping gene GAPDH as a positive control (in this case, results were averaged around a region of 52 bp centered at the CpG dinucleotide interrogated by Illumina probe cg15869694, which is located at chr12:6 643 747). We also provide mean values for each histone mark as a reference intended to facilitate comparison with the background distribution. These values were first computed over 52 bp regions centered at the CpG dinucleotides interrogated by every probe in the Illumina 450K array, and then averaged across all probes and all the cell lines in the data set.
| Abbreviations: | ||
| ENCODE | = | Encyclopedia of DNA Elements |
| TCGA | = | The Cancer Genome Atlas |
Additional material
Download Zip (3 MB)Acknowledgments
This work was supported by the Intramural Program of the National Human Genome Research Institute, National Institutes of Health. We thank Elaine Lewis, Alexandra Scott, and Kornel Schuebel for critical reading of the manuscript. We also thank Meghan Rudd for technical assistance.
Disclosure of Potential Conflicts of Interest
No potential conflicts of interest were disclosed.
Supplemental Materials
Supplemental materials may be found here: http://www.landesbioscience.com/journals/epigenetics/article/26701/
References
- Robertson KD. DNA methylation and human disease. Nat Rev Genet 2005; 6:597 - 610; http://dx.doi.org/10.1038/nrg1655; PMID: 16136652
- Jaenisch R, Bird A. Epigenetic regulation of gene expression: how the genome integrates intrinsic and environmental signals. Nat Genet 2003; 33:Suppl 245 - 54; http://dx.doi.org/10.1038/ng1089; PMID: 12610534
- Portela A, Esteller M. Epigenetic modifications and human disease. Nat Biotechnol 2010; 28:1057 - 68; http://dx.doi.org/10.1038/nbt.1685; PMID: 20944598
- Baylin SB, Jones PA. A decade of exploring the cancer epigenome - biological and translational implications. Nat Rev Cancer 2011; 11:726 - 34; http://dx.doi.org/10.1038/nrc3130; PMID: 21941284
- Sproul D, Meehan RR. Genomic insights into cancer-associated aberrant CpG island hypermethylation. Brief Funct Genomics 2013; 12:174 - 90; http://dx.doi.org/10.1093/bfgp/els063; PMID: 23341493
- Heichman KA, Warren JD. DNA methylation biomarkers and their utility for solid cancer diagnostics. Clin Chem Lab Med 2012; 50:1707 - 21; http://dx.doi.org/10.1515/cclm-2011-0935; PMID: 23089699
- Jones PA, Baylin SB. The fundamental role of epigenetic events in cancer. Nat Rev Genet 2002; 3:415 - 28
- Rodríguez-Paredes M, Esteller M. Cancer epigenetics reaches mainstream oncology. Nat Med 2011; 17:330 - 9; http://dx.doi.org/10.1038/nm.2305; PMID: 21386836
- Esteller M. Epigenetic changes in cancer. F1000 Biol Rep 2011; 3:9; http://dx.doi.org/10.3410/B3-9; PMID: 21655338
- Bock C. Analysing and interpreting DNA methylation data. Nat Rev Genet 2012; 13:705 - 19; http://dx.doi.org/10.1038/nrg3273; PMID: 22986265
- Irizarry RA, Ladd-Acosta C, Wen B, Wu Z, Montano C, Onyango P, Cui H, Gabo K, Rongione M, Webster M, et al. The human colon cancer methylome shows similar hypo- and hypermethylation at conserved tissue-specific CpG island shores. Nat Genet 2009; 41:178 - 86; http://dx.doi.org/10.1038/ng.298; PMID: 19151715
- Jones PA. Functions of DNA methylation: islands, start sites, gene bodies and beyond. Nat Rev Genet 2012; 13:484 - 92; http://dx.doi.org/10.1038/nrg3230; PMID: 22641018
- Chi P, Allis CD, Wang GG. Covalent histone modifications--miswritten, misinterpreted and mis-erased in human cancers. Nat Rev Cancer 2010; 10:457 - 69; http://dx.doi.org/10.1038/nrc2876; PMID: 20574448
- Cedar H, Bergman Y. Linking DNA methylation and histone modification: patterns and paradigms. Nat Rev Genet 2009; 10:295 - 304; http://dx.doi.org/10.1038/nrg2540; PMID: 19308066
- Esteller M. Cancer epigenomics: DNA methylomes and histone-modification maps. Nat Rev Genet 2007; 8:286 - 98; http://dx.doi.org/10.1038/nrg2005; PMID: 17339880
- Weisenberger DJ, Siegmund KD, Campan M, Young J, Long TI, Faasse MA, Kang GH, Widschwendter M, Weener D, Buchanan D, et al. CpG island methylator phenotype underlies sporadic microsatellite instability and is tightly associated with BRAF mutation in colorectal cancer. Nat Genet 2006; 38:787 - 93; http://dx.doi.org/10.1038/ng1834; PMID: 16804544
- Ye D, Xiong Y, Guan K-L. The mechanisms of IDH mutations in tumorigenesis. Cell Res 2012; 22:1102 - 4; http://dx.doi.org/10.1038/cr.2012.51; PMID: 22453240
- Reinert T, Borre M, Christiansen A, Hermann GG, Ørntoft TF, Dyrskjøt L. Diagnosis of bladder cancer recurrence based on urinary levels of EOMES, HOXA9, POU4F2, TWIST1, VIM, and ZNF154 hypermethylation. Christensen BC, ed. PLoS One 2012; 7(10):e46297;
- Yin A, Zhang X, Wu J, Du L, He T, Zhang X. Screening significantly hypermethylated genes in fetal tissues compared with maternal blood using a methylated-CpG island recovery assay-based microarray. BMC Med Genomics 2012; 5:26; http://dx.doi.org/10.1186/1755-8794-5-26; PMID: 22709530
- Lange CPE, Campan M, Hinoue T, et al. Genome-scale discovery of DNA-methylation biomarkers for blood-based detection of colorectal cancer. Marsit CJ, ed. PLoS One 2012; 7(11):e50266;
- Carmona FJ, Azuara D, Berenguer-Llergo A, Fernández AF, Biondo S, de Oca J, Rodriguez-Moranta F, Salazar R, Villanueva A, Fraga MF, et al. DNA methylation biomarkers for noninvasive diagnosis of colorectal cancer. Cancer Prev Res (Phila) 2013; 6:656 - 65; http://dx.doi.org/10.1158/1940-6207.CAPR-12-0501; PMID: 23694962
- Ma Y, Wang X, Jin H. Methylated DNA and microRNA in Body Fluids as Biomarkers for Cancer Detection. Int J Mol Sci 2013; 14:10307 - 31; http://dx.doi.org/10.3390/ijms140510307; PMID: 23681012
- Heyn H, Esteller M. DNA methylation profiling in the clinic: applications and challenges. Nat Rev Genet 2012; 13:679 - 92; http://dx.doi.org/10.1038/nrg3270; PMID: 22945394
- Herman JG, Latif F, Weng Y, Lerman MI, Zbar B, Liu S, Samid D, Duan DS, Gnarra JR, Linehan WM, et al. Silencing of the VHL tumor-suppressor gene by DNA methylation in renal carcinoma. Proc Natl Acad Sci U S A 1994; 91:9700 - 4; http://dx.doi.org/10.1073/pnas.91.21.9700; PMID: 7937876
- Kolbe DL, DeLoia JA, Porter-Gill P, et al. Differential analysis of ovarian and endometrial cancers identifies a methylator phenotype. Califano J, ed. PLoS One 2012; 7(3):e32941;
- Leek JT, Scharpf RB, Bravo HC, Simcha D, Langmead B, Johnson WE, Geman D, Baggerly K, Irizarry RA. Tackling the widespread and critical impact of batch effects in high-throughput data. Nat Rev Genet 2010; 11:733 - 9; http://dx.doi.org/10.1038/nrg2825; PMID: 20838408
- Harper KN, Peters BA, Gamble MV. Batch effects and pathway analysis: two potential perils in cancer studies involving DNA methylation array analysis. Cancer Epidemiol Biomarkers Prev 2013; 22:1052 - 60; http://dx.doi.org/10.1158/1055-9965.EPI-13-0114; PMID: 23629520
- Varley KE, Gertz J, Bowling KM, Parker SL, Reddy TE, Pauli-Behn F, Cross MK, Williams BA, Stamatoyannopoulos JA, Crawford GE, et al. Dynamic DNA methylation across diverse human cell lines and tissues. Genome Res 2013; 23:555 - 67; http://dx.doi.org/10.1101/gr.147942.112; PMID: 23325432
- Cancer Genome Atlas Research Network. Comprehensive genomic characterization of squamous cell lung cancers. Nature 2012; 489:519 - 25; http://dx.doi.org/10.1038/nature11404; PMID: 22960745
- Cancer Genome Atlas Research Network. Comprehensive genomic characterization defines human glioblastoma genes and core pathways. Nature 2008; 455:1061 - 8; http://dx.doi.org/10.1038/nature07385; PMID: 18772890
- Cancer Genome Atlas Research Network. Integrated genomic analyses of ovarian carcinoma. Nature 2011; 474:609 - 15; http://dx.doi.org/10.1038/nature10166; PMID: 21720365
- Cancer Genome Atlas Network. Comprehensive molecular characterization of human colon and rectal cancer. Nature 2012; 487:330 - 7; http://dx.doi.org/10.1038/nature11252; PMID: 22810696
- Cancer Genome Atlas Network. Comprehensive molecular portraits of human breast tumours. Nature 2012; 490:61 - 70; http://dx.doi.org/10.1038/nature11412; PMID: 23000897
- Kandoth C, Schultz N, Cherniack AD, Akbani R, Liu Y, Shen H, Robertson AG, Pashtan I, Shen R, Benz CC, et al, Cancer Genome Atlas Research Network. Integrated genomic characterization of endometrial carcinoma. Nature 2013; 497:67 - 73; http://dx.doi.org/10.1038/nature12113; PMID: 23636398
- Bernstein BE, Birney E, Dunham I, Green ED, Gunter C, Snyder M, ENCODE Project Consortium. An integrated encyclopedia of DNA elements in the human genome. Nature 2012; 489:57 - 74; http://dx.doi.org/10.1038/nature11247; PMID: 22955616
- Hansen KD, Timp W, Bravo HC, Sabunciyan S, Langmead B, McDonald OG, Wen B, Wu H, Liu Y, Diep D, et al. Increased methylation variation in epigenetic domains across cancer types. Nat Genet 2011; 43:768 - 75; http://dx.doi.org/10.1038/ng.865; PMID: 21706001
- Zhuang J, Jones A, Lee S-H, et al. The dynamics and prognostic potential of DNA methylation changes at stem cell gene loci in women’s cancer. Absher D, ed. PLoS Genet 2012; 8(2):e1002517;
- Sproul D, Kitchen RR, Nestor CE, Dixon JM, Sims AH, Harrison DJ, Ramsahoye BH, Meehan RR. Tissue of origin determines cancer-associated CpG island promoter hypermethylation patterns. Genome Biol 2012; 13:R84; http://dx.doi.org/10.1186/gb-2012-13-10-r84; PMID: 23034185
- May T, Virtanen C, Sharma M, Milea A, Begley H, Rosen B, Murphy KJ, Brown TJ, Shaw PA. Low malignant potential tumors with micropapillary features are molecularly similar to low-grade serous carcinoma of the ovary. Gynecol Oncol 2010; 117:9 - 17; http://dx.doi.org/10.1016/j.ygyno.2010.01.006; PMID: 20117829
- Ogino S, Kawasaki T, Kirkner GJ, Ohnishi M, Fuchs CS. 18q loss of heterozygosity in microsatellite stable colorectal cancer is correlated with CpG island methylator phenotype-negative (CIMP-0) and inversely with CIMP-low and CIMP-high. BMC Cancer 2007; 7:72; http://dx.doi.org/10.1186/1471-2407-7-72; PMID: 17474983
- Ogino S, Kawasaki T, Kirkner GJ, Loda M, Fuchs CS. CpG island methylator phenotype-low (CIMP-low) in colorectal cancer: possible associations with male sex and KRAS mutations. J Mol Diagn 2006; 8:582 - 8; http://dx.doi.org/10.2353/jmoldx.2006.060082; PMID: 17065427
- Strathdee G, Appleton K, Illand M, Millan DW, Sargent J, Paul J, Brown R. Primary ovarian carcinomas display multiple methylator phenotypes involving known tumor suppressor genes. Am J Pathol 2001; 158:1121 - 7; http://dx.doi.org/10.1016/S0002-9440(10)64059-X; PMID: 11238060
- Keshet I, Lieman-Hurwitz J, Cedar H. DNA methylation affects the formation of active chromatin. Cell 1986; 44:535 - 43; http://dx.doi.org/10.1016/0092-8674(86)90263-1; PMID: 3456276
- Karlić R, Chung H-R, Lasserre J, Vlahovicek K, Vingron M. Histone modification levels are predictive for gene expression. Proc Natl Acad Sci U S A 2010; 107:2926 - 31; http://dx.doi.org/10.1073/pnas.0909344107; PMID: 20133639
- Ooi SKT, Qiu C, Bernstein E, Li K, Jia D, Yang Z, Erdjument-Bromage H, Tempst P, Lin SP, Allis CD, et al. DNMT3L connects unmethylated lysine 4 of histone H3 to de novo methylation of DNA. Nature 2007; 448:714 - 7; http://dx.doi.org/10.1038/nature05987; PMID: 17687327
- Okitsu CY, Hsieh C-L. DNA methylation dictates histone H3K4 methylation. Mol Cell Biol 2007; 27:2746 - 57; http://dx.doi.org/10.1128/MCB.02291-06; PMID: 17242185
- Tommerup N, Vissing H. Isolation and fine mapping of 16 novel human zinc finger-encoding cDNAs identify putative candidate genes for developmental and malignant disorders. Genomics 1995; 27:259 - 64; http://dx.doi.org/10.1006/geno.1995.1040; PMID: 7557990
- Laity JH, Lee BM, Wright PE. Zinc finger proteins: new insights into structural and functional diversity. Curr Opin Struct Biol 2001; 11:39 - 46; http://dx.doi.org/10.1016/S0959-440X(00)00167-6; PMID: 11179890
- O’Geen H, Squazzo SL, Iyengar S, et al. Genome-wide analysis of KAP1 binding suggests autoregulation of KRAB-ZNFs. Ecker JR, ed. PLoS Genet 2007; 3(6):e89;
- Long HK, Blackledge NP, Klose RJ. ZF-CxxC domain-containing proteins, CpG islands and the chromatin connection. Biochem Soc Trans 2013; 41:727 - 40; http://dx.doi.org/10.1042/BST20130028; PMID: 23697932
- Abdollahi A, Roberts D, Godwin AK, Schultz DC, Sonoda G, Testa JR, Hamilton TC. Identification of a zinc-finger gene at 6q25: a chromosomal region implicated in development of many solid tumors. Oncogene 1997; 14:1973 - 9; http://dx.doi.org/10.1038/sj.onc.1201034; PMID: 9150364
- Hajra KM, Chen DY-S, Fearon ER. The SLUG zinc-finger protein represses E-cadherin in breast cancer. Cancer Res 2002; 62:1613 - 8; PMID: 11912130
- Zhang X, Jing Y, Qin Y, Hunsucker S, Meng H, Sui J, Jiang Y, Gao L, An G, Yang N, et al. The zinc finger transcription factor ZKSCAN3 promotes prostate cancer cell migration. Int J Biochem Cell Biol 2012; 44:1166 - 73; http://dx.doi.org/10.1016/j.biocel.2012.04.005; PMID: 22531714
- Vanaja DK, Cheville JC, Iturria SJ, Young CYF. Transcriptional silencing of zinc finger protein 185 identified by expression profiling is associated with prostate cancer progression. Cancer Res 2003; 63:3877 - 82; PMID: 12873976
- Yu Q, Zhang K, Wang X, Liu X, Zhang Z. Expression of transcription factors snail, slug, and twist in human bladder carcinoma. J Exp Clin Cancer Res 2010; 29:119; http://dx.doi.org/10.1186/1756-9966-29-119; PMID: 20809941
- Reinert T, Modin C, Castano FM, Lamy P, Wojdacz TK, Hansen LL, Wiuf C, Borre M, Dyrskjøt L, Orntoft TF. Comprehensive genome methylation analysis in bladder cancer: identification and validation of novel methylated genes and application of these as urinary tumor markers. Clin Cancer Res 2011; 17:5582 - 92; http://dx.doi.org/10.1158/1078-0432.CCR-10-2659; PMID: 21788354
- Hill VK, Ricketts C, Bieche I, Vacher S, Gentle D, Lewis C, Maher ER, Latif F. Genome-wide DNA methylation profiling of CpG islands in breast cancer identifies novel genes associated with tumorigenicity. Cancer Res 2011; 71:2988 - 99; http://dx.doi.org/10.1158/0008-5472.CAN-10-4026; PMID: 21363912
- Poage GM, Butler RA, Houseman EA, McClean MD, Nelson HH, Christensen BC, Marsit CJ, Kelsey KT. Identification of an epigenetic profile classifier that is associated with survival in head and neck cancer. Cancer Res 2012; 72:2728 - 37; http://dx.doi.org/10.1158/0008-5472.CAN-11-4121-T; PMID: 22507853
- Lleras RA, Smith RV, Adrien LR, Schlecht NF, Burk RD, Harris TM, Childs G, Prystowsky MB, Belbin TJ. Unique DNA Methylation Loci Distinguish Anatomic Site and HPV Status in Head and Neck Squamous Cell Carcinoma. Clin Cancer Res 2013; 19:5444 - 55; http://dx.doi.org/10.1158/1078-0432.CCR-12-3280; PMID: 23894057
- Shen J, Wang S, Zhang Y-J, Kappil M, Wu HC, Kibriya MG, Wang Q, Jasmine F, Ahsan H, Lee PH, et al. Genome-wide DNA methylation profiles in hepatocellular carcinoma. Hepatology 2012; 55:1799 - 808; http://dx.doi.org/10.1002/hep.25569; PMID: 22234943
- Okamoto T, Yamaguchi K, Huang Z, et al. Methylated-mediated repression of ZNF154 in ovarian cancer is associated with poor overall survival–[Abstract]. In: Proceedings of the 103rd Annual Meeting of the American Association for Cancer Research 2012; Available at: http://cancerres.aacrjournals.org/cgi/content/short/72/8_MeetingAbstracts/LB-87?rss=1. Accessed June 4, 2013.
- Mahapatra S, Klee EW, Young CYF, Sun Z, Jimenez RE, Klee GG, Tindall DJ, Donkena KV. Global methylation profiling for risk prediction of prostate cancer. Clin Cancer Res 2012; 18:2882 - 95; http://dx.doi.org/10.1158/1078-0432.CCR-11-2090; PMID: 22589488
- Arai E, Chiku S, Mori T, Gotoh M, Nakagawa T, Fujimoto H, Kanai Y. Single-CpG-resolution methylome analysis identifies clinicopathologically aggressive CpG island methylator phenotype clear cell renal cell carcinomas. Carcinogenesis 2012; 33:1487 - 93; http://dx.doi.org/10.1093/carcin/bgs177; PMID: 22610075
- Mazumder S, Almasan A. Is caspase-8 a neuroendocrine lung tumor suppressor?. Cancer Biol Ther 2002; 1:70 - 1; http://dx.doi.org/10.4161/cbt.1.1.46; PMID: 12197486
- Fulda S, Küfer MU, Meyer E, van Valen F, Dockhorn-Dworniczak B, Debatin K-M. Sensitization for death receptor- or drug-induced apoptosis by re-expression of caspase-8 through demethylation or gene transfer. Oncogene 2001; 20:5865 - 77; http://dx.doi.org/10.1038/sj.onc.1204750; PMID: 11593392
- Shiao Y-H. The von Hippel-Lindau gene and protein in tumorigenesis and angiogenesis: a potential target for therapeutic designs. Curr Med Chem 2003; 10:2461 - 70; http://dx.doi.org/10.2174/0929867033456639; PMID: 14529485
- Kondo K, Kaelin WG Jr.. The von Hippel-Lindau tumor suppressor gene. Exp Cell Res 2001; 264:117 - 25; http://dx.doi.org/10.1006/excr.2000.5139; PMID: 11237528
- Miranda TB, Jones PA. DNA methylation: the nuts and bolts of repression. J Cell Physiol 2007; 213:384 - 90; http://dx.doi.org/10.1002/jcp.21224; PMID: 17708532
- Jurkowska RZ, Jeltsch A. Silencing of gene expression by targeted DNA methylation: concepts and approaches. Methods Mol Biol 2010; 649:149 - 61; http://dx.doi.org/10.1007/978-1-60761-753-2_9; PMID: 20680833
- Chen YA, Lemire M, Choufani S, Butcher DT, Grafodatskaya D, Zanke BW, Gallinger S, Hudson TJ, Weksberg R. Discovery of cross-reactive probes and polymorphic CpGs in the Illumina Infinium HumanMethylation450 microarray. Epigenetics 2013; 8:203 - 9; http://dx.doi.org/10.4161/epi.23470; PMID: 23314698
- Rosenbloom KR, Dreszer TR, Long JC, Malladi VS, Sloan CA, Raney BJ, Cline MS, Karolchik D, Barber GP, Clawson H, et al. ENCODE whole-genome data in the UCSC Genome Browser: update 2012. Nucleic Acids Res 2012; 40:Database issue D912 - 7; http://dx.doi.org/10.1093/nar/gkr1012; PMID: 22075998
- Krueger F, Andrews SR. Bismark: a flexible aligner and methylation caller for Bisulfite-Seq applications. Bioinformatics 2011; 27:1571 - 2; http://dx.doi.org/10.1093/bioinformatics/btr167; PMID: 21493656
- Langmead B, Salzberg SL. Fast gapped-read alignment with Bowtie 2. Nat Methods 2012; 9:357 - 9; http://dx.doi.org/10.1038/nmeth.1923; PMID: 22388286
- Wang K, Singh D, Zeng Z, Coleman SJ, Huang Y, Savich GL, He X, Mieczkowski P, Grimm SA, Perou CM, et al. MapSplice: accurate mapping of RNA-seq reads for splice junction discovery. Nucleic Acids Res 2010; 38:e178; http://dx.doi.org/10.1093/nar/gkq622; PMID: 20802226
- Li B, Dewey CN. RSEM: accurate transcript quantification from RNA-Seq data with or without a reference genome. BMC Bioinformatics 2011; 12:323; http://dx.doi.org/10.1186/1471-2105-12-323; PMID: 21816040
- Leek JT, Scharpf RB, Bravo HC, Simcha D, Langmead B, Johnson WE, Geman D, Baggerly K, Irizarry RA. Tackling the widespread and critical impact of batch effects in high-throughput data. Nat Rev Genet 2010; 11:733 - 9; http://dx.doi.org/10.1038/nrg2825; PMID: 20838408
- Dy JG, Brodley CE. Feature Selection for Unsupervised Learning. J Mach Learn Res 2004; 5:845 - 89