Abstract
Restriction-like endonuclease (RLE) bearing non-LTR retrotransposons are site-specific elements that integrate into the genome through a target primed reverse transcription mechanism (TPRT). R2 elements have been used as a model system for investigating non-LTR retrotransposon integration. We previously demonstrated that R2 retrotransposons require two subunits of the element-encoded multifunctional protein to integrate—one subunit bound upstream of the insertion site and one bound downstream. R2 elements have been phylogenetically categorized into four clades: R2-A, B, C, and D, that diverged from a common ancestor more than 850 million years ago. All R2 elements target the same sequence within 28S rDNA. The amino-terminal domain of R2Bm, a R2-D clade element, contains a single zinc finger and a Myb motif that are responsible for binding R2 protein downstream of the insertion site. Target site recognition is of interest as it is the first step in the integration reaction and may help elucidate evolutionary history and integration mechanism. The amino-terminal domain of R2-A clade members contains three zinc fingers and a Myb motif. We show here that R2-Lp, an R2-A clade member, uses its amino-terminal DNA binding motifs to bind upstream of the insertion site. Because the R2-A and R2-D clade elements recognize 28S rDNA differently, we conclude the A- and D-clades represent independent targeting events to the 28S site. Our results also indicate a certain plasticity of insertional mechanics exists between the two clades.
Acknowledgments
The authors would like to thank Dillion Cawley for generating the R2Lp ZF3-Myb clone and for the preliminary footprint trial. The authors would also like to thank Kimberly Bowles, Ph.D., Brad Reveal, Ph.D., and Haridha Shivram for critical reading of the manuscript and Dr. Raymond Jones for helpful advice. Funding generously provided by NSF.
Figures and Tables
Table 1 Primers used in cloning and target DNA preparation
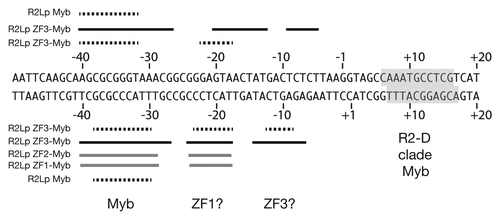
Figure 1 R2 clades and ORF structure. (A) The phylogeny represents the relationships between the known R2 elements based on the reverse transcriptase sequence.Citation5 R2 elements have been divided into four clades—R2-A, B, C and D. The amino-terminal domain structure differs between the clades along phylogenic lines. To date, no amino terminal sequence information is available for the R2-B clade. Key: ZF denotes a zinc finger domain, Myb denotes a Myb domain, RT is the reverse transcriptase, cchc denotes the c-terminal cysteine and histidine motif, and RLE denotes the restriction-like endonuclease. The rectangle represents the element's ORF. Lines projecting out from the rectangle represent the 5′ and 3′ untranslated regions. Drawings are not to scale. (B) Alignment of R2 insertion site from representative organisms along with what clades are found in each organism.Citation4–Citation6 The numbering is centered on the insertion site of R2 with upstream flanking DNA given in negative numbers and downstream flanking DNA in positive numbers.
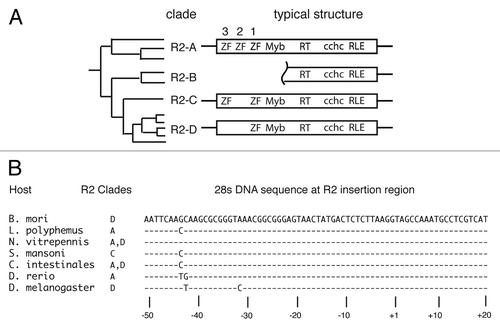
Figure 2 Expression constructs. Thick solid lines denote the segment of the R2Lp and R2Bm ORFs that were expressed in bacteria and purified using engineered 6x His tags. The clone names are to the right of the solid lines. See Materials and Methods for additional information.
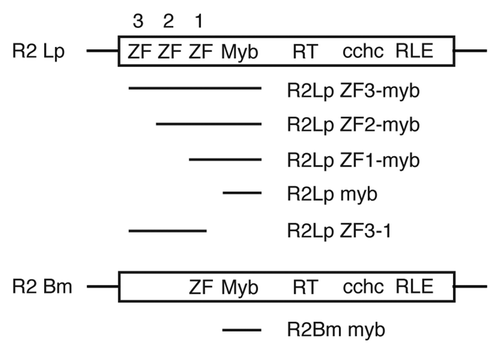
Figure 3 Electrophoretic mobility shift assay. (A) R2Lp ZF3-Myb forms a protein:DNA complex in the presence of 150 bp 28S rDNA target sequence. Lane 1 is the reference lane for DNA migration in the absence of protein (ref.). Lane 2 shows a mobility shift of the DNA in the presence of R2Lp ZF3-Myb protein (bound vs. free). Lane 3 is in the presence of the negative control pGUS protein. Greater that 10X more pGus protein extract was used than R2Lp ZF3-Myb. Lanes 1 and 2 came from the different parts of a gel that smiled during running. Lane 3 came from a separate gel. (B) R2Lp ZF3-Myb bound to the 32P-labeled 49 bp half site target sequences. The efficiency of 32P-labeling was greater for the upstream DNA. Equal amounts of DNA used in lanes 1–4. Lanes 1 and 2 are upstream DNA. Lanes 3 and 4 are downstream DNA. Lanes 1 and 3 are reference lanes for DNA migration in the absence of protein. Lanes 2 and 4 are in the presence of R2Lp ZF3-Myb protein. An equal amount of protein was used in lanes 2 and 4. All lanes came from different parts of the same gel.
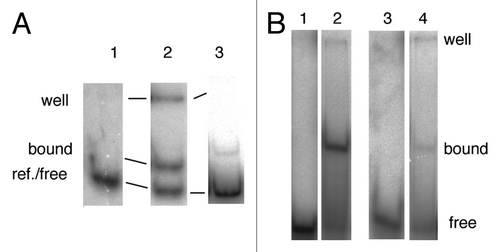
Figure 4 DNase I footprint of the R2Lp ZF3-Myb polypeptide. The denaturing polyacrylamide gel used to assay the DNase I footprint of the R2Lp ZF3-Myb polypeptide bound to top or bottom strand 32P end labeled 150 bp target DNA substrate is presented. Top strand labeled data is on the left and bottom strand labeled data is on the right. The lanes marked A+G are adenosine plus guanosine cleaved target DNAs that are used as linear guides to determine location along the target DNA. The lanes marked “bound” and “ref.” are protein:DNA complexes treated with DNase I and naked-DNA treated with DNase I, respectively, that were fractionated by EMSA and analyzed by denaturing gel electrophoresis. Regions of DNA that are protected from DNase I degradation by the presence of the R2Lp ZF3-Myb polypeptide are marked with thick black lines. Short thick black lines mark polypeptide binding induced DNase I hypersensitive sites.
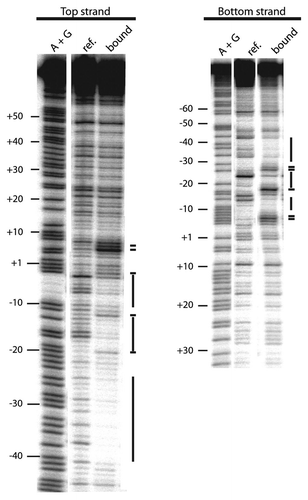
Figure 5 Missing nucleoside footprint of the R2Lp ZF3-Myb polypeptide. The denaturing polyacrylamide gel used to assay the missing nucleoside footprint of the R2Lp ZF3-Myb polypeptide bound to the 150 bp target DNA substrate is presented. Top strand labeled data is on the left and bottom strand labeled data is on the right. The lanes marked A+G are adenosine plus guanosine cleaved target DNAs that are used linear guides to determine location along the target DNA. The lanes marked “ref.” is the hydroxyradical treated DNA (i.e., the “missing nucleoside” DNA). The lanes marked “free” and “bound” are missing nucleoside DNA that was exposed to protein in a binding reaction in which about 50% of the DNA substrate was bound by protein. The bound and free DNA fractions in the binding reaction were fractionated by EMSA prior to denaturing gel electrophoresis. Nucleotides involved in DNA binding are marked with a black dotted line.
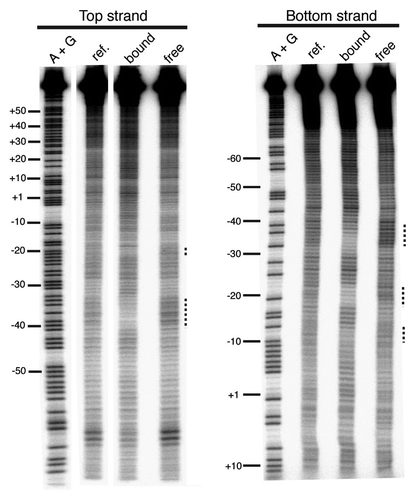
Figure 6 Missing nucleoside footprint of R2-A and R2-D clade Myb polypeptides. Part A is the R2Lp Myb footprint data. Part B is the R2Bm Myb footprint data. Lanes and markings are as in . The R2Bm data is in agreement with reference Citation25.
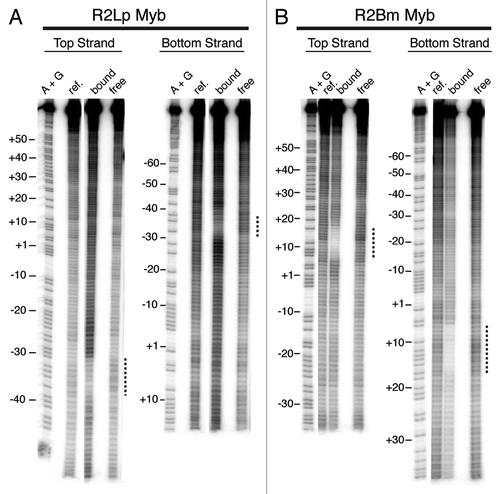
Figure 7 Summary of R2Lp footprint data. The footprint data generated for each polypeptide examined is overlaid on a linear DNA sequence. The R2Lp polypeptide that generated a given footprint is listed to the left. Black dotted lines denote missing nucleoside footprint data from and . Thick black and thick gray lines denote DNase I footprint data from and the Supplemental Figure respectively. For clarity, the DNase I hypersensitive sites have been left out. The R2-A clade Myb binding site (Myb) is marked as are the hypothesized zinc finger (ZF) binding sites (deduced from , and the Sup. Fig.). The binding of the R2-D clade Myb (see ) is indicated by a gray box.