Abstract
The principal human blood granulocyte (neutrophil) possesses a lobulated and deformable nucleus, important to facilitate rapid egress from blood vessels as these cells migrate to sites of bacterial or fungal infection. This unusual nuclear shape is a product of elevated levels of an integral membrane protein of the nuclear envelope lamin B receptor (LBR) and of decreased amounts of lamin A/C. In humans, a genetic deficiency of LBR produces Pelger-Huët anomaly, resulting in blood neutrophils that exhibit hypolobulated nuclei with redistributed heterochromatin. Structural changes in nuclear architecture occur during granulopoiesis within bone marrow. The exact mechanisms of this nuclear shape change and of heterochromatin redistribution remain largely unknown. As a tool to facilitate analysis of these mechanisms, a stable LBR knockdown subline of HL-60 cells was established. During in vitro granulopoiesis induced with retinoic acid, the LBR knockdown cells retain an ovoid shaped nucleus with reduced levels of lamin A/C; whereas, the parent cells develop lobulated nuclei. Macrophage forms induced in LBR knockdown cells by in vitro treatment with phorbol ester were indistinguishable from the parent cells, comparing both nuclear shape and attached cell morphology. The capability of differentiation of LBR knockdown HL-60 cells should facilitate a detailed analysis of the molecular relationship between LBR levels, granulocyte nuclear shape and heterochromatin distribution.
Acknowledgements
A.L.O. and D.E.O. wish to express their gratitude to Harald Herrmann and Peter Lichter for generously hosting us in their laboratories at the German Cancer Research Center (DKFZ, Heidelberg), during which time this work was performed. Gratitude is also expressed to the Department of Biology, Bowdoin College for encouraging us to continue scientific research. Cristina Pallares-Cartes (DKFZ) kindly provided the Drosophila samples. In addition, A.L.O. and D.E.O. thank Kati Toth and Jörg Langowski (DKFZ) and Andreas Ladurner (EMBL, Heidelberg) for gifts of HeLa mononucleosomal histones and recombinant Xenopus inner histones, and to Thorsten Kolb (DKFZ) for the gift of guinea pig anti-lamin A. Thanks are also extended to the ever-helpful team in the Herrmann group “Functional Architecture of the Cell”; Michaela Hergt, Helga Kleiner, Tanja Lichtenstern, Monika Mauermann and Dorothee Möller.
Figures and Tables
Figure 1 Immunostaining of mammalian tissue culture cells with selected mouse monoclonal anti-nucleosome antibodies. Cell types: (A) HL-60/S4; (B) U2OS. Mouse mAbs (PL2-6, PL2-7 and LG10-1) staining are shown in red: DAPI staining in blue. The arrows denote mitotic cells. The arrowheads point to prophase nuclei. Each image is a single deconvolved optical slice. Bar equals 10 µm for both (A and B).
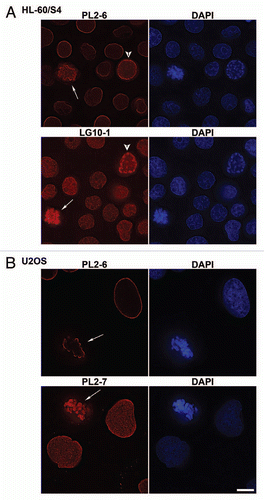
Figure 2 Immunostaining of the epichromatin epitope through mitosis in U2OS (A) and HL-60/S4 (B) cells. Mouse mAb PL2-6 staining is shown in red; DAPI staining in blue. Each image is a single deconvolved optical slice. Bar equals 10 µm for both (A and B). Projection videos for some of these images of U2OS can be found in the Supplementary Video Files, specifically: late prophase (Video 1); early anaphase (Video 2); late anaphase (Video 3); early telophase (Video 4); late telophase (Video 5).
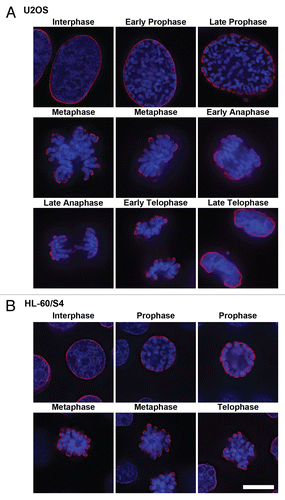
Figure 3 Co-immunostaining of U2OS interphase and metaphase cells with the epichromatin, mitotic marker and centromere (CREST) antibodies. The mitotic cell is on top of each part; the interphase cell is at the bottom. (A) mouse mAb PL2-6; (B) rabbit anti-H3 phosphorylated at serine 10, the mitotic marker H3(S10)p; (C) DAPI; (D) merge with an insert showing a 3-fold enlargement of the region denoted by an asterisk; (E) merged image of PL2-6, CREST and DAPI. Mouse mAb PL2-6 staining is shown in red, H3(S10)p and CREST in green, DAPI in blue. Each part is a single deconvolved optical slice of the same field. Bar equals 10 µm.
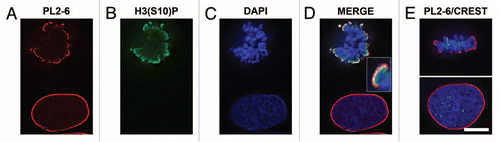
Figure 4 Dispersion of LBR, emerin and SUN2 into the mitotic ER and of lamin A (LMNA) into the cytoplasm of U2OS cells, concurrent with persistence of the epichromatin epitope at the periphery of mitotic chromosomes. Mouse mAb PL2-6 staining is shown in red. Anti-LBR (A), anti-emerin (B), anti-SUN2 (C) and anti-LMNA (D) staining are indicated in green; DAPI in blue. In each part, the upper row of images is from the same mitotic cell; the bottom row is from the same interphase cell. Bar equals 10 µm.
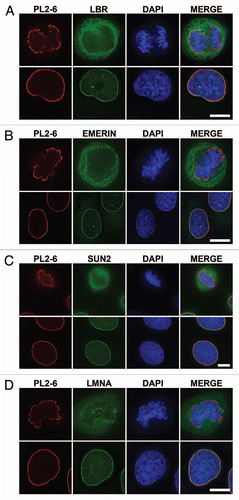
Figure 5 Nuclear and chromosomal regions that demonstrate an absence of epichromatin staining. (A) presents telophase U2OS cells with discernable chromosome “core” regions. The left column of images pairs anti-centrosome CREST (top row) or anti-LBR (second row) with DAPI. The middle column of images pairs PL2-6 with DAPI. The right column presents a differential interference contrast (DIC) image of the separating daughter cells in the same field. Arrows point to mitotic chromosome “cores”. (B) displays interphase U2OS nuclei with intranuclear tubules. The left image pairs anti-LBR with DAPI. The right image pairs PL2-6 with DAPI. Intranuclear tubules are clearly stained by anti-LBR, but not by PL2-6. Bar equals 10 µm.
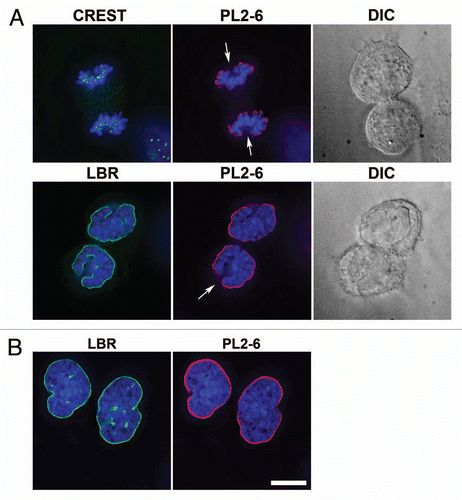
Figure 6 Immunostaining of the epichromatin epitope in tangential optical sections of nuclei from U2OS and HL-60/S4 cells. Mouse mAb PL2-6 staining is shown in red; DAPI in blue. (A) presents tangential sections of nuclei within intact cells. The top row of three images displays sections of U2OS cells; the second row is from HL-60/S4 cells. (B) shows central and tangential sections of isolated HL-60/S4 cell nuclei, washed in different buffers prior to fixation and immunostaining. In the top row, the isolated nucleus was washed in 1.5 mM MgCl2, 0.2 mM EGTA, 50 mM HEPES (pH 7.0); bottom row, washed in 0.2 mM EDTA, 0.2 mM EGTA, 50 mM HEPES (pH 7.0). Each image is a single deconvolved optical slice. In order to visualize the low amount of epichromatin immunofluorescence at the tangent of the NE, the brightness of the PL2-6 red signal was greatly increased. Bar equals 10 µm.
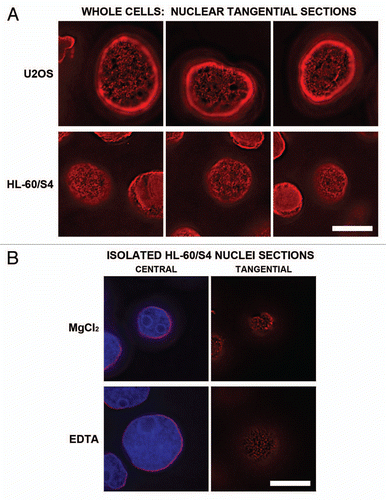
Figure 7 Immunoelectron microscopic labeling of the epichromatin epitope at the NE periphery and within ELCS of RA treated HL-60/S4 cells. (A and B) display two different cells which exhibit nuclear lobulation and extensive formation of ELCS. Enlarged regions taken from (A and B) are as follows: (C) taken from (A) (region “c”), presents two parallel ELCS; (D) taken from (A) (region “d”), displays a segment of the nuclear surface; (E) taken from (B) (region “e”), shows a single peripheral heterochromatin layer adjacent to a nucleolus. The NE and ELCS membranes can not be visualized because of the post-fixation detergent extraction and because the samples were not fixed with OsO4. Magnification bar values: (A and B) 1 µm; (C–E) 100 nm.
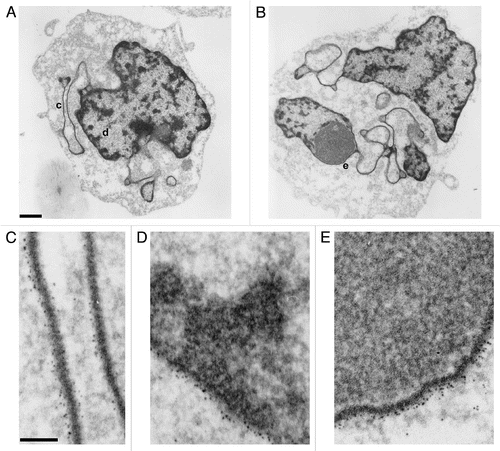
Figure 8 Immunostaining of the epichromatin epitope in Drosophila melanogaster and C. elegans cells. (A) Drosophila Kc cells immunostained with mAb PL2-6 (red), rabbit anti-H3 phosphorylated at serine10, the mitotic marker H3(S10)p (green) and DAPI (blue). (A) (right) is a 3-fold enlargement of the mitotic chromosomes in (A) (left). (B) (left) displays PL2-6 staining (red) of Drosophila ovary cells; DAPI (blue) of the same field is shown at (B) (right). (C): C. elegans worm: left, immunostaining with PL2-6; right, DIC image. Magnification bars equal 10 µm in (A and C); 5 µm, (B).
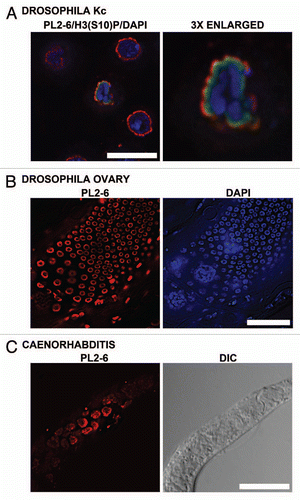
Figure 9 Immunostaining of the epichromatin epitope in tobacco and Arabidopsis thaliana cells. (A–D), confocal sections of mitotic stages seen in tobacco BY-2 cells immunostained with mAb PL2-6 (red): (A) interphase; (B) metaphase plate; (C) anaphase; (D) telophase. (E) confocal section of a whole mount of a Arabidopsis root tip stained with PL2-6 (red). (F) electron micrograph of a post-embedded immunogold stained thin section of a high pressure freezing/freeze substituted Arabidopsis root tip. The arrows point to the 5 nm gold near the NE. The astericks indicate the position of nuclear pores. CW, cell wall; C, cytoplasm; N, nucleus. Magnifications: (A–D), bar in (D) equals 10 µm; (E) bar equals 10 µm; (F) bar equals 200 nm.
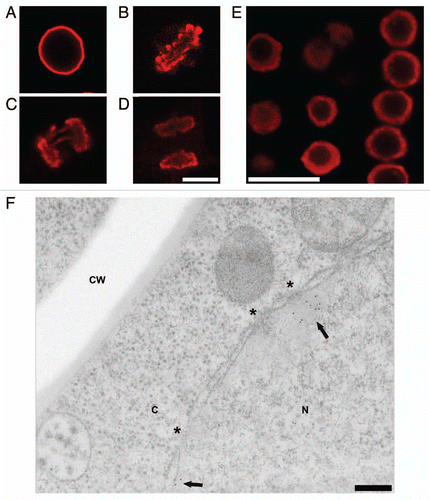
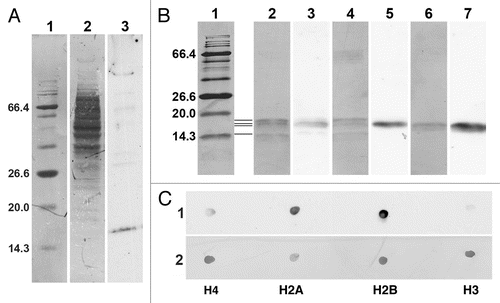
Figure 10 Immunoblot and immunodot analysis of the reactivity of PL2-6. (A) 4–20% gradient SDS-PAGE immunoblot analysis of U2OS total cell extract. Lanes: 1, BioLab protein molecular weight (mol wt) standards, stained with Coomassie Blue (CB), indicating the mol wt (kDa) of several proteins; 2, total cell extract stained with CB; 3, ECL reaction with PL2-6. (B) 17.5% SDS-PAGE with the following lanes: 1, protein mol wt markers stained with CB; 2 and 3, HeLa core mononucleosomes; 4 and 5, equimolar mixture of recombinant Xenopus inner histones H4, H2A, H2B and H3; 6 and 7, equimolar mixture of recombinant Xenopus inner histones H2A and H2B. All lanes are from the same gel. Lanes 1, 2, 4 and 6, CB stained. Lanes 3, 5 and 7, ECL exposures carefully aligned to lanes 2, 4 and 6, respectively. Mol wt values (kDa) of the markers are indicated to the left of lane 1. The four thin horizontal lines between lanes 1 and 2 denote the positions of the four inner histones, starting with the lowest band (H4) and progressing upward, H4, H2A, H2B and H3. (C) Immunodot blots of equimolar aliquots of purified individual recombinant Xenopus inner histones (H4, H2A, H2B and H3). Strip 1, ECL reaction with PL2-6. Strip 2, identical membrane strip after CB staining.