Abstract
In the developing heart, time-lapse imaging is particularly challenging. Changes in heart morphology due to tissue growth or long-term reorganization are difficult to follow because they are much subtler than the rapid shape changes induced by the heartbeat. Therefore, imaging heart development usually requires slowing or stopping the heart. This, however, leads to information loss about the unperturbed heart shape and the dynamics of heart function. To overcome this limitation, we have developed a non-invasive heart imaging technique to jointly document heart function (at fixed stages of development) as well as its morphogenesis (at any fixed phase in the heartbeat) that does not require stopping or slowing the heart. We review the challenges for imaging heart development and our methodology, which is based on computationally combining and analyzing multiple high-speed image sequences acquired throughout the course of development. We present results obtained in the developing zebrafish heart. Image analysis of the acquired data yielded blood flow velocity maps and made it possible to follow the relative movement of individual cells over several hours.
Introduction
In vivo time-lapse imaging of the processes that underlie organ morphogenesis—cell division, migration and differentiation, or the formation of gene expression patterns—is central to reaching a better understanding of organ development in embryos. The tools and techniques for imaging organogenesis in live animals have undergone tremendous developments. For example, numerous vital fluorescent dyes and probes as well as stable transgenic animals expressing bright fluorescent proteins are available. Optical imaging techniques (including wide-field, confocal and multi-photon microscopy), which permit three-dimensional imaging, can routinely be used to image live samples within a controlled environment. Finally, the increase in computing speed and storage capacity allows processing and analyzing large images and quantifying biological events such as cell motion and division or tissue reorganization. As a result, uninterrupted, long-term time-lapse imaging of entire organs over multiple hours or even days can be envisioned.Citation1
Since the heart is beating from early stages onward, live time-lapse imaging of heart development is particularly challenging. The onset of heartbeat occurs as early as 21 days post fertilization in humans and, in animal models, at E8.5 days in the mouse,Citation2 E9 in the rat,Citation3 stage 33/34 in Xenopus laevis,Citation4 9–10 somites (about 2 days) in chicken,Citation5 and about 1 day post fertilization in the embryonic zebrafish heart. Acquiring a time-lapse movie by snapping a picture at set intervals, which would allow imaging the development of most organs, results in severe image artifacts when imaging the beating and developing heart. The heart either appears blurred or is caught in an arbitrary (and likely different) state of cardiac contraction at each developmental stage.
Possible workarounds include imaging the heart in fixed samples,Citation6 assembling image series from multiple individuals fixed at increasing developmental stages, or imaging the heart after it has been temporarily slowed by lowering the ambient temperature or addition of a pharmacological agent such as tricaine.Citation7 However, such approaches imply that information about heart function and its unperturbed shape are lost. This is particularly problematic for at least three types of studies. First, studying the influence of dynamics on the formation of the heart from fixed or slowed-down samples is clearly not possible. Since fluid forces are required for normal heart formation or, conversely, disruption of normal flow patterns leads to severe and irreversible dysmorphologies in the adult heart,Citation8 investigating the pathways involved can only be done by preserving a dynamic setting for the heart to develop. Even temporarily slowing the heart can affect its normal development.Citation9 Second, static images do not allow characterizing animals with disrupted, heart-related genes until a clear phenotype is apparent. However, even in the absence of visible alterations in phenotype, such animals may already exhibit dramatic alterations in heart function, which could readily be characterized via dynamic imaging at multiple stages of heart development. Third, mapping the fate of individual cardiac cells is only possible by examining live samples. Variability at the cellular level does not allow recovering this information from images of multiple individuals fixed at various stages of development.
To overcome the above shortcomings, we devised an imaging and analysis procedure that yields a dynamic depiction of heart development and that includes, at each studied developmental stage, the shape of the heart in any of its contraction states ( and ). Our method combines automated high-speed fluorescence and brightfield microscopy with high-dimensional image sequence synchronization to reveal the dynamics of cardiac morphogenesis with cellular resolution and without perturbing or perturbation from the cardiac beat. The resulting images are highly suitable for automatic image analysis, specifically, to extract quantitative velocity fields and track cell motions both as the heart beats and over the course of its development.
Materials and Methods: Imaging Structure and Function
Sample preparation.
We used zebrafish as our model system to study heart morphogenesis. Zebrafish is well suited to image cardiac development, specifically due to its optical accessibility, availability of multiple fluorescent transgenics and mutants, and rapid, exutero development.Citation10 Wild-type and transgenic Tg(cmlc2:eGFP) and Tg(flk1:eGFP) zebrafish (Danio rerio) eggs were spawned using standard techniques.Citation11 The transgenic Tg(cmlc2:eGFP) and Tg(flk1:eGFP) zebrafish express green fluorescent protein in the cardiac myocytesCitation12 and endothelial cells,Citation13 respectively. For microscopic observation, we used glass-bottom Petri dishes. We molded an agarose plate with several trenches to hold the fish on the glass bottom using a 1.5% agarose solution. We soaked the embryos in a 0.016% tricaine solution for 15 minutes. This concentration ensured that embryo movements did not affect the imaging and that the heart rate was only minimally perturbed. We transferred the embryos into the trenches of the agar plate in a 1% low melting point agarose-0.016% tricaine solution in artificial pond water and finally adjusted the embryo orientation.
Imaging.
We acquired image sequences on a Leica DMI6000B inverted widefield microscope with a Leica HCX Plan S-APO 20x/0.50 dry microscope objective (Leica Microsystems, Wetzlar, Germany). High-speed microscopy was carried out using a Photron FASTCAM SA3, at framerates of 1,000 frames per second (fps) and 3,000 fps for pixel resolutions of 1024 × 1024 pixels and 512 × 512 pixels, respectively.
We performed fluorescence time-lapse imaging of transgenic Tg(cmlc2:eGFP) zebrafish to characterize embryonic heart development. We used a Hamamatsu ImageEM C9100-13 electron multiplier charge-coupled device (EM-CCD) camera (Hamamatsu, Japan). The incubator temperature was maintained at 28°C during the imaging experiment. The imaging procedure was fully automated by customized Leica Software (Leica Microsystems, Wetzlar, Germany), as well as µManager,Citation14 C++ and Matlab (The Mathworks, Inc., Natick, MA) programs to control microscope components and the camera.
For time-lapse microscopy, we considered two time scales (): tslow, the slow (developmental) time scale and tfast, the fast (functional) time scale. Images were acquired at high speed (that is, in the fast time domain, 90 frames acquired at 30 fps, with each frame 512 × 512 pixels) at a fixed axial (z) position. This operation was repeated multiple times after moving the focus drive by a Δz = 5 µm step in between acquisitions. This resulted in a set of temporal image series, each corresponding to a different focus position but to the same time-point along the developmental time scale. Imaging was repeated every 2 minutes for 100 time-points on the slow time axis. This imaging experiment yielded five dimensional image data sets, indexed by (x, y, z, tfast, tslow). The total data size was 23.4 GB.
Sequence synchronization.
Each fast time series acquisition, at any given z position and developmental time, was triggered at an arbitrary time in the cardiac cycle. Hence, the sequences were not temporally synchronized among each other. We assumed that each fast image sequence contained at least one heartbeat, and that long-term morphological changes, such as tissue growth and rearrangement between two time-points on the slow developmental axis, were small compared to the high-speed motion of the heart during its contraction. This assumption, along with the fact that the heartbeat is cyclical, allowed us to temporally align (synchronize) each of the image series such that for each developmental time-point (typically separated by a few minutes) and for each axial position all events in the heartbeat cycle could be made to coincide. To this end, we used an image synchronization procedure developed initially for recursively synchronizing slice sequences in time at different z sectionsCitation15,Citation16 ( and C) that we extended to synchronize neighboring sequences along the developmental time axis.Citation17 The reconstruction took 16 hours on a computer equipped with a 2.8 GHz Intel Core 2 Duo processor with 4 GB of RAM. The aligned image sequences have three spatial dimensions and two temporal dimensions. Next, we selected a contraction state (along the fast time axis), and extracted the volume corresponding to this phase in the cardiac cycle at each imaged developmental stage. This operation is straightforward since all sequences are synchronized and the nth volume in any series along the fast time axis corresponds to a single contraction state. This effectively resulted in a time-lapse of heart development without the artifacts that usually appear when attempting traditional time-lapse imaging of the heart. Finally, we compensated for global spatial translation and rotation of the 3D volumes along the slow time axis at individual time-points by use of a spatial registration procedureCitation18 applied recursively to pairs of successive volumes.Citation19 For display purposes, we selected one z section along the slow and fast time axes, and generated movies displaying either heart function at a fixed developmental stage or heart development at a fixed position in the cardiac cycle.
Blood flow velocity estimation and cell tracking.
Flow analysis was carried out using a block matching method inspired from digital particle image velocimetry (DPIV).Citation20 From the flow motion video, we estimated local displacement vectors from frame to frame. We divided each frame into small interrogation windows, and calculated the best matching position for each window in the following frame. Specifically, for a given frame and pixel of interest, a 32 × 32 pixel interrogating window was extracted, and it was moved over a 64 × 64 pixel neighborhood at the same location in the subsequent frame. The position with the best match yielded a displacement vector and, upon multiplication with the framerate, the local velocity. The trajectories of individual cells were tracked using the Imaris software suite (Bitplane, Inc., Saint Paul, MN). The software was either presented with a time series of images along the fast (functional) or the slow (developmental) time axis. In both cases, tracking was carried out similarly. First, the centroids of all cells in each frame were determined (via local maximum detection of the voxel intensities). Next, cells detected at neighboring time-points were connected based on their spatial proximity and the persistence of their trajectory. Since the time interval between frames was sufficiently small (2 minutes and 33 ms for the series along the slow and fast time axes, respectively), cell motion between frames remained small so that tracking could be carried out automatically even though the cells were all labeled with a single color.Citation19
Results
Imaging the heart is prone to motion artifacts.
In order to illustrate the dependence of lateral resolution on framerate and camera sensitivity (in addition to usual high numerical aperture requirements), we acquired frames of the beating heart at multiple framerates ( and Movie 1). Although lowering the framerate appears to result in brighter and less grainy images, motion blur severely degrades lateral resolution, far beyond the limits set by optics alone.Citation19 As higher framerates are used, the signal to noise is reduced due to the limited photon count in the shortened integration time. Blurring artifacts are largely reduced.
Sample motion is limiting the resolution.
The achievable lateral resolution (the smallest distance measured on the sample between two points whose images can be resolved) when imaging a dynamic structure is the sum of the microscope resolution for a fixed sample and the product of the sample velocity with the integration time. For example, a well-adjusted microscope may have a lateral resolution as low as a few hundred nanometers, yet this quantity is negligible when it is compared to the product of a velocity of 100 µm/s with an integration time of 0.5 seconds, that is a blur of length 50 µm. An integration time that is at least 50 times lower (which typically translates to a framerate 50 times faster) brings the contribution of motion blur in a range that is comparable to that of the diffraction-limited resolution.Citation19 In the heart, motions can be of unexpectedly high amplitude. In order to quantify these velocities, we imaged the zebrafish heart using a high-speed camera ( and Movie 2). Using our velocity estimation algorithm, we found that, in between two frames taken at 3,000 frames per second, blood cells can undergo distances that exceed several microns, that is, their velocity is about 17 mm/s. Heart wall motion was as high as 1.9 mm/s.
Traditional time-lapse methods fail when imaging the beating and developing heart.
The high velocity of cardiac tissues during the heartbeat makes it difficult to image the natural shape of the heart (in a fixed state of contraction), its function, or its development. Imaging the heart using a classical time-lapse technique, by acquiring a single snapshot of the heart (with a short integration time to avoid blurring) every two minutes over several hours, results in a jittering movie (Movie 3). The heart is in an arbitrary state of contraction when an individual frame is taken. The large variations in heart shape due to heart contraction make it difficult to follow the relative positions of individual cells and to evaluate whether changes in morphology over the course of the time-lapse are due to heart contraction, long-term structural changes (growth or tissue reorganization), or a combination of both.
Dynamic imaging and reconstruction allow capturing functional and long-term morphological changes.
By imaging the heart at high speed along multiple time scales and post-processing the high-speed sequences (see Methods), we obtained images of the heart that can be assembled along either the fast (functional) time scale (images along the vertical direction in , Movies 4 and 5, at 70 hpf and 73 hpf, respectively) or the slow (developmental) time scale ( and along the horizontal direction, and Movie 6). The movies along the fast time scale (Movies 4 and 5) start at the same moment in the cardiac cycle and beat in phase as a result of the post-processing synchronization procedure. If, at every developmental stage, the nth frame is extracted from the corresponding movie of the beating heart and all these frames are assembled such as to form a new movie, this time along the slow time scale, the resulting time-lapse shows the heart seemingly unaffected by the heart beat and reveals morphology changes as the heart develops. Although the heartbeat appears to be stopped it is only as a consequence of a computational (not a physical or chemical) intervention. The time-lapse movie of development (Movie 6) is nearly free of the jittering artifacts that corrupt the time-lapse when acquiring snapshots of the heart in arbitrary positions at each developmental stage (Movie 3).
Cell tracking reveals changes in heart contraction and shape.
We tracked individual cells in time series of the beating heart at 70 hpf ( and Movie 4) and 73 hpf ( and Movie 5). Shape changes in the looping trajectories reveal changes in the heartbeat, that is, heart function. We tracked individual cells on the computationally stopped heart, revealing that both chambers expand at different rates (Movie 6). The atrium size exhibits a slower size increase than the ventricle. This change can reflect changes in growth rate, in the timing of the atrio-ventricular contraction sequence, or in a combination of both.
Computationally stopped heart time-lapse reveals events with single-cell resolution.
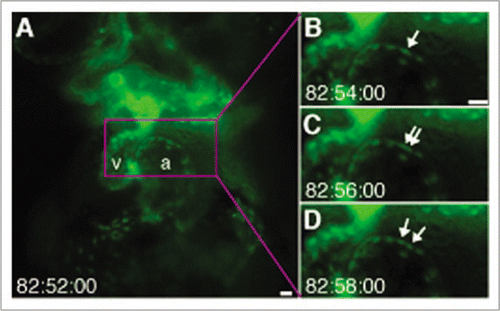
Using traditional time-lapse imaging, where snapshots of the heart are captured in arbitrarily contraction states, it is difficult to follow the fate of individual cells since their position relative to their neighbors is highly dynamic as the heart beats. Our computationally stopped heart time-lapse technique, allows observing, for the first time, the dynamics of an endocardial cell division without perturbing or perturbation from the cardiac beat ( and Movie 7).
Discussion
Studies of heart development have largely leveraged fixed sample imaging to infer cell shapeCitation6,Citation7,Citation21 and morphological differences between wild-type and mutant zebrafish.Citation22 It has been a common practice to slow or even stop the heart artificially through cooling the medium or drug treatment to reduce motion artifacts induced by the heart as it beats while imaging.Citation7 Heart function is frequently described qualitatively via visual inspection. Although such approaches are sufficient to describe severe cardiac dysmorphologies at advanced stages of development, early detection and characterization of more subtle phenotypes or changes in cardiac function require more sophisticated approaches. Several quantitative attempts to characterize heartbeat dynamics and morphology during development have been carried out. These include studies of molecules and drugs that influence heart rate,Citation23,Citation24 arrhythmia characterization in mutants,Citation25 flow pattern determination,Citation8 and heart wall dynamics characterization,Citation26 as well as studies of the blood flow and heart morphology at fixed intervals during cardiac development.Citation9,Citation16,Citation27 Our results show, for the first time, that morphogenesis and function can be investigated simultaneously, with cellular resolution, high temporal resolution, and without slowing or stopping the heart beat. Our approach enables both the prospect to consolidate and to extend the area of studies that focused only on either of the two aspects.
A limitation of our technique is that it involves long exposures to high intensity illumination for the purpose of fluorescence imaging. Also, the data sets collected with the joint imaging procedure are a factor 100 to 1,000 larger than traditional time-lapses (since, typically 100 to 1,000 high-speed frames are acquired for every developmental time-point). Extending this technique by allowing for real-time processing and by restricting fluorescence illumination to the frames of interest would limit both the final amount of data to be stored and the light-exposure.
In conclusion, we have presented an approach to image the developing and beating heart that is minimally invasive, that does not require stopping or slowing the heart, and that allows for quantitative characterization of heart morphology and function. We foresee that this technique will open the possibility to image individual cells as they grow, differentiate, divide and rearrange on the heart surface in vivo and as they experience shear forces due to blood flow. At the tissue level, it will allow cell fate mapping without the need for stopping the heart. Screening of animals with mutated or otherwise altered gene expression,Citation22 which contribute to our understanding of congenital heart diseases,Citation28 will be possible based on quantitative and functional indicators measured on the beating heart at stages where a clear phenotype may not yet be apparent.
Figures and Tables
Figure 1 Multiple-timescale imaging of heart development aims at providing data to study interactions between function and morphology. Morphogenesis (growth, reorganization, etc.,) can be followed along the developmental time scale (at a fixed time during the heartbeat) and heart function (at any fixed developmental stage) along the functional time scale. Arrows indicate blood flow and gray discs red blood cells.
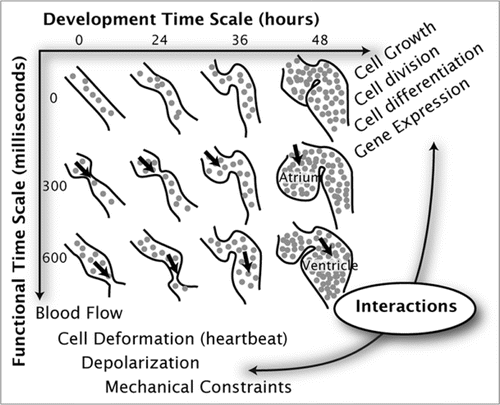
Figure 2 Data acquisition and reconstruction procedure for joint cardiac morphology and function imaging. (A) Time-lapse imaging experiment procedure. (B) Four dimensional image data with dimensions along x, y, z, tfast at each time-point before synchronization, (C) Four dimensional image data (x, y, z, t^fast) after temporal and spatial synchronization, (D) Reconstructed developmental time sequence extending along x, y and tslow.
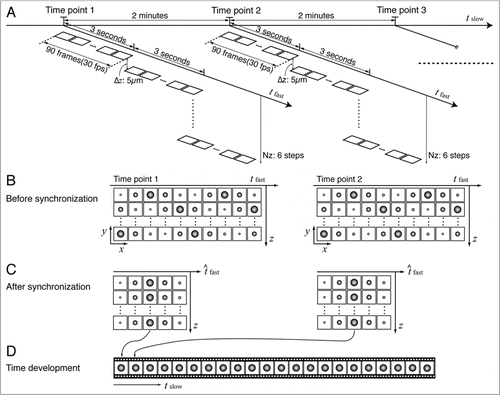
Figure 3 Imaging fast moving objects requires high brightness and signal to noise ratio, while maintaining high frame-rate to minimize the effects of motion blur. (A) Left ventrolateral view of a 7 dpf transgenic Tg(cmlc2:eGFP) larval zebrafish in brightfield microscopy shows direct optical access to the heart. (B) Higher magnification view of the heart where the atrium (a) and ventricle (v) have been outlined. (C) Comparing fluorescence images of the beating embryonic heart acquired at 2, 10, 30 and 60 frames per second (that is 500 ms, 100 ms, 30 ms and 15 ms integration time, respectively) reveals the need for high framerates to capture morphology despite the imaged structures high velocity. The atrium (a) and ventricle (v) are marked in the brightfield image. Movie 1 contains high temporal-resolution data corresponding to this figure. Scale bars are 80 µm.
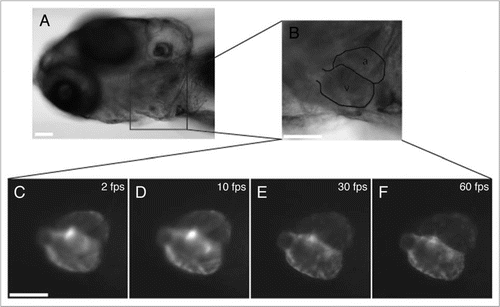
Figure 4 Brightfield high-speed imaging and flow analysis allow imaging at high framerates, and resolve motion of individual blood cells in the cardiac tract for subsequent flow velocity estimation. (A) Brightfield image of the beating embryonic heart of a wild type 83 hpf zebrafish at 3,000 frames per second. (B) Qualitative motion representation by superposition of 5 successive frames, each with a hue corresponding to its relative time stamp. (C) Local motion estimation of red blood cells and heart wall motion reveals velocities as high as 17 mm/s. The corresponding high temporal-resolution data are provided in Movie 2. scale bar is 20 µm.
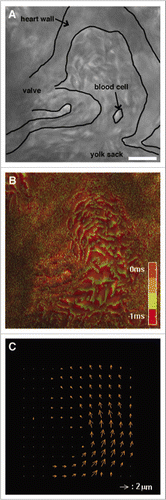
Figure 5 Imaging at multiple time-scales permits separate or combined study of changes in cardiac function or morphology as the heart develops. (A and B) Ventral view of a 72 hpf transgenic Tg(cmlc2:eGFP) zebrafish in brightfield microscopy at (A) low magnification and (B) high magnification. a: atrium, v: ventricle. (C) The myocardial cells express green fluorescent protein. (D–O) Fluorescence images of the beating and developing heart. Acquiring a single frame at every developmental stage of interest but at an arbitrary time in the cardiac cycle provides an image sequence where changes in morphology can either be due to cardiac function or morphogenesis (which is equivalent to looking at a time-lapse made by successively picking an arbitrary image from each column in the D–O matrix). This is further illustrated in Movie 3. For a fixed developmental stage (along the horizontal axis) the heartbeat can be followed along the vertical axis. Conversely, for a fixed moment in the cardiac cycle, morphogenesis can be followed along the horizontal axis. High temporal-resolution movies corresponding to series along axes (D–F) (Movie 4), (M–O) (Movie 5) and (D, G, J and M) (Movie 6) are available as supplements. Scale bars are 80 µm.
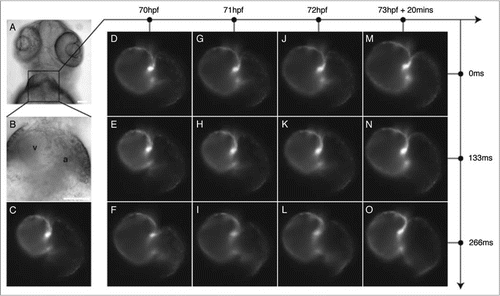
Figure 6 Multi time-scale imaging allows separate analysis of cell motion as a result of cardiac function or morphogenesis. Tracked cardiomyocytes of data presented in over the course of one cardiac heartbeat cycle at (A) 70 hpf and (B) 73 hpf. (C) Computationally heartbeat stopped heart development between 70 and 73 hpf. Although cell motion can be due to a combination of long-term changes in heart morphology (such as growth) they can also reveal changes in the timing at which the atrium and ventricle motion are synchronized. Availability of the complete set of cardiac function images at each developmental stage allows to specifically synchronize on one particular hear feature (such as the atrium or the ventricle). High temporal-resolution movies corresponding to (A) (Movie 4), (B) (Movie 5) and (C) (Movie 6) are available as supplements. Scale bar is 80 µm.
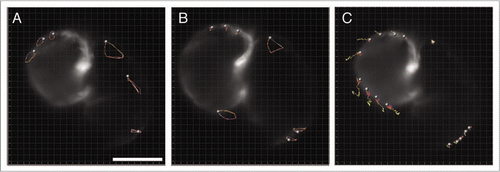
Figure 7 Time-lapse with computationally fixed heart reveals cell division. (A) Ventral view of a transgenic Tg(flk1:eGFP) zebrafish obtained via fluorescence microscopy. a: atrium, v: ventricle. Arrows indicate endocardial cell (B) shortly before (C) during and (D) after division. See also Movie 7. Scale bars are 20 µm.
Acknowledgements
We thank Luca Caneparo and Leigh Ann Fletcher, Caltech, for help with zebrafish handling and Julien Vermot and Scott Fraser, Caltech, for comments and suggestions about this work.
References
- Megason SG, Fraser SE. Digitizing life at the level of the cell: high-performance laser-scanning microscopy and image analysis for in toto imaging of development. Mech Dev 2003; 120:1407 - 1420
- Chen F, Klitzner TS, Weiss JN. Autonomic regulation of calcium cycling in developing embryonic mouse hearts. Cell Calcium 2006; 39:375 - 385
- Escobar AL, Ribeiro-Costa R, Villalba-Galea C, Zoghbi ME, Pérez CG, Mejía-Alvarez R. Developmental changes of intracellular Ca2+ transients in beating rat hearts. Am J Physiol Heart Circ Physiol 2004; 286:971 - 978
- Ny A, Koch M, Schneider M, Neven E, Tong RT, Maity S, et al. A genetic Xenopus laevis tadpole model to study lymphangiogenesis. Nat Med 2005; 11:998 - 1004
- Auerbach D, Rothen-Ruthishauser B, Bantle S, Leu M, Ehler E, Helfman D, Perriard JC. Molecular mechanisms of myofibril assembly in heart. Cell Struct Funct 1997; 22:139 - 146
- Butcher JT, Sedmera D, Guldberg RE, Markwald RR. Quantitative volumetric analysis of cardiac morphogenesis assessed through micro-computed tomography. Dev Dyn 2007; 236:802 - 809
- Auman HJ, Coleman H, Riley HE, Olale F, Tsai HJ, Yelon D. Functional modulation of cardiac form through regionally confined cell shape changes. PLoS Biol 2007; 5:605 - 615
- Hove JR, Köster RW, Forouhar AS, Acevedo-Bolton G, Fraser SE, Gharib M. Intracardiac fluid forces are an essential epigenetic factor for embryonic cardiogenesis. Nature 2003; 421:172 - 177
- Vermot J, Forouhar AS, Liebling M, Wu D, Plummer D, Gharib M, Fraser SE. Oscillatory blood flow acts through Klf2a to regulate heart valve formation. PLOS Biology 2009; in press
- Schoenebeck JJ, Yelon D. Illuminating cardiac development: Advances in imaging add new dimensions to the utility of zebrafish genetics. Semin Cell Dev Biol 2007; 18:27 - 35
- Westerfield M. The Zebrafish Book 1995; Eugene University of Oregon Press
- Huang CJ, Tu CT, Hsiao CD, Hsieh FJ, Tsai HJ. Germ-line transmission of a myocardium-specific GFP transgene reveals critical regulatory elements in the cardiac myosin light chain 2 promoter of zebrafish. Dev Dyn 2003; 228:30 - 40
- Beis D, Bartman T, Jin SW, Scott IC, D'Amico LA, Ober EA, et al. Genetic and cellular analyses of zebrafish atrioventricular cushion and valve development. Development 2005; 132:4193 - 4204
- Stuurman N, Amodaj N, Vale R. Micro-Manager: Open Source software for light microscope imaging. Microscopy Today 2007; 15:42 - 43
- Liebling M, Forouhar AS, Gharib M, Fraser SE, Dickinson ME. Four-dimensional cardiac imaging in living embryos via postacquisition synchronization of nongated slice sequences. J Biomed Opt 2005; 10:054001
- Liebling M, Forouhar AS, Wolleschensky R, Zimmerman B, Ankerhold R, Fraser SE, et al. Rapid three-dimensional imaging and analysis of the beating embryonic heart reveals functional changes during development. Dev Dynam 2006; 235:2940 - 2948
- Liebling M, Vermot J, Fraser SE. Double time-scale image reconstruction of the beating and developing 5th embryonic heart. Proceedings of the IEEE International Symposium on Biomedical Imaging: From nano to macro (ISBI'08) Paris, France 855 - 858
- Thévenaz P, Ruttimann UE, Unser M. A pyramid approach to subpixel registration based on intensity. IEEE Transactions on Image Processing 1998; 7:27 - 41
- Vermot J, Fraser SE, Liebling M. Fast fluorescence microscopy for imaging the dynamics of embryonic development. HFSP Journal 2008; 2:143 - 155
- Willert CE, Gharib M. Digital particle image velocimetry. Experiments in Fluids 1991; 10:181 - 193
- Thisse C, Zon LI. Organogenesis-heart and blood formation from the zebrafish point of view. Science 2002; 295:457 - 462
- Stainier DY, Fouquet B, Chen JN, Warren KS, Weinstein BM, Meiler SE, et al. Mutations affecting the formation and function of the cardiovascular system in the zebrafish embryo. Development 1996; 123:285 - 292
- Burns CG, Milan DJ, Grande EJ, Rottbauer W, MacRae CA, Fishman MC. High-throughput assay for small molecules that modulate zebrafish embryonic heart rate. Nat Chem Biol 2005; 1:263 - 264
- Denvir MA, Tucker CS, Mullins JJ. Systolic and diastolic ventricular function in zebrafish embryos: influence of norepenephrine, MS-222 and temperature. BMC Biotechnol 2008; 8:21
- Fink M, Callol-Massot C, Chu A, Ruiz-Lozano P, Belmonte JC, Giles W, et al. A new method for detection and quantification of heartbeat parameters in Drosophila, zebrafish and embryonic mouse hearts. BioTechniques 2009; 46:101 - 113
- Lu J, Pereira F, Fraser SE, Gharib M. Three-dimensional real-time imaging of cardiac cell motions in living embryos. J Biomed Opt 2008; 13:014006
- Scherz PJ, Huisken J, Sahai-Hernandez P, Stainier DYR. High-speed imaging of developing heart valves reveals interplay of morphogenesis and function. Development 2008; 135:1179 - 1187
- Bruneau BG. The developmental genetics of congenital heart disease. Nature 2008; 451:943 - 948