Acknowledgment
We thank Susan Lindquist for providing the 22L and RML prion strains, Claudio Hetz for providing 139A prions and Henry Lester for helpful advice. This work was funded by the Broad Fellows in Brain Circuitry Program at Caltech.
Figures and Tables
Figure 1 Lifespan and homeostatic behaviors of prion-inoculated mice. (A) RML-, 139A- and 22L-inoculated mice have a narrow mortality window between 175–200 days post inoculation. NBH vehicle control mice are euthanized at times indicated with a tick mark. (B) The fraction of total time spent in a resting state (nearly complete immobility for >30 seconds). (C) The number of events of awakening, which is the termination of a resting state. (D) Fraction of total time spent entering the food bin. (E) The fraction of total time spent drinking. All statistical comparisons were done using the Kruskal-Wallis test with post-test (*p < 0.05; **p < 0.01; ***p < 0.001).
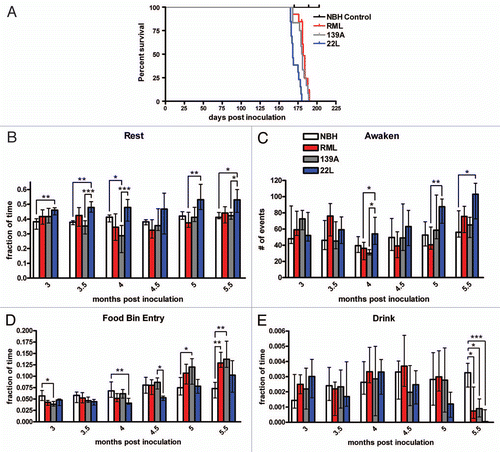
Figure 2 Major activity behaviors of prion-inoculated mice. (A) Total distance traveled in the 24 hour video recording. (B) The fraction of total time spent jumping. (C) The fraction of total time spent hang cuddling, or upside down. (D) The fraction of total time spent hanging vertically. (E) The fraction of total time spent grooming. (F) The fraction of time spent rearing. All statistical comparisons were done using the Kruskal-Wallis test with post-test (*p < 0.05; **p < 0.01; ***p < 0.001).
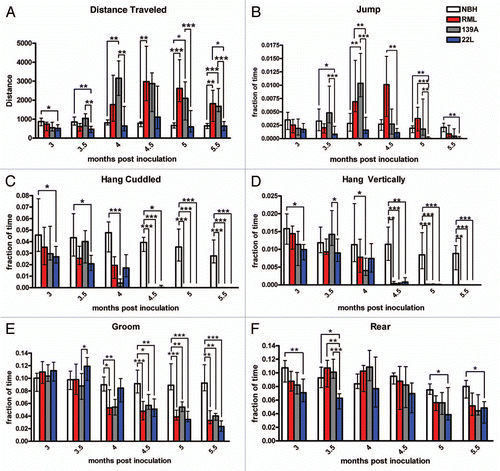
Figure 3 (A) Stacked activity plot showing the median number of seconds per hour the mice in each experimental group exhibit selected activities at 3 mpi (left part) and 5 mpi (right part). The behaviors shown include groom, rear, walk, sniff, hang cuddled, hang vertical, food bin entry, pause, turn, jump, drink and stretch each denoted by a different color (see key). Behaviors identified by HomeCageScan but not included as an activity were awaken, chew, rest, twitch and remain low. The black bar indicates the dark cycle. (B) Intensity plot showing how the median distance traveled within a 24 h period varies over the duration of the experiment (from 3–5.5 mpi; each time point represents, n = 11–13 mice). Blue and green coloration indicates distances of 150 meters traveled or less and yellows, oranges and red indicate distance of 200 meters or higher traveled. The black bar indicates the dark cycle.
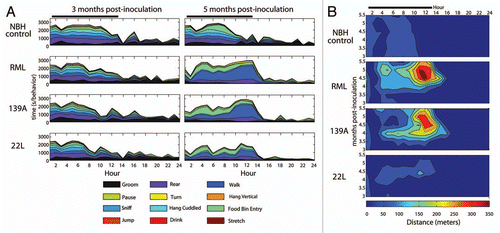
Figure 4 Degeneration and gliosis in the dorsal striatum. (A) Ag-Cu degeneration stained representative image (low magnification) of the dorsal striatum and at (B) higher magnification and (C) an image of the Nikon Elements software automated quantitation. (D) Mean percentage area stained. (E) Representative images of IBA1 stained dorsal striatum (F) and the software intensity measurement. Representative higher magnification images of IBA positive microglia in (G) NBH controls, note the paucity of cell bodies and the smaller size of processes than what is seen in representative (H) prion-inoculated mice which have more IBA1 signal and larger cell size. (I) Mean manual cell counts and (J) % area stained measures of IBA1 positive microglia in the dorsal striatum. (K) Unbiased stereology of IBA1 positive microglia in the dorsal striatum. Representative images of GFAP-stained dorsal striatum at (L) and the (M) automated software measurement of staining. (N) Mean manual cell counts and (O) intensity measures of GFAP positive astrocytes in the dorsal striatum. All statistical comparisons were done using the Kruskal-Wallis test with post-test (*p < 0.05; **p < 0.01; ***p < 0.001).
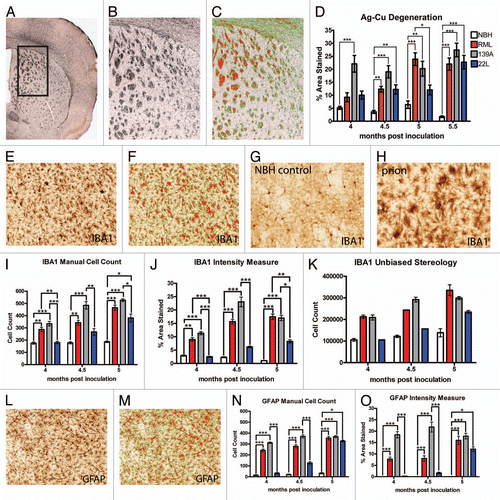
Figure 5 Dopaminergic neurotransmitter system innervations of the dorsal striatum and cell counts. (A) Representative low magnification image of the substantia nigra, stained for tyrosine hydroxylase (TH) and (B) at higher magnification used to count cells. (C) TH positive cell counts in the substantia nigra were not significantly changed. (D) Representative images of the dorsal striatum, stained for TH and at higher magnification (E) used to quantify innervation, a representative intensity measurement is shown in (F). (G) Dopaminergic innervations in the dorsal striatum are significantly decreased in RML and 139A inoculated mice. All statistical comparisons were done using the Kruskal-Wallis test with post-test (*p < 0.05; **p < 0.01; ***p < 0.001).
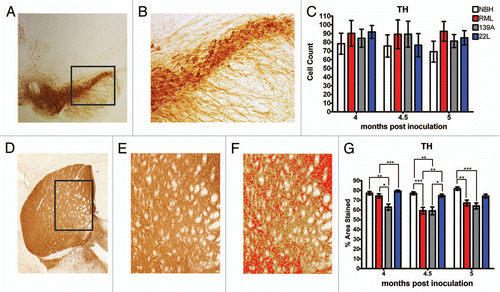
Figure 6 Serotonin system in prion-infected mice. (A) Representative images of the dorsal raphe nucleus (DRN), stained for serotonin (5HT). (B) Higher magnification of the DRN used to count cells. (C) 5HT-positive cell counts in the DRN. (D) Representative low magnification image of the dorsal striatum, stained for 5HT and (E) at higher magnification (10x) used to quantify 5HT neuronal processes as shown in (F). (G) Serotonergic innervations to the dorsal striatum. (H–J) Representative images of the substantia nigra, stained for serotonin. (K) Serotonergic innervations to the substantia nigra.All statistical comparisons were done using the Kruskal-Wallis test with post-test (*p < 0.05; **p < 0.01).
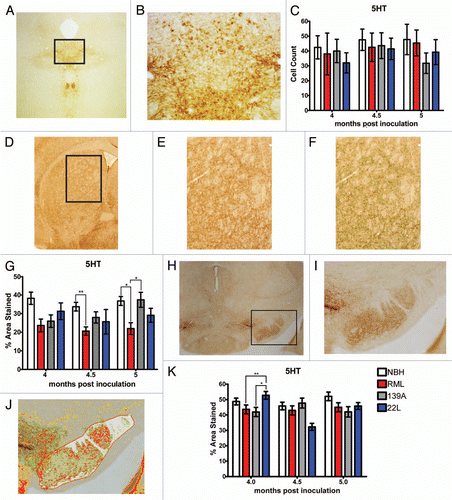
Figure 7 Quantification of parvalbumin-positive GABAergic neurons. (A) Representative image of parvalbumin staining in the dorsal striatum and (B) at magnification used to count cells. (C) Parvalbumin cell counts in the dorsal striatum. (D) Representative images of the parvalbumin staining in substantia nigra. (E) Representative image of parvalbumin staining used to count cells. (F) Parvalbumin cell counts in the substantia nigra. All statistical comparisons were done using the Kruskal-Wallis test with post-test (*p < 0.05; **p < 0.01; ***p < 0.001).
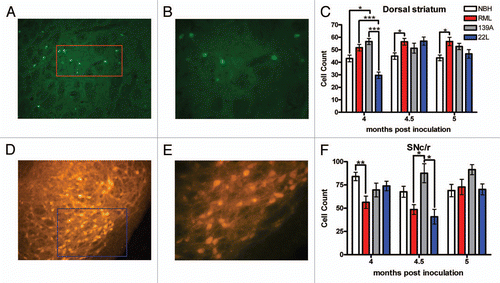
Figure 8 Quantification of the ChAT-positive cholinergic system. (A) Representative image of ChAT staining in striatum. (B) Higher magnification of ChAT staining used to count ChAT-positive giant cholinergic neurons. (C) ChAT-positive giant cholinergic neuron counts. (D) Representative image of the dorsal striatum used to quantify the ChAT-positive fibers. (E) Higher magnification used to quantify fibers using the automated software measurement shown in (F) which excludes the giant cholinergic cell bodies. (G) Cholinergic innervations in the dorsal striatum by the giant cholinergic neurons. (H) Representative images of the PPTg and (I) at higher magnification used to count cells. (J) ChAT-positive neuron count in the PPTg is not altered. (K) Representative images of the LDTg and (L) at higher power used to count cells. (M) ChAT-positive neuron count in the LDTg is not altered. All statistical comparisons were done using the Kruskal-Wallis test with post-test (*p < 0.05).
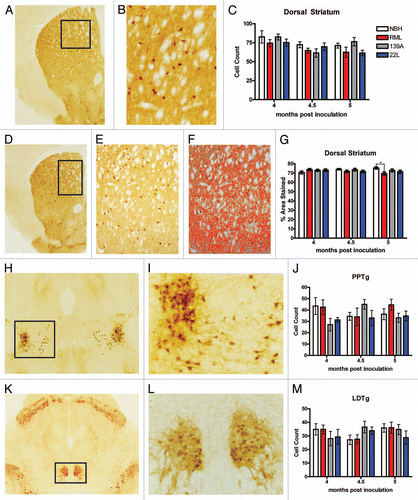
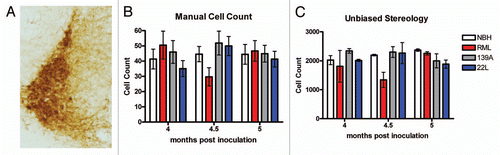
Figure 9 Quantification of TH-positive noradrenergic neurons in the locus coeruleus. (A) Representative image of TH staining in the locus coeruleus. (B) Manual cell counts and (C) unbiased stereology in the locus coeruleus (Kruskal-Wallis test with post-test) (*p < 0.05; **p < 0.01; ***p < 0.001).