
Abstract
Atypical forms of bovine spongiform encephalopathy (BSE) may be caused by different prions from classical BSE (C-BSE). In this study, we examined the susceptibility of mice overexpressing mouse and hamster chimeric prion protein (PrP) to L-type atypical BSE (L-BSE). None of the transgenic mice showed susceptibility to L-BSE, except mice overexpressing hamster PrP. We also examined the transmission properties of L-BSE in hamsters. The incubation period of hamsters intracerebrally inoculated with L-BSE was 576.8 days, and that of the subsequent passage was decreased to 208 days. Although the lesion and glycoform profiles and relative proteinase K resistant core fragment of the abnormal isoform of PrP (PrPcore) of L-BSE were similar to that of C-BSE, the deposition of the abnormal isoform of PrP (PrPSc) and the molecular weight of PrPcore of L-BSE was different from than that of C-BSE. In hamster models, some prion strain characteristics of L-BSE were indistinguishable from those of C-BSE.
Acknowledgments
We thank the laboratory staff at the Prion Disease Research Center for providing technical support and the animal care staff at the National Institute of Animal Health for maintaining the experimental animals. This study was supported by grants from the BSE control project of the Ministry of Agriculture, Forestry and Fisheries of Japan, and by grants from the Ministry of Health, Labour and Welfare of Japan and in part by a grant from the Bio-oriented Technology Research Advancement Institution (Tokyo, Japan).
Figures and Tables
Figure 1 Neuropathology and PrPcore characteristics of L-BSE-affected TgHaNSE mice. (A) hematoxylin and eosin staining of the corpus callosum of mice. (B) PrPSc deposition was detected in the semiserial sections. PrP-plaque is indicated by an arrow. PrP was detected by mAb SAF-84. Scale bars: 200 mm. (C) PrPSc in L-BSE affected TgHaNSE mice was detected by western blotting. Lane 1: C-BSE (cattle), lane 2: L-BSE (cattle), lane 3: C-BSE affected hamster, lane 4: L-BSE affected hamster, lanes 5 and 6: L-BSE affected TgHaNSE, lane 7: scrapie Obihiro-affected mouse. PrP was detected by mAb T2.
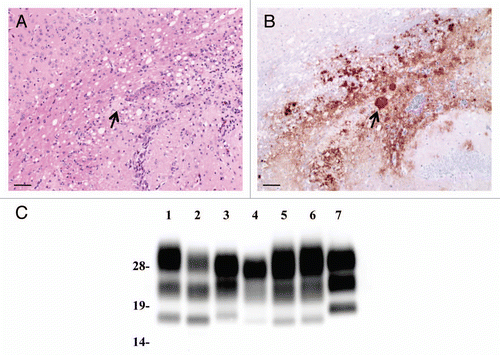
Figure 2 Neuropathological lesion profiling and PrPSc deposition in hamsters. (A) Vacuolar lesion profiles in Syrian hamster brains as observed for scrapie strains Sc237, C-BSE-affected hamsters (C-BSE) and L-BSE-affected hamsters (L-BSE). Gray matter scoring areas: 1, dorsal medulla; 2, cerebellar cortex; 3, superior colliculus; 4, hypothalamus; 5, medial thalamus; 6, hippocampus; 7, septum; 8, posterior cerebral cortex; 9, anterior cerebral cortex. White matter scoring areas: 1*, cerebellar white matter; 2*, midbrain white matter; 3*, cerebral peduncle. Mean (standard deviation) (n = 4). (B) PrPSc deposition in the brains of hamsters affected with C-BSE (second passage), L-BSE (second passage) and Sc237 (serial passage). MAb SAF84 was used for immunostaining. Upper, cerebral cortex; lower, cerebellum.
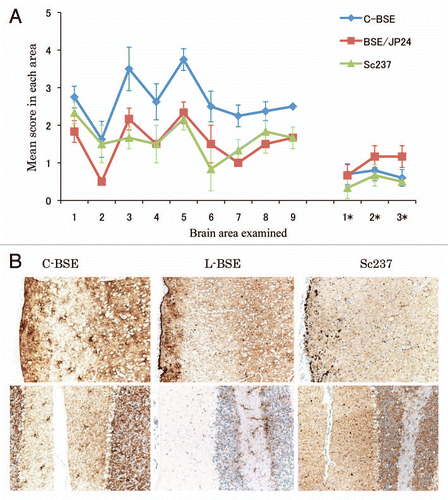
Figure 3 Western blotting analysis of PrPcore from C-BSE- and L-BSE-affected hamsters. (A) Lane 1: C-BSE-affected cattle (natural case); lane 2: L-BSE-affected cattle (natural case); lanes 3 and 6: Sc237-affected hamsters; lanes 4 and 7: C-BSE-affected hamsters; lanes 5 and 8: L-BSE-affected hamsters; lanes 6–8: PNGaseF treatment. (B) The relative amount (%) of di-, mono- and non-glycosylated PrPcore. The results are the mean (standard deviation) of three experiments. Bar diagram: di- (black), mono-(grey) and nonglycosylated form (white).
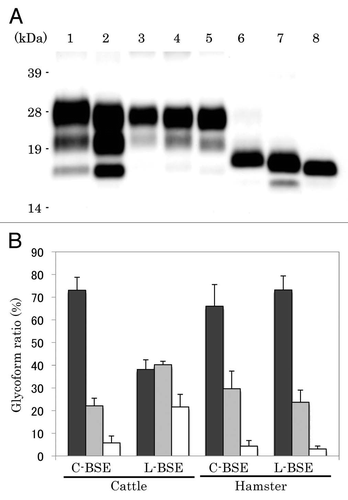
Figure 4 Relative PK resistance of PrPcore in prion-affected hamsters. (A) Western blot results. Lanes 1–4: hamster-adapted C-BSE; lanes 5–8: L-BSE-affected hamster. Lane 9: mouse scrapie prion. The samples were treated with 40 (lanes 1 and 5), 100 (lanes 2 and 6), 500 (lanes 3 and 7) and 1,000 (lanes 4 and 8) µg/ml of PK at 37°C for 1 h. PrPcore was detected with mAb 6H4. Molecular markers are shown on the left (kDa). (B) Relative amount (%) of PrPcore after different PK concentration were indicated. Black circle: C-BSE affected hamster, black square: L-BSE affected hamster, white circle: C-BSE affected cattle, white square: L-BSE affected cattle. Cattle results are obtained from previous study in reference Citation11.
Table 1 Transmissibility of L-BSE in mice
Table 2 Incubation period of hamsters inoculated with C-BSE and L-BSE
Table 3 Comparison of the PrP amino acid sequences in mouse and hamster