
Abstract
It is widely recognized that amyloid formation sensitively responds to conditions set by myriad cellular solutes. These cosolutes include two important classes: macromolecular crowders and compatible osmolytes. We have recently found that addition of macromolecular PEG only slightly affects fibril formation of a model peptide in vitro. Polyol osmolytes, in contrast, lengthen the lag time for aggregation, and lead to larger fibril mass at equilibrium. To further hypothesize on the molecular underpinnings of the disparate effect of the two cosolute classes, we have further analyzed the experiments using an available kinetic mechanism describing fibril aggregation. Model calculations suggest that all cosolutes similarly lengthen the time required for nucleation, possibly due to their excluded volume effect. However, PEGs may in addition promote fibril fragmentation, leading to lag times that are overall almost unvaried. Moreover, polyols effectively slow the monomer-fibril detachment rates, thereby favoring additional fibril formation. Our analysis provides first hints that cosolutes act not only by changing association or dissociation rates, but potentially also by directing the formation of fibrils of varied morphologies with different mechanical properties. Although additional experiments are needed to unambiguously resolve the action of excluded cosolutes on amyloid formation, it is becoming clear that these compounds are important to consider in the search for ways to modulate fibril formation.
Acknowledgments
We thank our colleagues Assaf Friedler, Dganit Danino, Regina Politi and Lior Ziserman, for their invaluable contributions to our original study on which this manuscript is based. We thank P. Lo Nostro for helpful discussions. DH acknowledges support from the Israel Science Foundation (ISF grants 1011/07, 1012/07). The Fritz Haber Center is supported by the Minerva Foundation, Munich, Germany.
Figures and Tables
Figure 1 ThT fluorescence assay of peptide aggregation and corresponding typical time scales in the aggregation process. (A) Fluorescence intensity vs. time in aqueous solution (orange hexagons) and in the presence of various cosolutes: sorbitol 1.66 m (black squares); glycerol 2.37 m (red circles); PEG4000 0.03 m (green upward pointing triangles); PEG400 0.48 m (blue downward pointing triangles); TEG 0.83 m (purple diamonds). (B) Nucleation lag time, τlag, as a function of the molality of cosolute monomers. (C) Peak fluorescence emission, Fmax, as a function of cosolute molality. (D) Elongation time, τel, as a function of cosolute molality. The dotted lines are guides for the eye, and error bars represent standard deviations from an average of 4 kinetic curves.
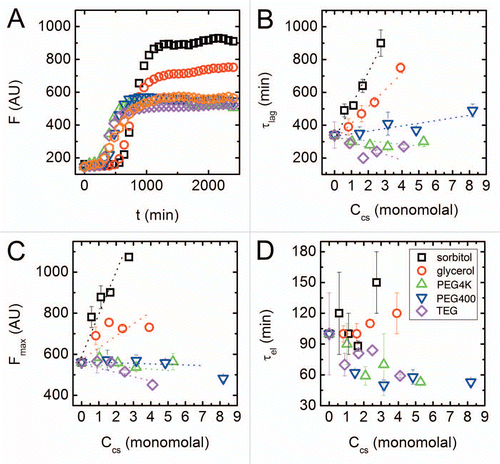
Figure 2 Kinetics of amyloid aggregation. (A) A schematic representation of the steps in the kinetic scheme used to fit the data. The mechanism involves reversible nucleation, reversible monomer-fibril association, and fibril fragmentation steps. (B) Fibrilized monomer fraction as a function of time (black squares) with an overlaid optimized fit to the kinetic model (red line). The fibrilized monomer fraction relates to the fluorescence signal () by selecting the highest fluorescence signal in the entire data set (found for the highest concentration of sorbitol) and assuming that value is the fluorescence signal for a fully fibrilized sample.
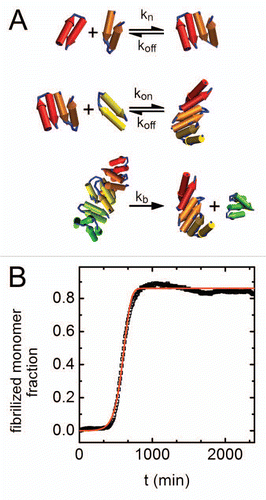
Figure 3 Changes in fibrillation kinetic constants with cosolute concentration. Results are shown in terms of best fitted values for (A) kn kon, which represents rates at the nucleation step, (B) kb kon that is related to the rate of filament population growth and (C) koff/kon representing the quasi-equilibrium constant for monomer-fibril dissociation. Symbols as in . Errors as determined by an average of 3 fits to each curve are <1%.
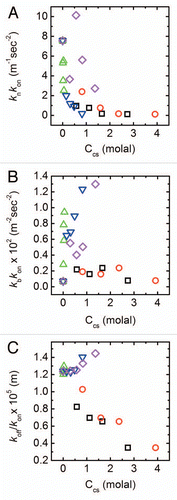
Figure 4 Scaling of kinetic constants. (A) Scaling of nucleation lag time τlag with nucleation rate knkon as determined from a fit to EquationEquations 1 and Equation2
. The scaling law is τlag ∼(knkon)−0.25. (B) Apparent monomer-fibril dissociation constant as a function of osmotic pressure. Lines are linear fits of the data; symbols as in .
![Figure 4 Scaling of kinetic constants. (A) Scaling of nucleation lag time τlag with nucleation rate knkon as determined from a fit to EquationEquations 1dPdt=kb[M(t)−(2nc−1)P(t)]+knm(t)nc and Equation2dMdt=[2m(t)kon−nc(nc−1)kb−koff]P(t)+ncknm(t)nc. The scaling law is τlag ∼(knkon)−0.25. (B) Apparent monomer-fibril dissociation constant as a function of osmotic pressure. Lines are linear fits of the data; symbols as in Figure 1D.](/cms/asset/9277c573-646b-4f3d-928d-376774b57317/kprn_a_10918132_f0004.gif)