Abstract
Significant progress has been made in the past years to improve the quality of streamflow data and to assess the potential of hydroacoustics. However, little effort has been made in monitoring techniques for under-ice streamflow. This paper presents a case study in which the under-ice index velocity method is used for monitoring ice-affected streamflow with an acoustic Doppler velocity meter (ADVM). The method is particularly interesting since it is reliable during periods of backwater effects, and it is fully automated and objective. In this particular case study, a reliable rating was obtained in five years, with only two discharge measurements per year.
L'amlioration de la qualit des donnes hydromtriques et le potentiel de la technologie hydroacoustique ont fait l'objet de beaucoup de dveloppement au cours des dernires annes. Cependant, peu d'effort a t dploy en ce qui concerne le suivi des dbits sous-glace. L'article suivant prsente une tude de cas utilisant la mthode de la vitesse tmoin sous-glace pour le suivi du dbit en rivire affect par la glace, l'aide d'un ADVM (acoustic Doppler velocity meter). Cette mthode est particulirement intressante puisqu'elle est fiable en priode d'effet de refoulement, et qu'elle est totalement automatise et objective. Dans ce cas particulier, une relation fiable a t obtenue en cinq ans, raison de seulement deux jaugeages par anne.
Introduction
Real-time monitoring, and the subsequent online publication of reliable streamflow data, are two of the challenging tasks assigned to modern day hydrologists. The accuracy of the data that are produced is obviously related, amongst other factors, to the performance of the instruments used for stage and velocity monitoring, and for discharge measurement. In the last two decades, evaluation and standardization procedures for the use of various hydroacoustic equipments for discharge measurement (Simpson and Oltmann, Citation1993; Oberg and Mueller, Citation1994; Citation2007; Simpson, Citation2001; Water Survey of Canada (WSC), Citation2004; Mueller and Wagner, Citation2009) and streamflow monitoring, both in open flow (Melcher et al., Citation1999; Morlock et al., Citation2002; Ruhl and Simpson, Citation2005; Schmidt, Citation2005) and under-ice (Wang, Citation2000; Healy and Hicks, Citation2004) conditions have been carried out, aiming to increase accuracy in hydrometric data. Notwithstanding, little development has been targeted at under-ice streamflow monitoring. Yet, more than half of the continuous-record streamflow-gauging stations operated by the U.S. Geological Survey (USGS) are affected by ice, and virtually all of the stations operated by the Water Survey of Canada (WSC) are also affected (Walker and Wang, Citation1997). According to Hamilton (Citation2003), ice-affected streamflow accounts for 18.7% of all hydrometric data published in Canada by the WSC, and the province of Qubec is fairly representative of the rest of the country with 18.2%.
Hamilton (Citation2003) investigated eleven stations located in the Yukon Territory over the period October, 2001 to May, 2002, and concluded that only 16% of the discharge data published can be considered reliable. Moreover, Melcher and Walker (Citation1992) stated that the inability to automate the process of estimating ice-affected streamflow increases the operation costs of hydrometric stations. This inability not only is due to instrument malfunction during cold temperature periods, but also to the inadequacy of the open-flow stage-discharge rating technique for under-ice flow, caused primarily by backwater effects. Thus, there is a need for the development of automated rating techniques more adapted to flow under-ice.
Since 2006, Hydro Quebec has been gradually moving from the conventional current meter in favour of acoustic Doppler current profilers (hereafter ADCPs) for measuring discharge in open flow conditions, targeting enhanced accuracy of the data used in water supply forecasts and hydraulic power management tools. For northern remote hydrometric stations, accessed by helicopter only, the use of hydroacoustics provides flexibility and efficiency compared to traditional measurements using a current meter. Hydro Quebec's research institute, IREQ (Institut de recherche d'Hydro-Qubec), has also investigated the potential use of bottom-mounted acoustic Doppler velocity meters (hereafter ADVMs) for real-time streamflow monitoring in ice-affected rivers.
This paper presents a case study focusing on under-ice streamflow monitoring at a station equipped with a level sensor and a bottom-mounted Argonaut SW ADVM. The under-ice Index Velocity Relationship (hereafter IVR) method is investigated and compared with the existing stage-discharge relationship (hereafter SDR). An overview of winter streamflow monitoring issues is first presented, with emphasis on the advantages of hydroacoustics compared to traditional techniques. Note that any use of trade or product name is for descriptive purposes only.
Winter Streamflow Monitoring Issues
Under-ice discharge measurement, stage and velocity monitoring, and streamflow computation are all subject to greater uncertainties in ice-affected rivers. While a precision target of 95% is often chosen for streamflow ratings, a value of 85% was set at the IREQ for under-ice streamflow monitoring to account for the uncertainties and winter-related issues described in this section.
Under-Ice Discharge Measurement
A comprehensive description of challenges and uncertainties related to winter discharge measurements is provided in Pelletier (Citation1990). The overall uncertainty in the determination of river discharge using the velocity-area method and a current meter is related to: (1) uncertainty in the determination of the cross-sectional area, i.e., the determination of widths and depths, due to the presence of frazil ice and/or anchor ice and the irregular shape of the ice cover; (2) uncertainty in the determination of individual velocity measurements used for the computation of the mean velocity due to potential freeze-up of the current meter, reduced precision of the current meter at very low velocities, and insufficient spatial resolution; and (3) uncertainty in the approximation of the integral of the product of a velocity field over a cross-section by finite summations of the product of width, depth and mean velocity.
Because the presence of frazil ice and/or anchor ice, and the shape of the ice cover cannot be measured accurately, care should be taken when choosing the measurement cross-section in order to minimize error. The last two sources of uncertainty, however, can be reduced by using ADCPs for winter discharge measurement, mostly because of the greater vertical resolution of velocity profile measurement obtained with hydroacoustics. Nonetheless, ADCPs still have to be lowered in successive observation holes drilled in the ice; the vertical velocity profile measured in an observation hole is applied laterally from half the distance from the preceding observation hole to half the distance to the next one. The time required to make a discharge measurement in winter using an ADCP is comparable to the time needed with a current meter. One (0.5 depth method) or two (0.2 and 0.8 depth method) point velocities are measured at each sub-section with the current meter, using an averaging time between 40 and 80 seconds. There is currently no guideline regarding the proper measuring duration for winter ADCP measurements. The first ADCPs used by the IREQ in 2003 had typical pinging rates of 1 ping per second and a measuring duration of 120 seconds, and provided reasonably low standard deviation on velocity measurement. This averaging time is still used by the IREQ, but further investigation is recommended since faster pinging rates are now available and the interval can probably be shortened.
Also, when moving the ADCP from one hole to the next, a thin layer of ice is likely to form on the transducers. For precise calculation of sound of speed in water, the ADCP should remain in the water for a while before starting a measurement to ensure that any ice build-up on the transducers has melted, and also to ensure that the internal temperature of the ADCP is in equilibrium with the water temperature.
Real-Time Monitoring of Level and Velocity
Hydrometric stations are often equipped with level sensors of the gas purge type, which linearly convert the pressure of the water column above a submerged pipe into a stage measurement. These instruments are state-of-the-art for open flow conditions and have been used for decades, but they are subject to leakages or blockages during ice-affected periods (Hamilton, Citation2003). Moreover, increased pressure in the cross-section due to backwater effects affects the stage readings. ADVMs, which have been used increasingly in the last decade, have the advantage of not being influenced by pressure under the ice cover since they rely on the echo intensity of an acoustic beam to determine the water height. Also, the velocity profile measured by the ADVM can be used in streamflow computation, or at least to provide better understanding of the channel behaviour (e.g., low velocities combined with high stage during ice jams). Useful ancillary data from ADVMs include: water temperature, signal amplitude (backscatter), velocity standard error, pressure, etc. Additionally, the ice score is a special feature of the up-looking Argonaut SW, which indicates the presence of an ice cover (Hutha and Choquette, Citation2005). This is a great improvement from the traditional level gauge since the presence of ice does not have to be inferred from external observations, such as climatic data and nearby stations, but can be actually detected. Of course, the presence of ice is measured above the ADVM only and should be regarded as such. Bottom-mounted ADVMs are prone to silting and clogging, while side-mounted ADVMs are vulnerable to ice damage, and both mounting types are vulnerable to lightning. Silting and clogging may be avoided by using proper cleaning systems on a regular basis. Also, very low suspended sediment concentrations often encountered in winter may affect the ability of the ADVM to measure the entire velocity profile. Conversely, the presence of frazil ice may result in extremely high backscatter and prevent measurement. The accumulation of frazil ice from the surface down during the formation of the ice cover can also lead to a period of low stage readings that are not necessarily representative of the cross-section. In this case, velocities above the ADVM are also usually very low and the resulting computed discharge then is biased low. This reinforces the importance of site selection when establishing a new hydrometric station especially when reliable under-ice flow data are needed. Reaches with high bed transport rates and which are prone to extended periods of frazil ice should be avoided (Fournier et al., Citation2011).
Rating Techniques
Melcher and Walker (Citation1992) undertook a comprehensive study evaluating 17 subjective and analytical methods for determining streamflow during periods of ice effect. Most of the methods were based on the streamflow computed from an SDR, and/or required frequent discharge measurements in order to be reliable. As mentioned above, a major drawback of the SDR method is its inability to provide reliable under-ice streamflow data, mostly due to positively biased stage readings under ice cover. An alternative to the SDR is the use of an IVR, based on the profile integrated velocity and stage measured by an ADVM. The IVR method has been previously described and investigated by many authors (e.g., Rantz et al., Citation1982; Morlock et al., Citation2002; Healy and Hicks, Citation2004; Schmidt, Citation2005; and Ruhl and Simpson, Citation2005). Amongst them, Healy and Hicks (Citation2004) specifically tested the IVR for winter discharge measurement.
Typically, linear regression is used to define the relation between the mean cross-sectional velocity and an index velocity, as in EquationEquation (1).
where V
m
is the mean cross-sectional velocity, V
i
is the index velocity, and b and a are, respectively, the slope and the intercept of the linear regression between V
m
and V
i
. In some cases, for instance when the area significantly changes with an increase in stage (e.g., a channel with overbank flow at high stage), stage may also be an explanatory variable of the relation between V
m
and V
i
, and an IVR of the form of EquationEquation (2) is preferred to EquationEquation (1)
.
where a is a constant, b is the velocity index coefficient, and c is the stage coefficient.
The integrated velocity of a vertical or horizontal profile measured by means of an ADVM is often used as index velocity, but Healy and Hicks (Citation2004) demonstrated that other velocity values, such as the maximum point velocity for the entire cross-section, the maximum vertically averaged panel velocity for the cross-section, and others, can be used successfully to build a reliable IVR. Streamflow is obtained by multiplying the mean cross-sectional velocity with the cross-sectional area determined with a stage-area rating.
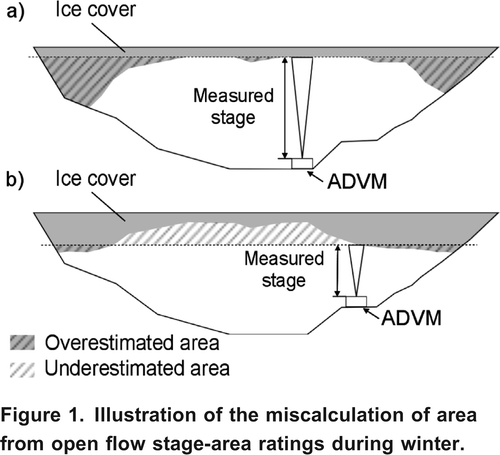
A considerable advantage of the IVR for winter streamflow determination is that it is based on stage and velocity measurement instead of stage only. Particular conditions, such as backwaters, can thus be detected with a higher level of confidence. Yet, the open flow IVR cannot be used directly for ice-affected streamflow computation for the following two reasons. First, when a reach is completely or partially covered with ice, the velocity distribution in the cross-section changes because of the friction between the ice cover and the water, and the relation between index and cross-sectional velocities is different than in open flow conditions. Secondly, the area calculated from the open flow stage-area rating in winter could be erroneous depending on the shape of the ice cover, the presence of frazil ice and/or anchor ice, and the position of the ADVM in the section. shows two different ADVM positions (both up-looking) and ice cover shapes for similar cross-sections. illustrates the case where using the open flow stage-area rating would lead to an overestimation of the actual flow area, whereas illustrates the opposite case.
Figure 1. Illustration of the miscalculation of area from open flow stage-area ratings during winter.
The changes in the relation between index velocity and mean cross-sectional velocity during the winter can be accounted for by multiplying the open-flow index velocity by a correction coefficient as proposed by Rantz et al. (Citation1982). Two-dimensional modelling can also be used to obtain the actual under-ice velocity profile (Wang, Citation2000). Another approach, investigated in the case study below, consists of building an under-ice IVR from winter discharge measurements and the ADVM data. The approach is based on the idea that a rating built strictly from under-ice velocities should perform better in winter than a rating built from open-flow velocities. It also relies on the hypothesis that the under-ice flow pattern is relatively constant throughout the years, which is not necessarily the case. Moreover, the uncertainty related to the computation of the cross-sectional area still exists with this method. The error associated with the open-flow stage-area rating in winter is hardly quantifiable and is not constant through the winter due to the evolution of the ice. Real-time assessment of the ice thickness along the cross-section would certainly improve the performance of the under-ice IVR method. However, it is a huge technical challenge to obtain this information, and gain on precision should be compared to the cost of such measurements.
Case Study
Site Description
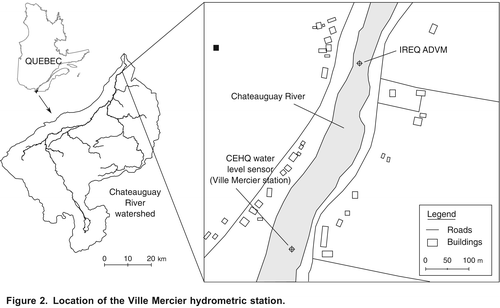
The under-ice IVR method was investigated from 2004 to 2009 at the Ville Mercier hydrometric station on the Chateauguay River in the Province of Quebec (). The Chateauguay River watershed covers approximately 2,500 km2, and the river flows for 120 km from the Upper Chateauguay Lake, situated in the State of New York, USA, to the St-Lawrence River, near Montreal. The Ville Mercier station is located 9 km upstream of the river outlet. The station is owned by the Water Survey of Canada and has been operated by the Centre d'Expertise Hydrique du Qubec (CEHQ) since 1970. The cross-section is 80 m wide and has a mean depth of 1.3 m in winter. Depending on the climatic conditions, an ice cover forms for one extended period (typically from January to March), or periods of freeze up and thaw alternate and the section may be partially opened. The Ville Mercier station is equipped with two redundant Hydrologic LPN 8/2 level meters using the bubble to bubble principle, and discharge measurements are carried out by the CEHQ using Price AA current meters, both in open flow and under ice. Under-ice discharge measurements are made twice a year. At least 20 holes are drilled along the cross-section, and a criterion of maximum 10% of the total discharge per hole is observed, as prescribed in Dub and Morneau (Citation1989). Frazil ice beneath the ice cover is frequently seen at the station. For the 1970-2001 period, a minimum discharge of 0.7 m3/s was observed in October 1974, and a maximum of 1,090 m3/s was recorded during the flood in March 1998. The mean annual discharge for the station for the same period is 38 m3/s.
Figure 2. Location of the Ville Mercier hydrometric station.
Determination of an Under-Ice Index Velocity Relationship
In Fall 2003, an up-looking SonTek Argonaut SW ADVM was installed 450 m downstream the Ville Mercier station (see ). The cross-section at this location is 40 m wide with an average depth of 1.5 m. Velocities are thus higher than at the Ville Mercier station, making this cross-section more appropriate for an IVR. A stage-area relationship was first built from bathymetric survey and open-flow stage data from the ADVM. The under-ice IVR was built using the under-ice measurements carried out by the CEHQ in 2004, 2005, 2006, 2008 and 2009. An instrument malfunction made it impossible to record data with the ADVM during the Winter of 2007. The discharge measured at the Ville Mercier station is assumed to be the same 450 m downstream, at the ADVM cross-section, since there is no tributary between the station and the ADVM, and groundwater seepage is neglected between the two locations. The steps followed to build the IVR are:
| 1. | The flow area is computed from the open-flow stage-area relationship using the stage recorded by the ADVM at the moment of the discharge measurement. | ||||
| 2. | The mean cross-sectional velocity is the measured discharge divided by the area computed at step 1. | ||||
| 3. | Mean cross-sectional velocities are plotted against averaged integrated vertical velocities (and stage if applicable) measured by the ADVM for the duration of the discharge measurement (typically one hour), and linear regression is performed on the data points to obtain the IVR equation. | ||||
Results
shows the evolution of the IVR from 2005 to 2009. For each year, the upper graph shows the entire set of velocity data points. Open circles represent the data used in the current year IVR, i.e., velocities measured in the previous and the current years, and closed circles are the data to be collected. The linear regression between the mean cross-sectional velocity (V m ) and the integrated velocity (V i ) is also found from the upper graph, as well as the number of observations (n), the coefficient of determination (R2 ), the root mean squared error (RMSE), and 90% prediction intervals. The lower graphs show the error on streamflow computed with the current IVR, with a 15% envelope. The linear regression and the confidence intervals are plotted for values of V i between 0 and 2.2 m/s; the latter is the maximum under-ice velocity measured by the ADVM between 2004 and 2009.
Figure 3. Evolution of the under-ice Index Velocity Relationship (IVR) between 2005 and 2009.
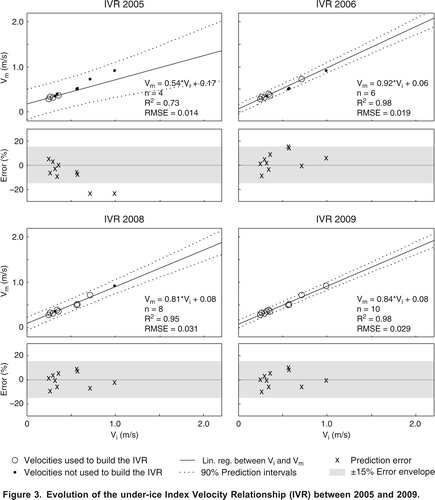
It can be seen on that as early as 2006, the IVR is satisfactory, with a R2 of 0.98, RMSE of 0.019 m/s and narrow confidence intervals. Also in 2006, only one computed streamflow value has a greater error than 15% (15.20%). In 2008, the confidence intervals grow larger due to the two quasi-superimposed data points at V i 0.6 m/s that contributes to increase the variance. The slope and intercept of the IVR equation do not vary much between 2008 and 2009. The first data point added in 2009 at V i = 0.32 m/s confirms the previous IVR, while the second point at V i = 0.99 m/s slightly modifies the slope of the IVR and increases the confidence in the prediction for larger values of V i . Bottom graphs show that errors are well distributed across the zero line, indicating that there is no positive or negative bias associated with the IVR method for this case study.
shows the measured discharges in comparison with the streamflow computed with the 2009 IVR and the non-corrected SDR at the Ville Mercier station. Errors greater than 15% are in bold. As might be expected, the streamflow computed with the non-corrected SDR is always positively biased. The IVR performs better with no absolute error greater than 10.2% and a mean absolute error of 5.0%, compared to 41.1% for the non-corrected SDR. Of course, data for the Ville Mercier station, as well as for other ice-affected stations, are validated and corrected by the CEHQ hydrologists prior to publishing. The CEHQ uses the discharge-ratio method to adjust ice-affected streamflow based on measured discharges. The beginning and end of ice-affected periods are detected by comparison with other stations and rigorous observation of climate data. The data resulting from these corrections is believed to carry a much lower absolute error than the non-corrected ones.
Table 1. Comparison of measured discharge and computed streamflow.
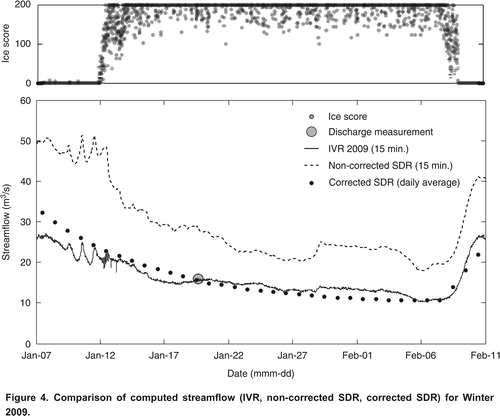
shows the corrected daily average streamflow data published by the CEHQ from mid-January, 2009 to mid-February, 2009, along with the 2009 IVR and non-corrected SDR streamflow, and the discharge measurement carried out on January 19, 2009. The ice score is also presented. A completely frozen reach typically gives an ice score between 150 and 200, while values between 50 and 150 are seen during freeze and break up periods (Hutha and Choquette, Citation2005). In , the ice score thus indicates that the ADVM cross-section was presumably frozen from January 14 to February 8, 2009. This ancillary data provided by the ADVM is of great value for determining which method to use to compute streamflow (open-flow or under-ice relationship). Still, as mentioned before, the presence of frazil ice during transition periods can affect the performance of the ADVM. This phenomenon can be observed in between January 12 and January 14, 2009 during the freeze-up. Several low values are found in the data as the level and velocities read by the ADVM are presumably affected by the accumulation of frazil ice.
Figure 4. Comparison of computed streamflow (IVR, non-corrected SDR, corrected SDR) for Winter 2009.
A greater number of discharge measurements would have been necessary to really assess the performance of the under-ice IVR at this site. However, the fact that the under-ice IVR data are in agreement with the published reference data is encouraging since the IVR is fully automated, objective, and less time-consuming for similar results. For the period shown in , the greatest absolute difference between the daily 2009 IVR streamflow and the corrected SDR streamflow, the latter being the reference, is 18.5% and the mean absolute difference is 10.0%.
Conclusion
The under-ice IVR method for ice-affected streamflow monitoring was tested near the Ville Mercier station near Chateauguay, Quebec. The method gave promising results with errors on computed streamflow less than 15% after five years, and less than 10% after six years compared to discharge measurements. The major advantages of the method are that it is reliable in times of backwater conditions, and that it is automated and objective compared with the SDR. Nevertheless, further work is needed in order to extend the method to different streams and conditions. Future studies should include longer spans of investigation, more stations with various conditions and velocities, and frequent discharge measurements for validation of the IVR.
Acknowledgements
The financial contribution of Hydro Qubec and the valuable collaborations with CEHQ personnel are gratefully acknowledged by the authors. The authors also want to acknowledge the contribution of Luc Martell and Pierre Lavigne from IREQ (Institut de recherche d'Hydro-Qubec), and Claude Gignac and Yves Gosselin from Hydro Qubec Production.
References
- Dub, M., and J. Morneau. 1989. Manuel de procdures pour les relevs hydromtriques. Ste-Foy, Quebec: Ministre de l'Environnement, Direction du milieu hydrique, 116 pp.
- Fournier, V., Y. Choquette, L. Martell, and C. Guay. 2011. Protocole et instrumentation station hydromtrique utilisant la technologie acoustique Doppler. Report IREQ-2011-0080. Varennes, Quebec: Institut de Recherche d'Hydro Qubec, 85 pp.
- Hamilton, S. 2003. Winter hydrometry: real-time data issues. In Proceedings of the12th Workshop on the Hydraulics of Ice Covered Rivers. Edmonton, Alberta, June 1920, 2003.
- Healy, D., and F. E. Hicks. 2004. Index velocity methods for winter discharge measurement. Canadian Journal of Civil Engineering 31: 407419. doi:10.1139/l04-001.
- Hutha, C., and Y. Choquette. 2005. Ice detection and under-ice flow monitoring using a SonTek Argonaut-SW. In Proceedings of IEEE/OES Eighth Working Conference on Current Measurement Technology. Southampton, UK, June 2829, 2005, pp. 9396. doi:10.1109/CCM.2005.1506347.
- Melcher, N. B., and J. F. Walker. 1992. Evaluation of selected methods for determining streamflow during periods of ice effect. U.S. Geological Survey Water-Supply Paper 2378. Washington DC: U.S. Geological Survey, 47 pp.
- Melcher, N. B., R. Cheng, and F. Haeni. 1999. Investigating technologies to monitor open-channel discharge by direct measurement of cross-sectional area and velocity of flow. In Proceedings of Hydraulic Engineering for Sustainable Water Resources Management at the Turn of the Millennium. Graz, Austria, August 2227, 1999, Paper No. 181, 6 pp.
- Morlock, S. E., H. T. Nguyen, and J. H. Ross. 2002. Feasibility of acoustic Doppler velocity meters for the production of discharge records from U.S. Geological Survey streamflow-gaging stations. Water-Resources Investigations Report 01-4157. Indianapolis, Indiana: U.S. Geological Survey, 56 pp.
- Mueller, D. S., and C. R. Wagner. 2009. Measuring discharge with acoustic Doppler current profilers from a moving boat. U.S. Geological Survey Techniques and Methods 3A-22. Reston VA: U.S. Geological Survey, 72 pp.
- Oberg, K., and D. S. Mueller. 1994. Recent applications of acoustic Doppler current profilers. In Fundamentals and advancements in hydraulic measurements and experimentation, 341350. New York: American Society of Civil Engineers.
- Oberg , K. and Mueller , D. S. 2007 . Validation of streamflow measurements made with acoustic Doppler current profilers . Journal of Hydraulic Engineering , 133 ( 12 ) : 1421 – 1432 .
- Pelletier, P. 1990. A review of techniques used by Canada and other northern countries for measurement and computation of streamflow under ice conditions. Nordic Hydrology 21(45): 317340. doi:10.2166/nh.1990.023.
- Rantz, S., J. G. Watt, and D. L. Peck. 1982. Measurement and computation of streamflow: volume 2, computation of discharge. U.S. Geological Survey Water-Supply Paper 2175, pp. 285631. Washington D.C.: U.S. Government Printing Office.
- Ruhl, C. A., and M. R. Simpson. 2005. Computation of discharge using the index velocity method in tidally affected areas. U.S. Geological Survey Scientific Investigations Report 2005-5004. Reston VA: U.S. Geological Survey, 31 pp.
- Schmidt, A. 2005. Tools for development of Index Velocity Ratings. In Proceedings of Short Course at 2nd International SonTek User's Conference. Orlando FL, January, 2005.
- Simpson, A. 2001. Discharge measurement using a broad-band acoustic Doppler current profiler. U.S. Geological Survey Open-File Report 01-1. Sacramento CA: U.S. Geological Survey, 123 pp.
- Simpson, M. R., and R. N. Oltmann. 1993. Discharge measurement system using an acoustic Doppler current profiler with applications to large rivers and estuaries. U.S. Geological Survey Water-Supply Paper 2395. Washington D.C.: U.S. Government Printing Office, 32 pp.
- Walker, J. F., and D. Wang. 1997. Measurement of flow under ice covers in North America. Journal of Hydraulic Engineering 123: 10371040. doi:10.1061/(ASCE)0733-9429(1997)123:11(1037).
- Wang, D. 2000. Discharge calculations of natural channel flows with AFM data. In Proceedings of theJoint Conference on Water Resource Engineering and Water Resources Planning and Management. Minneapolis, MN, August 2000 (published on CD).
- Water Survey of Canada. 2004. Procedures for conducting ADCP discharge measurements. Report SOP001-2004. Ottawa: Environment Canada, 27 pp.