

ABSTRACT
We present a mixed-methods approach to community-based assessment design that engages tribal college and university faculty, students, and science educators, as well as experts in cultural knowledge from the Blackfeet and Diné (Navajo) nations. Information from cultural experts, gathered through a combination of sequential surveys and focus group sessions, was analyzed to identify important themes with regard to assessment and geoscience content within the context of these communities. While experts use a variety of assessment approaches in their classrooms, only pre- and posttesting and portfolios were found to be most valuable. Experts indicated that the primary role of assessment was to monitor student progress, steer instruction, and prepare students for success; thus, assessment should be tied to the course goals. Experts differed on their views regarding sources of bias in testing, but overall they agreed that test language and content were both strong sources of bias. They indicated that input on assessment would help to incorporate local context and provide a mechanism for combating bias. Surveys completed by tribal college faculty and Native American students from Blackfeet Community College (BCC) and Arizona State University (ASU) provided information on the themes of geoscience, native science, place, and culture. Participants provided a variety of examples of important geoscience concepts that focused on (1) traditional geoscience concepts (e.g., the composition of Earth materials), (2) Earth system concepts (e.g., the environment and ecosystems), and (3) interactions between native culture and geoscience (e.g., incorporation of native language in science curriculum). Combined, these data offer the basis for developing place-based and culturally informed geoscience assessments by revealing geoscience content that is important to the local community. To aid in assessment design, one-on-one interviews with tribal college faculty and science educators, as well as students from BCC and ASU, provided specific feedback on the question validity of select items from an existing instrument: the Geoscience Concept Inventory (GCI). Emergent themes from the interview transcripts address assessment content, language, and format and reference school science, cultural knowledge, physical places, and connections to the local landscape (e.g., sense of place). Together, these data (1) address the validity of the GCI as a standardized assessment measure in these student populations and (2) provide the basis for developing open-ended assessment questions and concept inventory–like questions that incorporate this feedback.
Key words: :
Acknowledgments
The authors thank the numerous participants from Diné College, BCC, and ASU and members of the Blackfeet and Diné communities for their work on this project. Thanks also to Hannah Clark who created the participant map in ArcGIS. This project is supported by the National Science Foundation (NSF GEO-1034909 and GEO-1034926). Any opinions, findings, and conclusions or recommendations expressed in this material are those of the authors and do not necessarily reflect the views of the NSF. We thank the two reviewers and editorial board for their thoughtful comments that improved this manuscript.
FIGURE 1: Conceptual diagram of research design. Stage 1 of assessment development included administration of Delphi surveys and facilitation of focus group sessions with cultural experts. Faculty and student surveys and one-on-one interviews were also part of Stage 1. These data guided the development of place-based open-ended items for student questionnaires (early Stage 2). Research activities that are complete are in gray.
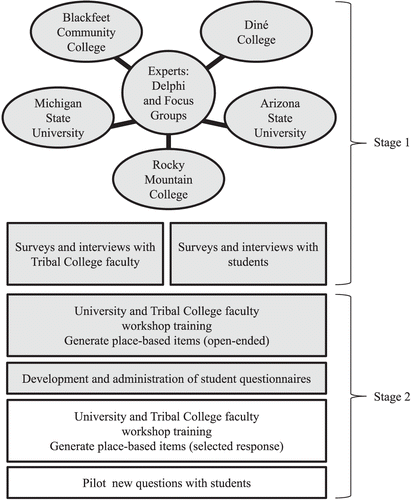
FIGURE 2: Location of participating institutions and hometown zip codes of participants (map: Hannah Clark; projection: Lambert Conformal Conic).
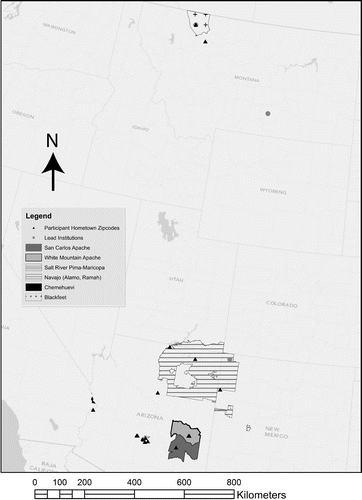
FIGURE 3: In Round 1 of the Delphi, experts indicated that they use a variety of assessment approaches but only found a few to be “most valuable.” The majority of experts used and valued pre- and posttest assessment. Though multiple-choice tests were used by many, they were perceived to have little value by the experts. (Use n = 9, value n = 7; Diné experts only commented on use of assessment.)
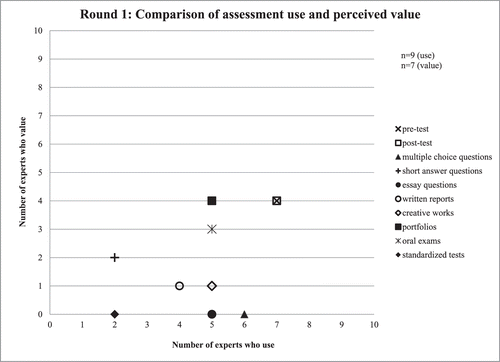
FIGURE 4: When asked to rank the value of assessment (1 = of little value, 5 = very valuable), Blackfeet experts continue to rank pre- and posttesting high but added reflection and participant observation as valuable types of assessment (light gray columns) (n = 7).
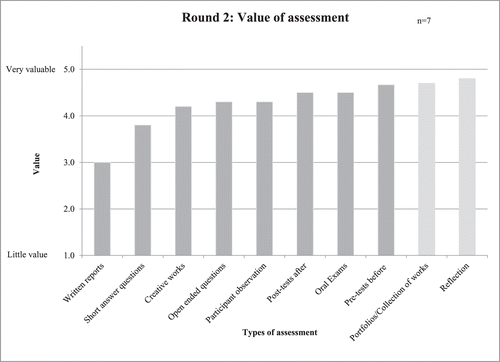
FIGURE 5: When asked to rank the importance of the role of assessment in the areas of curriculum development (dark gray columns), instruction (light gray columns), and student learning (white columns), Blackfeet experts agreed that the role of assessment is to help inform instruction, gauge student understanding, and help students reflect on their learning. Rankings were based on a 5-point scale (1 = not important, 5 = very important) (n = 6). One expert did not answer the question.
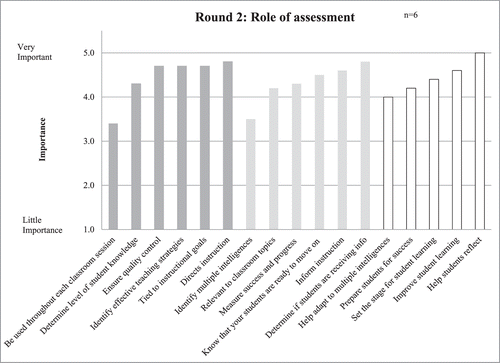
FIGURE 6: Rank-order list of sources of bias in assessment according to Blackfeet experts. In Round 2, experts ranked the list by the level to which they agreed with the source of bias (1 = strongly disagree, 5 = strongly agree). Sources were then categorized according to published sources of bias (CitationNelson-Barber and Trumbull, 2007). Experts suggest that bias occurs during the stages of test creation, as well as in administration. External factors refer to factors that are not inherent to the assessment but rather are factors of the test taker (n = 6). One expert did not answer the question.
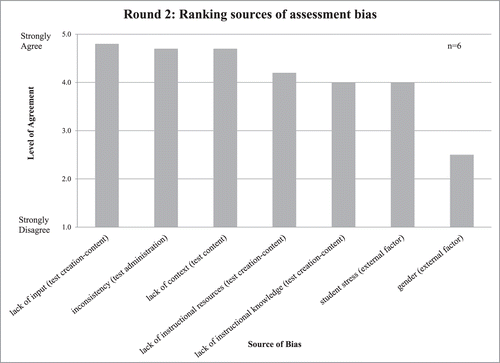
FIGURE 7: Expert rankings of published sources of bias in assessment (CitationNelson-Barber and Trumbull, 2007) in the 2-tier Delphi (1 = strongly disagree, 5 = strongly agree). Values reported are mean expert rankings (n = 5). Some experts did not respond to the question.
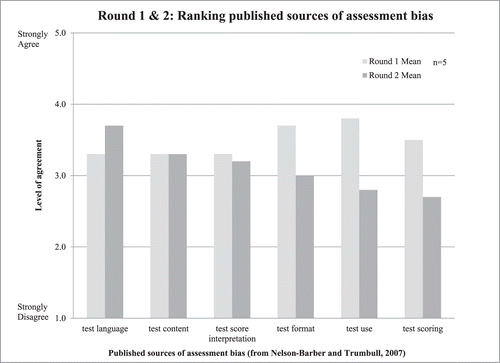
FIGURE 8: BCC and ASU participants in interviews (n = 23) discussed question content more than question language and format overall. Participants focused primarily on the school science content of the GCI questions and often related the question content to the local landscape. The roles of place and culture were secondary focuses in participant discourse with regard to question content.
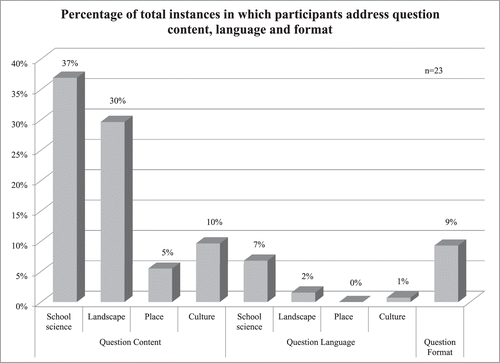
TABLE I: Age, gender, academic training in science, and tribal affiliation for the faculty and students involved in the assessment validation.
TABLE II: Selected GCI items for validation by faculty and students. Numbers reported indicate the number of participants that responded to each item.
TABLE III: Expert views on the role of assessment in curriculum development, instruction, and student learning (n = 9). Numbers reflect the number of respondents to mention these themes regarding the role of assessment.
Notes
1 Not all questions were used in every interview, depending on the length of the interview (∼1 h).
2 ***p < 0.01, **p < 0.05, *p < 0.10.
3 Probes in bold speak to cultural validity (Solano-Flores and Nelson-Barber, 2001).
4 From CitationSolano-Flores and Li (2009).
5 From GCI (CitationLibarkin, 2008).