

Abstract
Now it is possible to combine the different biomaterial properties of graphene and 3 D printing scaffolds produced by tissue engineering for cartilage repair. In the study graphene-containing (1, 3, 5, 10 wt%), porous and oriented poly-ε-caprolactone-based scaffolds were prepared by robocasting method to use in the regeneration of large osteochondral defects. The scaffolds were implanted into the full-thickness osteochondral defect in a rabbit model to evaluate the regeneration of the defect in vivo. For this purpose, twenty female New Zealand white rabbits were used and they were euthanized at 4 and 8 weeks of implantation. The reparative osteochondral tissues were harvested from rabbit distal femurs and then processed for gross appearance assessment, radiographic imaging, histopathological, histochemical and immunohistochemical examinations. Results revealed that graphene-containing graft materials caused significant amelioration at the defect areas. Graphene-containing graft materials improved the fibrous, chondroid and osseous tissue regeneration compared to the control group. The expressions of bone morphogenetic protein-2 (BMP-2), collagen-1 (col-1), vascular endothelial growth factor (VEGF) and alkaline phosphatase (ALP) expressions were more prominent in graphene-containing PCL implanted groups (p < .001). Picrosirrius red method was used for to evaluate connective and muscle tissues. Results also revealed that the ameliorative effect of graphene increased by the elevation in concentration. The most prominent healing was observed in 10 wt% graphene-containing PCL based composite scaffold implanted group. This study results showed that graphene-containing PCL scaffolds enhanced the healing significantly in large osteochondral defect areas compared to the control groups.
Disclosure statement
On behalf of all authors, the corresponding author states that there is no conflict of interest.
Figure 1. Appearance of the osteochondral defect (A), after implantation of bare PCL scaffold as control graft material (B) and graphene-containing PCL as graft material (C).
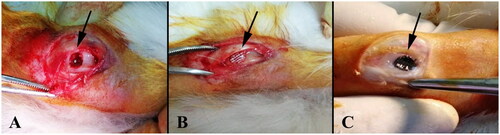
Figure 2. Digital images of the scaffolds prepared in the study, (a) bare PCL; (b) graphene-containing PCL (10 wt%); (c) SEM micrograph of the as-received graphene nanopowders.
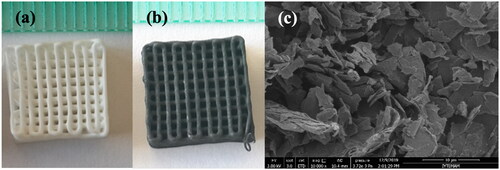
Figure 3. Optical microscope images of the bare (a), (b) and 10 wt% graphene-containing (c), (d) PCL scaffolds.
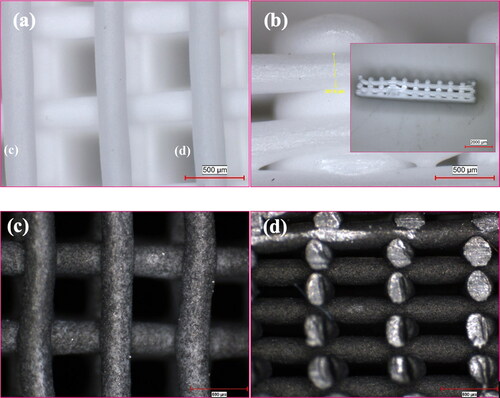
Figure 4. Radiographic image of the defect area (white arrows) of the distal femur at the 8th week, between the groups.
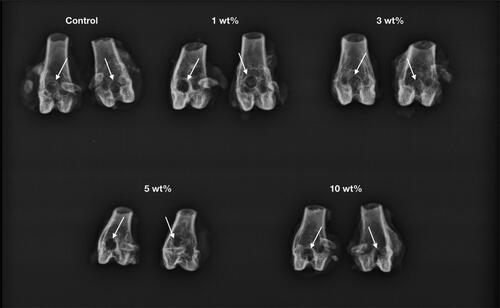
Figure 5. Representative histopathological micrographs of defect areas (thin arrows) of the control, 1%, 3%, 5% and 10% graphene-containing groups (upper row) at 4 weeks, higher magnification (row below), cartilage proliferation areas (thick arrows), implant materials (arrow heads), Haematoxylin-eosin staining, scale bar= 200 µm (for upper row) and 100 µm (for the row below).
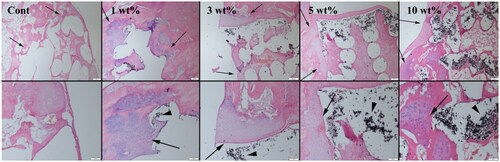
Figure 6. Representative histopathological micrographs of defect areas (thin arrows) of the control, 1%, 3%, 5% and 10% graphene-containing PCL groups (upper row) at 8 weeks, higher magnification (row below), cartilage proliferation areas (thick arrows), Haematoxylin-eosin staining, scale bar = 200 µm (for upper row) and 100 µm (for the row below).
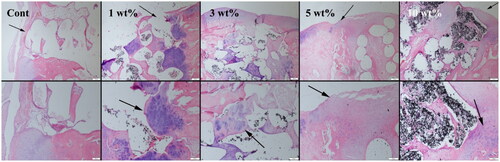
Figure 7. BMP-2 expressions (indicated by arrows) at 4 weeks (upper row) and 8 weeks (below row) groups. Streptavidin biotin peroidase method, scale bar = 50 µm.
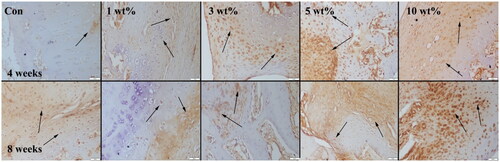
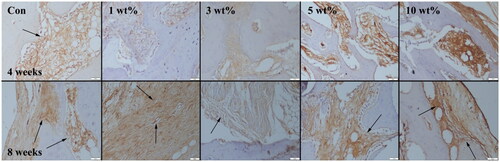
Figure 8. Collagen 1 expressions (indicated by arrows) at 4 weeks (upper row) and 8 weeks (below row) groups. Streptavidin biotin peroxidase method, scale bar = 50µm.
Funding
The author(s) reported there is no funding associated with the work featured in this article.