

Abstract
The pathogenesis of donor cell leukemia (DCL) after allogeneic hematopoietic stem cell transplantation (allo-HSCT) is unclear and likely multifactorial. Leukemic transformation of healthy donor HSCs in recipient’s bone marrow microenvironment provides a useful in vivo model for investigating the mechanisms involved in leukemogenesis. Here, we report a rare case of late-onset DCL developing in a recipient. Whole-genome sequencing indicates that donor-derived cells harboring clonal hematopoiesis of indeterminate potential (CHIP)-associated genetic alterations expand and eventually transform to full-blown AML via acquisition of additional somatic mutations within the recipient’s bone marrow microenvironment. The 10× single-cell RNA sequencing reveals the abundance of GMP-like cells with a specific transcriptional signature in DCL. Moreover, impaired immune surveillance, including dysfunction of cytotoxic T lymphocytes (CTLs) and decreased number of canonical NK cells, is discovered in DCL. Our data add valuable information to the current understanding of the mechanisms of DCL.
Data availability
The raw data for this study are available upon request from the corresponding author.
Results
Case description
A 20-year-old man, diagnosed with AML in September 2014, exhibited biallelic CEBPA mutations and FLT3-ITD mutation. Immunophenotyping revealed the blasts were positive for CD34, CD13, CD33, CD117, CD7 and CD45 (dim). The patient achieved complete remission and was transplanted from his HLA-haploidentical father (48 years old). Full donor chimerism was observed from day 28 onward, as confirmed by PCR for short tandem repeats (STR-PCR) analysis. Immunosuppressive therapies for prevention of GVHD were administered for nine months after allo-HSCT. For years the patient has been suffering from skin and liver chronic GVHD, with intermittent administration of tacrolimus.
Five years later, AML again became apparent in the patient. Immunophenotyping revealed the blasts were positive for CD34, CD13, CD33, HLA-DR, CD117 (dim) and CD64 (dim), and were negative for B-cell or T-cell markers. At the time of DCL onset, he had complete donor chimerism both in peripheral blood and bone marrow (Figure S1(A–C) and Supplemental Methods), as confirmed by quantitative real-time PCR that allowed measurement of microchimerism with a quantifiable limit lower than 0.001% [Citation10]. The BM specimen of DCL after 67 months of allo-HSCT (containing 10% myeloblasts, referred to as sample P1) as well as a buccal mucosal swab specimen obtained from the patient during CR (sample P2) were available. Paired mononuclear-cell-enriched BM (sample D1) and buccal mucosal swab (sample D2) samples from the donor were also available. To date, the donor remains in good general condition with normal CBC.
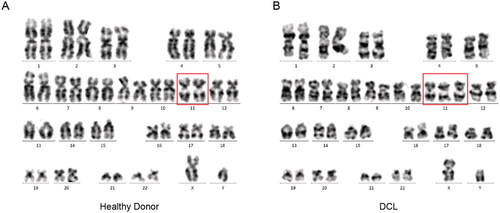
The karyotype analysis revealed 47, XY, +11 on P1 and 46, XY on D1 (). Leukemia-related translocations/chromosomal abnormalities (Table S1) were not detected in samples P1, P2, D1, and D2. Single-nucleotide variations and insertion–deletions were also performed in these four samples for 66 genes associated with hematological malignancies (Table S2). Unlike initial mutations identified in the patient’s leukemic cells prior to transplantation, no mutation in CEBPA and FLT3 genes was found in P1. Notably, a novel mutation in the IDH1 gene (NM_001282387.1: exon4: c.C355T: p.R119W) with a variant frequency of 6.62% was detected in P1.
Figure 1. A karyotype performed on the DCL BM revealed 47, XY, +11. (A) Analysis of 20 metaphases, no clonal structural and number abnormalities was found in the healthy donor. (B) Analysis of 20 metaphases, an acquired genetic chromosome 11 was found in the DCL.
Whole-genome sequencing reveals clonal evolution in DCL
To further confirm whether donor cells carried leukemia-associated mutations, whole-genome sequencing (WGS) was performed. D2 and P2 were used for germline mutation detection. The IDH1 gene mutation (NM_001282387.1: exon4: c.C355T: p.R119W) with a variant allele frequency (VAF) of 6.98% was also solely identified in DCL sample P1. CHIP is the manifestation of somatic mutations with a VAF of a least 0.02 in healthy persons without hematologic abnormalities [Citation11]. Therefore, we hypothesized that somatic alterations, which were found in the donor’s BM sample (D1) and expanded in the DCL sample (P1), might be CHIP-associated mutations. We identified six mutations across four genes (USP17L1, GLUD2, KIF4B and FLNA), which were CHIP-associated mutations more likely to favor leukemic transformation (). Finally, the healthy donor BM cells carrying CHIP-associated mutations expanded within the recipient microenvironment. They transformed malignantly by acquisition of 31 cooperating mutations involving 30 genes, which were de novo in DCL sample P1 (). The data of this study reinforced previous findings [Citation3,Citation12], indicating the pivotal role of genetic alterations in the clonal evolution associated with DCL after transplantation.
Table 1. Gene variants identified in the patient and donor specimens.
Single-cell sequencing reveals transcriptional and immunological features of DCL
To better characterize the pathogenesis of DCL, we further performed scRNA-seq in healthy donor BM cells (sample D1) and DCL cells (sample P1). Uniform manifold approximation and projection (UMAP) classified all sequenced single cells into 12 clusters based on canonical marker gene expression ( and Figure S2, and supplemental methods). Elevated frequencies of CD8+ T cells, naive B cells, and granulocyte-macrophage progenitor (GMP) cells, while decreased proportions of mature monocytes, neutrophils, and natural killer (NK) cells, were observed within the DCL sample compared with the healthy donor BM cells from which the DCL cells originated ().
Figure 2. Single-cell transcriptomic analyses revealed distinct features of DCL cells. (A) UMAP of 9847 BM cells from the healthy donor and 12,552 cells from the patient diagnosed with DCL. Cells are color-coded according to the subsets. (B) Stacked bar chart showing the fractions of cell type composition in healthy donor and DCL. The numbers representing respective cell types describe the same meaning in Figure (A). (C) UMAP showing the distribution of GMP-cell subsets in healthy donor and DCL. (D) Stacked bar chart showing the fractions of GMP-cell subsets in healthy donor and DCL. (E) UMAP plots showing the expression levels of three selected genes (LGALS1, S100A4 and CRIP1) in GMP cells. (F) Bubble chart showing enrichment of the indicated GO terms in GMP-like subset. Bubble color represents p-value; bubble size indicates the number of genes enriched in the indicated terms. (G) UMAP plots showing the expression levels of four selected genes (HLA-A, HLA-B, HLA-DRA and HLA-DRB1) in GMP cells.
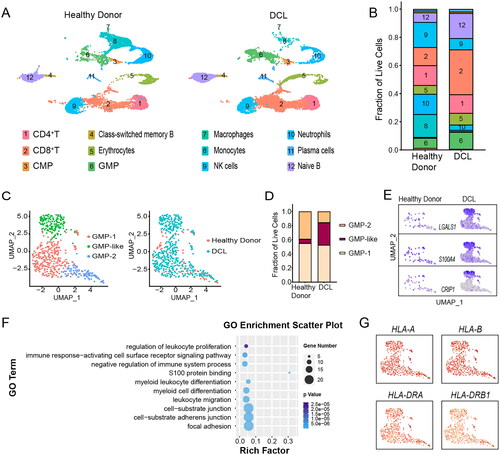
Considering the higher fraction of GMP cells in the DCL, we first profiled the GMP-cell landscape to delineate distinct phenotypic groups and identified three subpopulations (GMP-1, GMP-2 and GMP-like). We found that the proportion of GMP-like subclone increased significantly in DCL (). Importantly, GMP-like cells overexpressed the transcripts of several genes, including S100A4, LGALS1 and CRIP1 (). S100A4 was recently identified to be associated with myeloid leukemia [Citation13]. Although the precise functions of LGALS1 and CRIP1 in AML remain unknown, data from TCGA (https://portal.gdc.cancer.gov) suggest that AML patients overexpressing LGALS1 or CRIP1 genes have poor outcomes (Figure S3). Pathway analysis was further performed to reveal biological insights into the increased number of GMP-like cells in DCL. We found that GMP-like cells exhibited a distinct expression profile, with significantly higher expression of genes enriched in focal adhesion (e.g. AHANK, CD9 and VIM), myeloid differentiation (e.g. JUNB, SPI1 and CEBPA), regulation of cell proliferation (e.g. CDKN1A, CD74 and TGFB1), and negative regulation of immune system process (e.g. CD74, PTPN6, TGFB1 and NFKBIA) (). Moreover, no significant difference was observed in the expression levels of major histocompatibility complex (MHC) I/II class genes in GMP-like cells (), unlike the decreased expression of MHC in host cell-derived relapse after allo-HSCT.
T cells play a crucial role in posttransplantation leukemia immunosurveillance. Intriguingly, a significantly increased frequency of CD8+ T cells was observed in the DCL sample. Therefore, we examined the function of CD8+ T cells using scRNA-seq data. The CD8+ T cells were divided into three subsets: naive/central-memory cells (enriched for CCR7 gene expression), cytotoxic T lymphocytes (CTLs) (enriched for cytotoxic marker genes GZMB, GNLY and PRF1), and effector memory cells (enriched for GZMK gene expression) (). The DCL sample tended to have a slightly higher proportion of CTLs than the healthy donor sample D1 (). We next measured the cytotoxic scores of CTLs using the AddModuleScore function of the Seurat package [Citation8,Citation14] for curated genes associated with these cell states. As expected, the subcluster we defined as CTLs exhibited significantly higher cytotoxic scores than the other two CD8+ T cell clusters, which confirmed the usability of annotation of CD8+ subpopulations (Figure S4). However, CTLs in the DCL sample exhibited lower cytotoxic scores than those in donor cells (). Hence, these findings suggested that despite normal and even slightly increased frequency of CTLs in the patient’s BM microenvironment, CTLs had a lower cytotoxic function. This may favor leukemia’s clonal evolution of donor cells to evade immune control.
Figure 3. Single-cell transcriptomic analyses revealed immunological features of BM microenvironment. (A) UMAP shows the distribution of CD8+ T-cell subsets in healthy donor and DCL. (B) Heatmap showing the average expression levels of selected 14 T-cell marker genes in the indicated subsets. (C) Stacked bar chart showing the fractions of CD8+ T-cell subsets in healthy donor and DCL. (D) Module score for the cytotoxicity gene expression of CD8+ CTL. (E) UMAP showing the distribution of NK-cell subsets in healthy donor and DCL. (F) UMAP plots show the expression levels of two selected genes (KLRC2 and FCER1G) in NK cells. (G) Module scores of NK-1 and NK-2 according to standards for adaptive and canonical NK cells. (H) Stacked bar chart showing the fractions of NK-cell subsets in healthy donor and DCL. ****p < 0.0001.
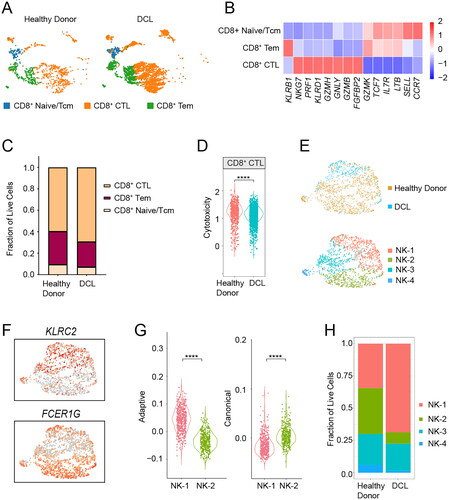
Moreover, we identified a decreased proportion of NK cells in the DCL sample. NK cells, which are cytotoxic innate lymphoid cells, can kill leukemic cells without any specific prior activation. In an allo-HSCT setting, donor-derived NK cells are the earliest reconstituted immune cells in the recipient. Therefore, we further projected NK cells into two dimensions via UMAP analysis, which revealed the clustering of NK cells into four different subsets: NK-1, NK-2, NK-3 and NK-4 (). NK-1 overexpressed KLRC2 and lowly expressed FCER1G, while NK-2 showed the opposite trend (). Previous studies have shown that adaptive NK cells mainly express the activating cell-surface receptor NKG2C (encoded by KLRC2) but lack the intracellular signaling adaptor FcϵRiγ (encoded by FCER1G) [Citation9]. To further examine functional features of the NK-cell subsets, we performed module score analysis to compare the adaptive and canonical gene signatures in the NK-cell subsets. The gene expression profile of NK-1 was consistent with that of the adaptive NK cells, while NK-2’s profile was consistent with that of the canonical NK cells (). NK-3 and NK-4 were NK-undefined cells that lacked the expression of canonical NK markers. NK cell subsets were differentially distributed between DCL and healthy donor cell samples. NK cells in the DCL sample (sample P1) mainly consisted of NK-1 (adaptive NK cells), and the proportion of NK-2 (canonical NK cells) decreased in sample P1 (). Thus, reduced number of canonical NK cells might be one of the mechanisms enacted by leukemia clonal evolution to evade immune control in the pathogenesis of DCL.
Discussion
Mechanisms involved in the pathogenesis of DCL remain unclear. Our findings suggest three essential aspects of DCL pathogenesis. After allo-HSCT, there are vigorous replicative requirements for transplanted donor cells. A rapid proliferative rate often correlates closely with a higher incidence of genomic instability [Citation15]. Consistent with a ‘multiple hit’ hypothesis in previous studies on DCL [Citation2], this study suggested that donor cells harboring CHIP-associated genetic alterations expanded and eventually transformed into full-blown AML via the acquisition of essential somatic mutations such as IDH1 [Citation16] and NSD1 [Citation17], thus contributing to the progression of AML.
Second, comparing paired donor BM and DCL samples using scRNA-seq, we observed that DCL transformation occurred in a broad spectrum of candidate genes with potential etiological roles in AML, such as CRIP1. Jiang et al. [Citation18] reported that the CD34+CD117dim blasts specifically overexpressed CRIP1, and differentiation trajectories showed that CD34+CD117dim cells were located in the earliest stage of differentiation. This current study showed that CRIP1 was also most highly expressed in the GMP-like subset of DCL, suggesting that the expression level of the CRIP1 gene might be involved in leukemia progression. We also observed GMP-like cells expanding in DCL with highly expressed signaling pathways which can contribute to advances in targeted treatments for DCL.
Finally, the donor-derived AMLs reported in previous studies appeared after a median latency period of 28 months [Citation2]. The much more extended period (more than five years) between allo-HSCT and DCL development observed in our patients implied that dysregulation of immune function led to immune evasion by donor-derived leukemia cells. Although donor-derived AML cells could not be recognized by donor-derived T cells, this study suggested that donor-derived CTL cells had a lower cytotoxic function, which may be induced by immunosuppressive therapies designed to mitigate GVHD. Interestingly, we found decreased canonical NK cells in the BM microenvironment of DCL, indicating that NK cells played a crucial role in post-transplantation leukemia immunosurveillance in DCL. NK cell infusion is efficacious in cancer immunotherapy. The results of this study suggest a possibility that donor canonical NK cell (FcϵRIγ+NKG2C-) infusion may be a therapeutic option for DCL.
However, this current report was based on a single case, limiting the findings’ generalizability. Another limitation is that it lacks analysis of samples at the initial diagnosis of leukemia before transplantation due to the long period between initial diagnosis and DCL onset. Therefore, further studies are required to validate these findings.
Authors’ contributions
Haowen Xiao designed the research study; Huiqiao Chen, Xiujie Zhao and Wenjue Pan performed the experiments and analyzed the data; Huiqiao Chen wrote the paper and Haowen Xiao revised the paper. All authors read and approved the final manuscript.
Disclosure statement
The authors declare no relevant conflict of interest.