Figures & data
Figure 1 Levels of condom use at last higher risk sex and HIV prevalence for Benin, Tanzania, Uganda and Zambia, 1994–2002
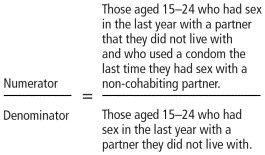
Table 1 Estimates of the UNGASS indicator from the most recent Demographic and Health Surveys: Benin, Tanzania, Uganda and Zambia
Figure 1 Levels of condom use at last higher risk sex and HIV prevalence for Benin, Tanzania, Uganda and Zambia, 1994–2002
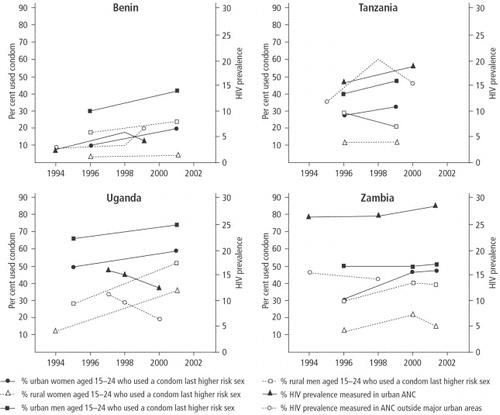
Figure 2 Stacked bar graph showing men and women aged 15–24 at different points in time, categorised by their reported sexual behaviour in the preceding yearCitation13Citation14Citation15Citation16Citation17Citation18Citation19Citation20Citation21
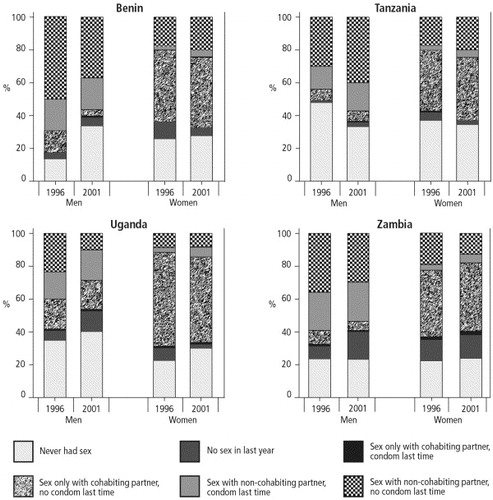
Figure 3 Trends in the size of the highest risk group and in the UNGASS indicator of condom use among men and women aged 15–24 in Benin, Tanzania, Uganda and ZambiaCitation13Citation14Citation15Citation16Citation17Citation18Citation19Citation20Citation21
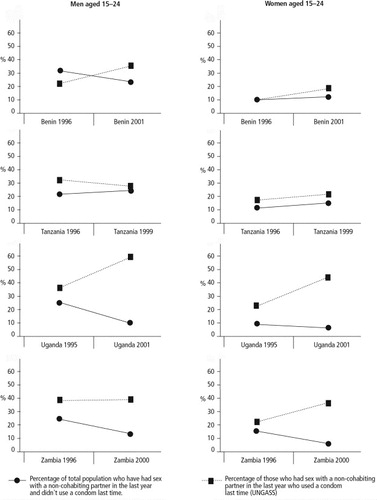
Figure 4 Trends in the levels of three indicators among young men and women in Zambia, by age group and sex, 1996–2002Citation15Citation16Citation17Citation22
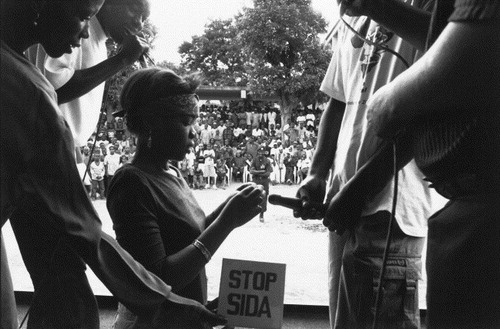
Condom use demonstration, school musical production, Maputo, Mozambique, 2002