Figures & data
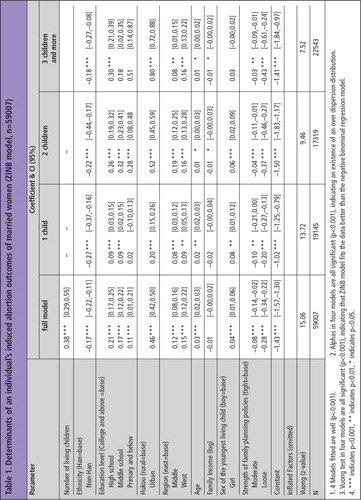
Figure 1 Trends in proportion of married women’s induced abortion (20–49 years) and total fertility rate (TFR) in China, 1970–2010.
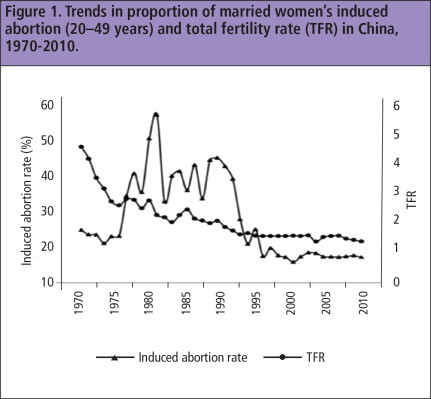
Table 1 Determinants of an individual’s induced abortion outcomes of married women (ZINB model, n = 59007) Notes: (1) 4 Models fitted are well (p < 0.001). (2) Alphas in four models are all significant (p < 0.001), indicating an existence of an over dispersion distribution. (3) Vuong test in four models are all significant (p < 0.001), indicating that ZINB model fits the data better than the negative binominal regression model. (4) *** indicates p < 0.001, ** indicates p < 0.01, * indicates p < 0.05.