Figures & data
Figure 1. World population: 1950–2100.Citation4

Figure 2. Global distribution of wealth.Citation14
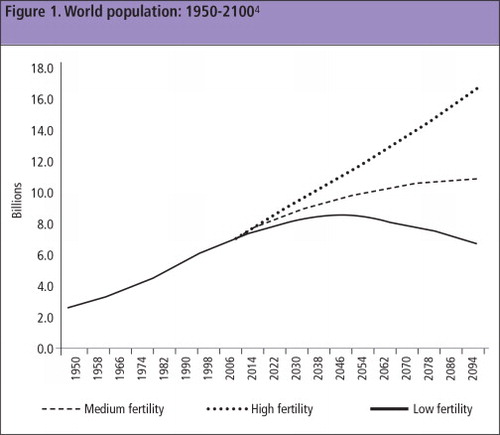
Figure 3. Global distribution of income.Citation15
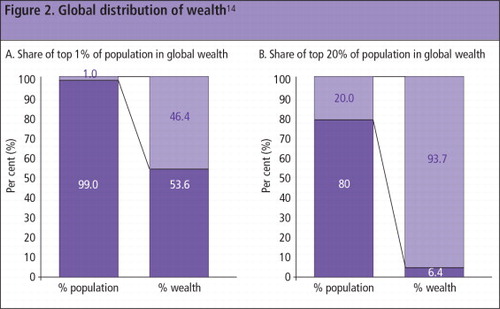
Figure 4. Energy use and CO2 emissions in developed and developing countries, percentage change, 1980–82 and 2010–12.Citation17
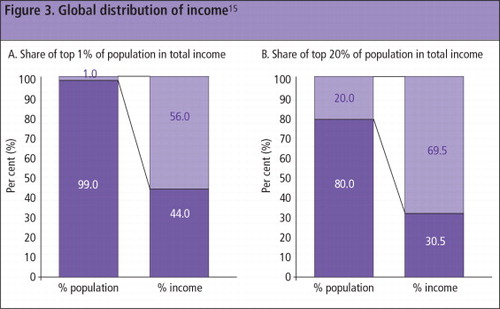
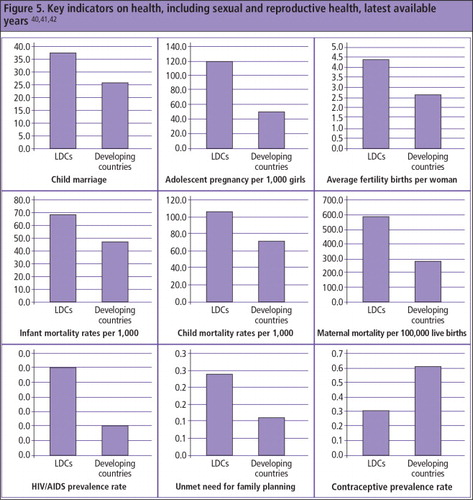
Figure 5. Key indicators on health, including sexual and reproductive health, latest available years.Citation40–42
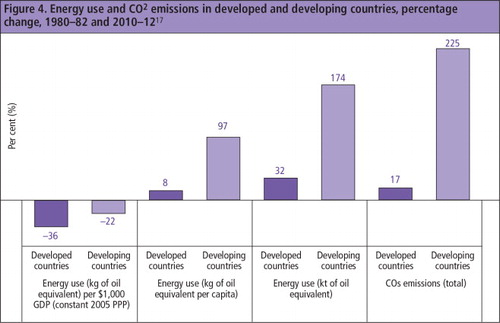
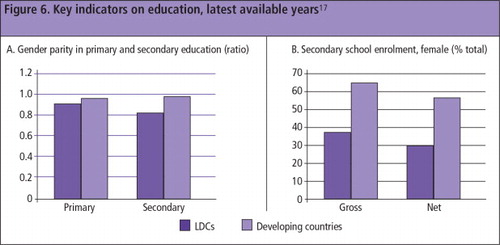
Figure 6. Key indicators on education, latest available yearsCitation17.
UN Environment programme, 5th session, Intergovernmental Negotiating Committee to prepare a global legally binding instrument on mercury, Geneva, January 2013