Figures & data
Figure 1 Captured gel image of Multiplex PCR genotyping assay for detection of GSTT1 and GSTM1 gene deletion using 2% agarose. The subjects were classified as either (+), when at least one specimen of the gene was detected, or (−) when they showed a null genotype. Examples; participant No.11 is GSTT1 (+) and GSTM1(−); participant No.12 is GSTT1(−) and GSTM1(−); and participant No.17 is GSTT1(−) and GSTM1(+).
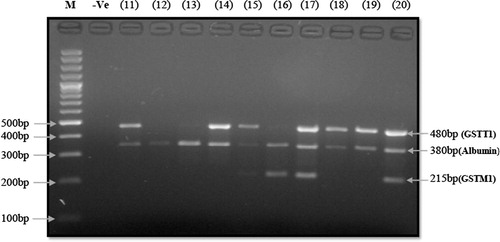
Table 1 Personal and occupational characteristics of workers with bronchial asthma and controls.
Table 2 Distribution of workers with bronchial asthma and controls according to exposure.
Table 3 Mean values and mean percent predicted values of post-bronchodilator (Post-BD) FEV1, FVC and FEV1/FVC in workers with bronchial asthma and controls.
Table 4 Eosinophil count and total serum IgE level among workers with bronchial asthma and controls.
Table 5 Eosinophil count and total serum IgE level in different bronchial asthma severity categories in workers with bronchial asthma.
Table 6 Association between genotype profile and bronchial asthma phenotype.
Table 7a Association between GSTM1 genotype profile and bronchial asthma phenotype among exposed workers with bronchial asthma and exposed controls.
Table 7b Association between GSTM1 genotype profile and bronchial asthma phenotype among non-exposed workers with bronchial asthma and non-exposed controls.
Table 8a Association between GSTT1 genotype profile and bronchial asthma phenotype among exposed workers with bronchial asthma and exposed controls.
Table 8b Association between GSTM1 genotype profile and bronchial asthma phenotype among non-exposed workers with bronchial asthma and non-exposed controls.
Table 9 Association between combined GSTM1/T1 Null-genotype and bronchial asthma phenotype.
Figure 2 Correlation between total serum IgE level and pre-bronchodilator FEV1/FVC% among workers with bronchial asthma.
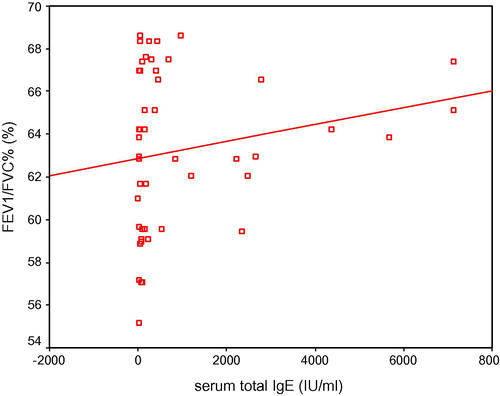
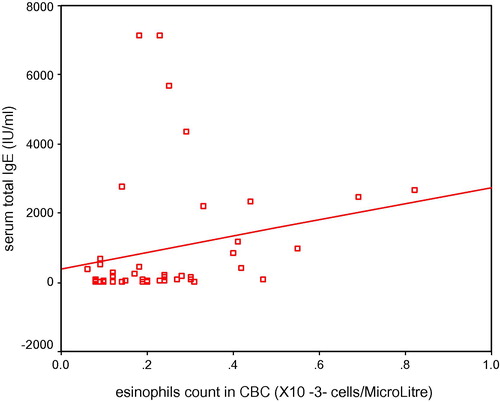
Figure 3 Correlation between eosinophil count and total serum IgE level among workers with bronchial asthma.