293
Views
0
CrossRef citations to date
0
Altmetric
Research Articles

Cytoplasmic nucleophosmin (cNPM) in acute myeloid leukaemia: Relation to disease characteristicsFootnoteFootnote

, &
Pages 225-235 | Received 03 Jul 2011, Accepted 23 Jul 2011, Published online: 17 May 2019

Figures & data

Table 1 The correlation between the AML subtype and cytoplasmic expression of NPM (cNPM).
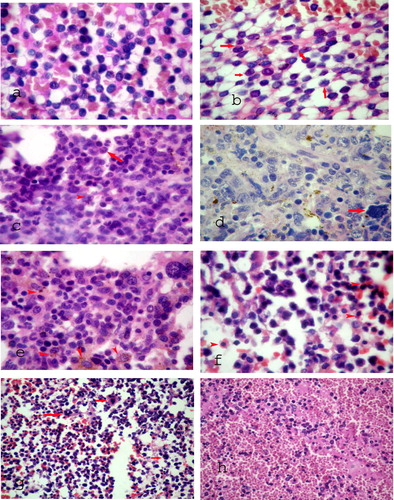
Figure 1 H&E stain: (a) M0 acute myeloid leukaemia. ×1000. (b) M1, note thumbprinting (arrows). ×1000. (c) M2 prominent promyelocytes (arrow) having abundant cytoplasm with variable size, markedly lobulated and invaginated nuclei. Note abnormal mitosis (arrow head). ×1000. (d) M4 note giant multilobulated nuclei (arrow) with the prominent nucleoli. ×1000. (e) M5 with evident hemophagocytosis (arrow heads). ×1000. (f) M6 with erythroblastic differentiation and nucleated RBC (arrow heads). ×1000. (g) M7 with megakaryocytes (arrows). ×400. (h) Biphenotypic acute leukaemia (BAL), mixture of small and large blasts. ×400.
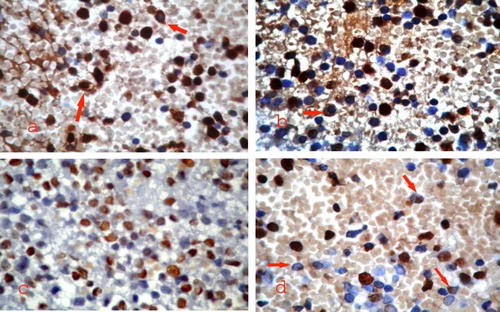
Figure 2 Patterns of NPM immunostaining in AML: (a) nuclear and cytoplasmic (arrows) positivity of leukemic cells. ×1000. (b) Nuclear and cytoplasmic positivity with some leukemic cells showing only cytoplasmic staining (arrow). ×1000. (c) Nucleus restricted immunostaining majority of leukemic cells. ×1000. (d) Strong nuclear and nucleolar (arrows) positivity in leukaemic cells. ×1000.
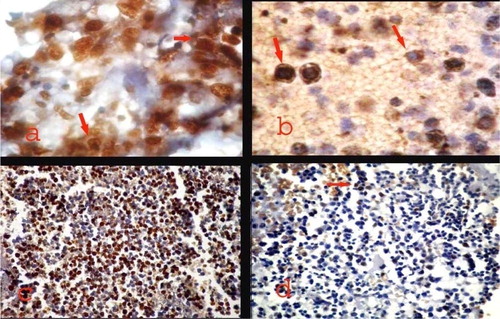
Figure 3 NPM immunostaining in acute myeloid leukaemia: (a) M5 showing nuclear and cytoplasmic reactivity (arrows). ×1000. (b) M4 showing distinct but heterogeneous nuclear and cytoplasmic staining (arrows). ×1000. (c) BAL showing strong homogeneous nucleus restricted immunostaining. ×400. (d) M6 showing focal nucleus restricted immunostaining (arrow) with absent cytoplasmic staining. ×400.

Table 2 Relation between FLT3 positivity and cytoplasmic NPM expression.
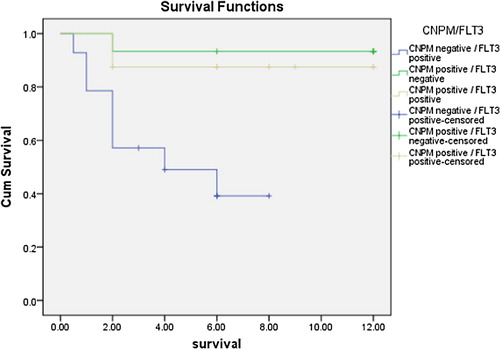
Figure 4 Survival of the study groups according to cytoplasmic NPM expression.
Figure 5 Hazard function of the study groups according to cytoplasmic NPM expression.
Figure 6 Survival function according to cNPM expression with FLT3 mutational status.
Figure 7 Survival function according to cNPM expression with FLT3 mutational status after exclusion NPMc−/FLT3 negative cases in which no deaths have occurred during the study time.

Table 3 Outcome of the first induction cycle.

Table 4 Outcome of the second induction cycle.