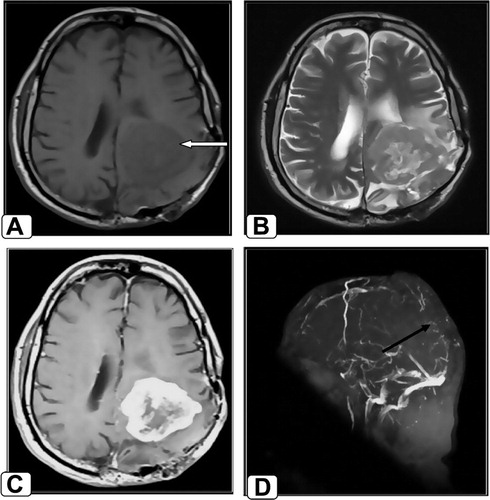
Figure 1 Follow-up of 56-year-old male patient with history of recurrent meningioma after surgery. MRI shows an abnormal signal intensity space occupying lesion (SOL) at the left parietal region (white arrow), surrounded by perifocal edema and exerting mass effect in the form of compression upon the left lateral ventricle. The tumor displays low signal intensity at axial T1WI (A), heterogeneous signal intensity at T2WI (B) with central area of breakdown displaying high signal intensity. Axial post contrast T1WI (C) shows intense enhancement of the tumor sparing the central area of breakdown. Sagittal MRV MIP (D) shows no flow signal at the posterior 2/3 of SSS (black arrow) denoting its compression by the tumor.
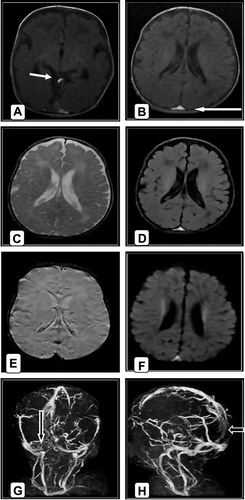
Figure 2 Female patient aged 40 days old complaint of convulsion, (A and B) axial T1WI shows hyper intense thrombus of both veins of Galen and SSS (white arrows) with no parenchymal changes. (C and D) Axial T2 and FLAIR the thrombus appears hyper intense. (E) Axial SWI shows hypo intense thrombus of SSS with blooming of the sinus. (F) Axial DWI the thrombus appears hyper intense. (G and H) Coronal and sagittal MRV MIP show no flow signal in RT transverse sinus and posterior aspect of SSS (black arrows) proved their occlusion.
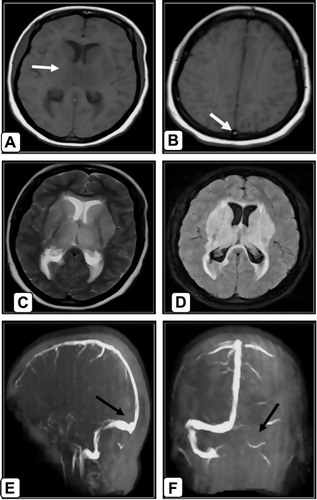
Figure 3 42-year-postpartum female patient complaint of headache, disturbed level of consciousness and coma. (A and B) axial T1WI shows slightly hypo intense area of infarction of bilateral thalami and basal ganglia and hyper intense thrombus in torcular herophili (white arrows). (C) Axial T2WI shows the hyper intense area of infarction of bilateral thalami and basal ganglia but the thrombus appears hypo intense. (D) In axial FLAIR the infarction is hyper intense. (E and F) Sagittal and coronal MRV MIP show no flow in LT transverse, LT sigmoid and straight sinuses with all deep veins and torcular herophili (black arrows) denoting their occlusion.
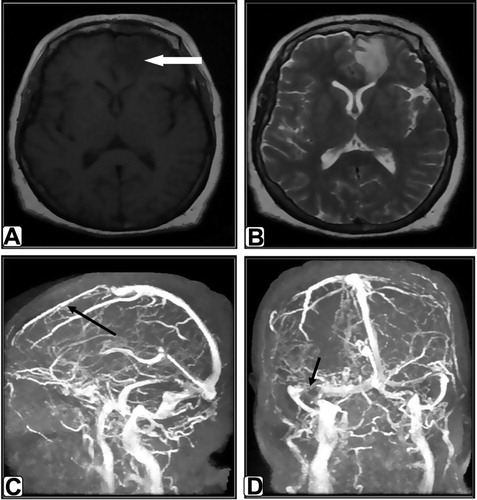
Figure 4 Female patient aged 57-year-old complaint of headache. (A) T1WI shows faint hypo intense area of infarction at the LT frontal lobe (white arrow). (B) T2WI shows LT frontal hyper intense area of infarction without apparent thrombus. (C and D) Sagittal and coronal MRV MIP show no flow in anterior 1/3 of SSS with collaterals formation and distal portion of RT transverse sinus (black arrows) proved their occlusion. Also incidentally noted attenuated LT transverse sinus denoting its hypo plastic nature rather than thrombosis.
Table 1 Distribution of patients according to age and sex.