359
Views
2
CrossRef citations to date
0
Altmetric
Research Articles

VEGF expression and microvascular density in relation to high-risk-HPV infection in cervical carcinoma – An immunohistochemical studyFootnoteFootnote

, &
Pages 47-57 | Received 01 Nov 2011, Accepted 20 Dec 2011, Published online: 17 May 2019

Figures & data

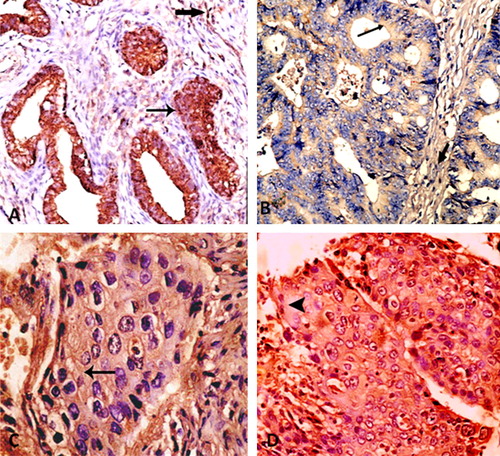
Figure 1 VEGF immunostaining. (A) Grade II adenocarcinoma showing strong cytoplasmic VEGF immunostaining in both neoplastic epithelial (thin arrow) and stromal cells (thick arrow). (B) Grade II adenocarcinoma showing moderate cytoplasmic VEGF immunostaining ((A and B) anti-VEGF, 200×). (C) Grade III squamous cell carcinoma showing moderate cytoplasmic VEGF immunostaining in epithelial cells. (D) Grade III squamous cell carcinoma showing heterogeneous cytoplasmic VEGF immunostaining with weak staining in areas (arrow head) and strong intensity in others ((C and D) anti-VEGF, 400×).

Table 1 Relation between VEGF intensity and histologic subtypes of cervical carcinoma.

Table 2 Relation between VEGF staining density and histologic subtypes of cervical carcinoma.

Table 3 Relation between VEGF staining intensity and cervical carcinoma grade.

Table 4 Relation between VEGF staining density and cervical carcinoma grade.
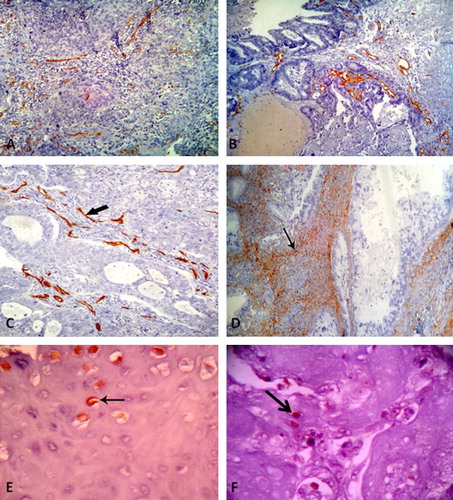
Figure 2 Assessment of MVD using CD34 antibody and HPV antigen immune expression. (A) Grade IV squamous cell carcinoma, (B) grade II adenocarcinoma, (C) adenosquamous carcinoma, (A–C) showing CD34 positive-tumor blood vessels, (D) grade I adenocarcinoma showing positive CD34 staining of individual endothelial cells forming no visible lumen (arrow). ((A–D) anti-CD34, 200×). (E) Grade II squamous cell carcinoma showing strong positive nuclear HPV immunostaining (arrow). (F) Grade II adenocarcinoma showing strong positive nuclear HPV immunostaining (arrow). ((E and F) anti-HPV, 400×).

Table 5 Relation between HPV expression and cervical carcinoma grade.

Table 6 Relation between VEGF intensity and MVD.

Table 7 Relation between VEGF density and MVD.

Table 8 Relation between HPV expression and VEGF intensity.

Table 9 Relation between HPV expression and VEGF density.

Table 10 Logistic regression analysis.

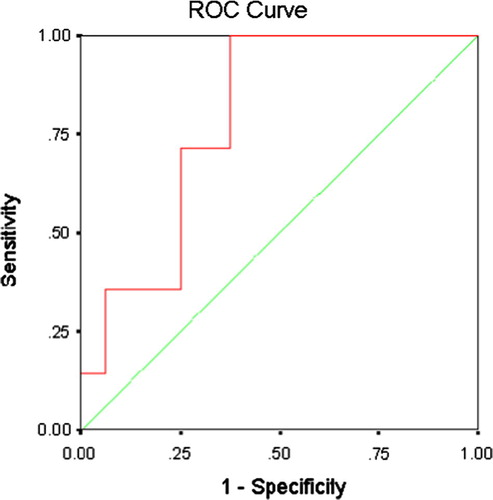
Figure 3 ROC curve for accuracy of MVD to predict grade of cervical carcinoma.