Figures & data
Table 1 Levels of plasma DNA (ng/μl) in cancer, benign, and control groups and in cancer subgroups.
Figure 1 ROC curve for discrimination between (a) cancer and control, and (b) cancer and benign groups.
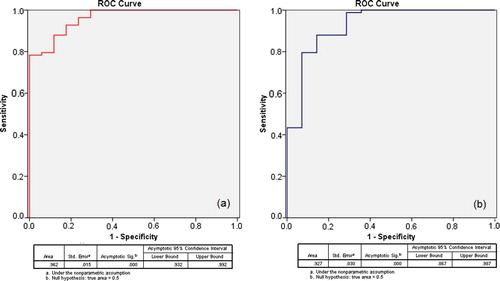
Figure 2 ROC curve for discrimination between various cancer subgroups and control (solid line) and benign (dotted line) groups.
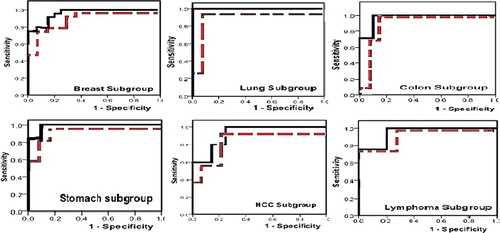
Table 2 ROC curve values for CFDNA versus control and benign groups, showing area under each curve different, significance, cutoff values of plasma dna with their sensitivity, specificity, positive predictive value, and negative predictive value.
Figure 3 Electrophoresis for PCR products of two control subjects (lanes 1–3), two cancer patients (lanes 4 and 5) and negative control (lane 2).
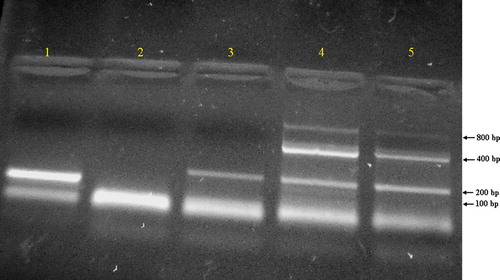
Figure 4 Electrophoresis for PCR products of two cancer patients.
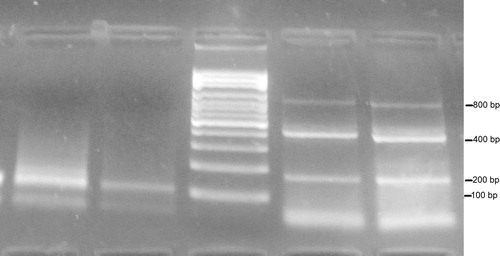
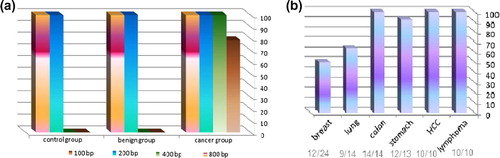
Figure 5 (a) Percent of cases with 100, 200, 400 and 800 bp in cancer, benign and control groups; (b) percent of cases with 800 bp in all cancer subgroups.