Figures & data
Table 1 Scores for the development of the three postmortem changes (rigidity, hypostasis and corneal turbidity).Citation10
Table 2 Distribution of autopsy cases according to different ranges of postmortem interval (PMI) (n = 70).
Table 3 Relation between different scores of hypostasis and PMI (n = 70).
Table 4 Relation between different scores of rigidity and PMI (n = 70).
Table 5 Relation between different scores of corneal turbidity and PMI (n = 70).
Table 6 Correlation between PMI and scores of postmortem rigidity, hypostasis and corneal turbidity.
Table 7 Relation between K+ concentration in VH and PMI (n = 70).
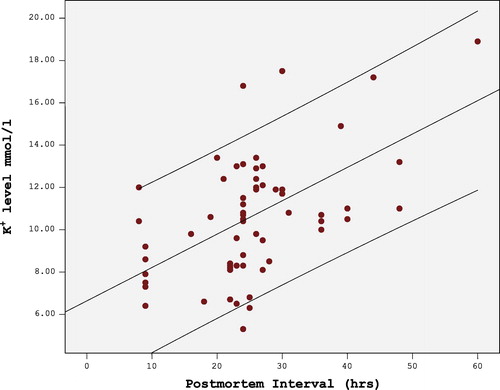
Table 8 Relation between Hx concentration in VH and PMI (n = 70).
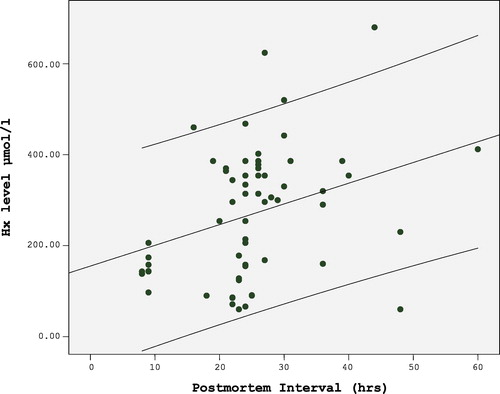
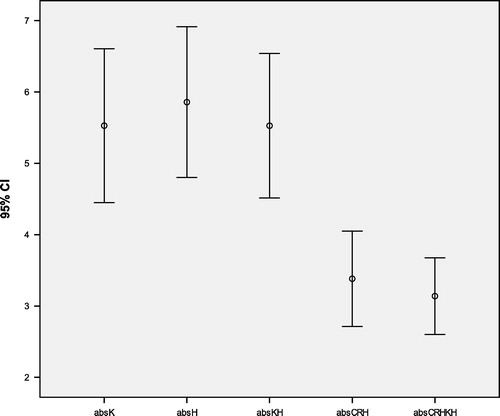
Table 9 Regression equations obtained for prediction of PMI.
Table 10 Regression equations obtained for prediction of PMI with their adjusted R2 values and percent of shrinkage.