305
Views
1
CrossRef citations to date
0
Altmetric
Research Articles

Prognostic value of FOXP3 and TGF-β expression in both peripheral blood and lymph nodes in patients with B-Non Hodgkin’s lymphomaFootnoteFootnote

, , , , &
Pages 253-265 | Received 15 Jan 2013, Accepted 29 Jul 2013, Published online: 17 May 2019

Figures & data

Table 1 Clinico-pathological characteristics of B-NHL patients.

Table 2 Statistical comparison of hemoglobin, liver and kidney function tests in B-NHL patients before and after CHOP chemotherapy.

Figure 1 Diagrammatic illustration of serum LDH results (Units/L) of B-NHL patients before and after CHOP chemotherapy.

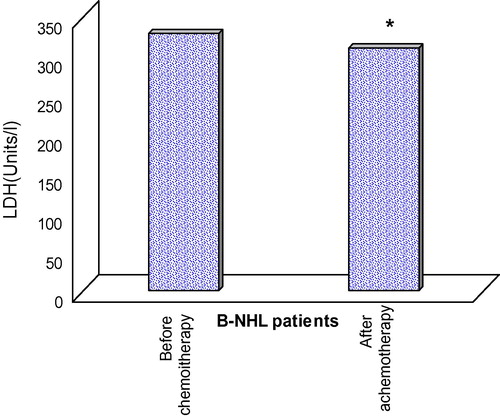
Table 3 TGF-β spontaneous release (pg/ml) by PBMCs.

Figure 2 Diagrammatic representation of PHA induced TGF-β results (pg/ml).

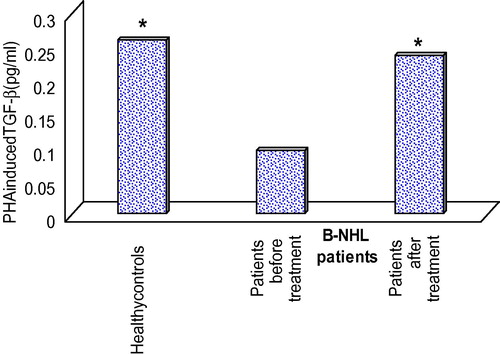
Table 4 Statistical analysis of the results of PHA induced TGF-β release (pg/ml) by PBMCs of healthy controls as compared to B-NHL patient either before or after CHOP treatment.

Figure 3 Diagrammatic representation of basal TGF-β spontaneous release (pg/ml).
Figure 4 PCR product analysis on agarose gel electrophoresis (2%). Lane (1) DNA ladder (50 bp), Lanes (2 and 3) β actin gene, Lanes (4–7): TGF-β from a L.N extract, PBMCs of a B-NHL patients after chemotherapy, a patient before chemotherapy and a healthy donor.

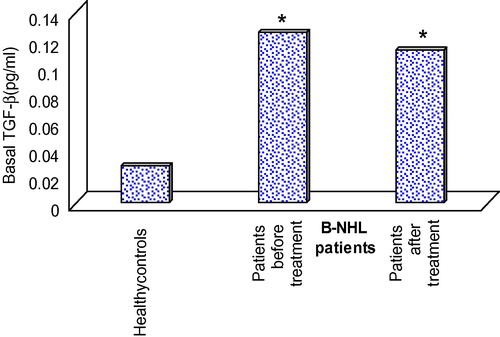
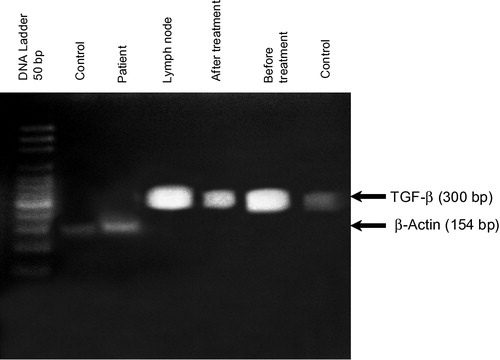
Table 5 mRNA expressionof TGF-β (relative index) in PBMCs from B-NHL patients.

Figure 5 Diagrammatic representation of the results of PBMC mRNA expression of TGF-β (relative index).

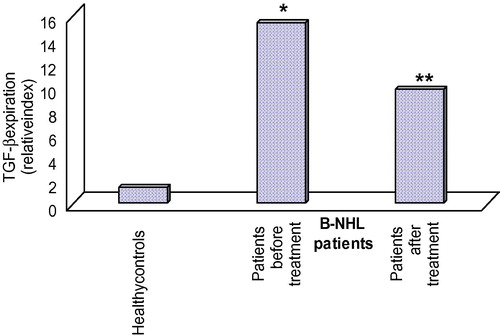
Table 6 Statistical comparison of CD4+, CD25+ and CD4+/CD25+ double positive cells amonghealthy donors as compared to B-NHL patients before and after CHOP treatment.

Figure 6 Flow cytometric dot plots showing two colour histogram (FSC-H/SSC-H) of PBLs from B-NHL patients.

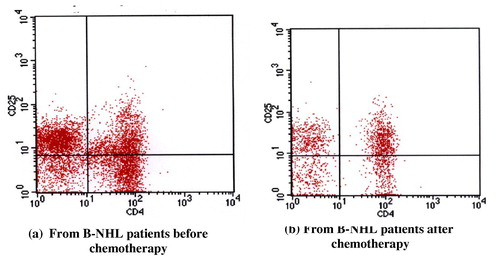
Table 7 Statistical comparison between the expression of Foxp3 (relative index) in RNA extracts of PBMCs from B-NHL patients (either before or after treatment) as compared to their corresponding healthy controls.

Table 8 Statistical analysis of intratumoral mRNA expression of Foxp3 and TGF-β (relative index) distributed according to patient‘s age, sex, gender and serum LDH level.

Figure 7 Kaplan Mayer curve for over all survival of B-NHL.
Figure 8 Kaplan Mayer curve for progression free survival.

Table 9 Distribution of the studied patients regarding the outcome.

Table 10 Overall survival of B-NHL patients all over the period of follow up.

Table 11 Progression free survival of the studied patients all over the period of follow up.

Table 12 Relation between response and over all survive in relation to both Foxp3 and TGF-β.

Table 13 Correlation study of different parameters.