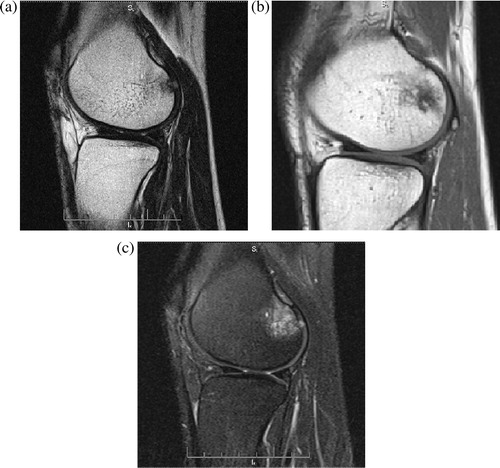
Figure 1 Sagittal T2 (a), sagittal T1 (b) and sagittal PDFS (c) demonstrated edematous changes noted at chondral and subchondral portion of the posterior aspect of lateral femoral condyle with a related small fabella, no chondral defects seen. Features are suggestive of fabella syndrome.
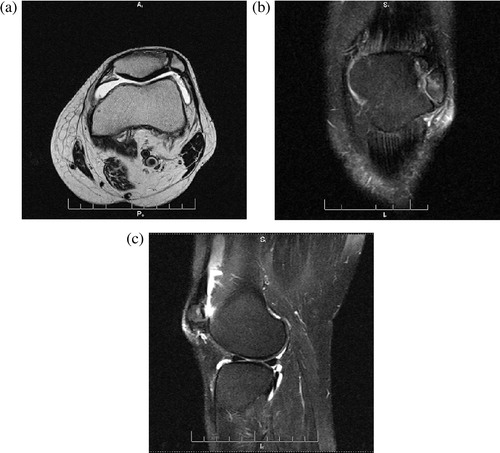
Figure 2 Axial T2 (a), coronal PDFS (b) and sagittal PDFS (c) demonstrated bipartite patella type III with marrow edema within the bipartite fragment with thinning and irregularity of the intervening cartilage, reflecting symptomatic bipartite patella. Mild joint effusion is also seen.
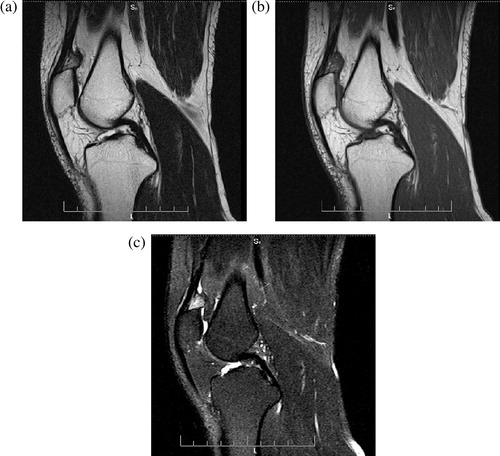
Figure 3 Sagittal T2 (a), sagittal T1(b) and sagittal PDFS (c) demonstrated suprapatellar pad of fat impingement syndrome manifested as low T1 and intermediate T2 signal at the small supra-patellar pad of fat with high signal on the PDFS sequences while the infra-patellar pad of fat and the subcutaneous fat showed drop of signal. The overlying quadriceps tendons as well as the patella were unremarkable.
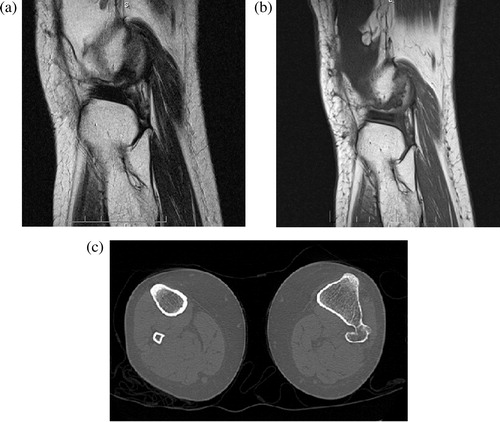
Figure 4 Sagittal T2 (a) and sagittal T1 (b) demonstrated bony communication noted partially at proximal tibiofibular articulation and also involve the upper shafts of the fibula and tibia with relative deformity of the fibular head reflecting synostosis which was clearly evident on complementary CT (c). The signal was that of marrow without signal alteration noted or effusion within the proximal tibiofibular joint.
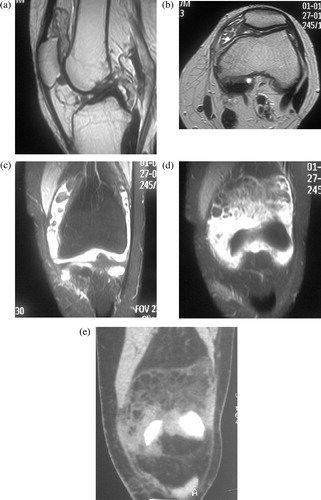
Figure 5 Sagittal T1 (a) and axial T2 (b) demonstrated villous like synovial lesions protruding into the supra-patellar bursa that is distended by effusion. These lesions express fat signal intensity that dropped on T2 fat suppressed coronal images (c and d). CT (e) proved the fatty nature of the lesion.
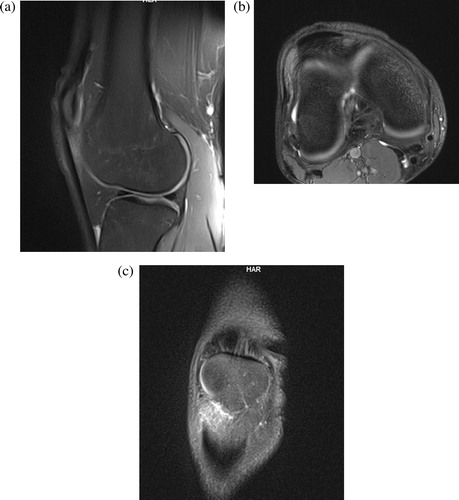
Figure 6 Sagittal PDFS (a) axial PDFS (b) and coronal PDFS demonstrated focal high signal denoting edema at the superior lateral portion of the Hoffa‘s pad of fat matching with superior lateral pad of fat impingement syndrome.