Figures & data
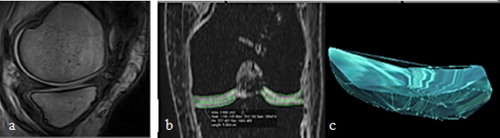
Figure 1 Cartilage volume quantification framework. (a) sagittal WS-bSSFP sequence with optimal contrast. Cartilage is visible as a light gray or white band between the dark subchondral endplate and the gray joint fluid. (b) The outlines of the knee cartilage plates. (c) 3D geometric model of the medial tibial cartilage plate.