Figures & data
Table 1 Distribution of the studied cases according to demographic data (n = 30).
Table 2 Distribution of the measured ADC values in the selected white matter areas.
Table 3 Correlation between age and the measured ADC values.
Figure 1 Correlation between age (by months) and ADC value in middle cerebellar peduncle. The restriction appeared at age of 3 months with significant decrease in the ADC values with progression of the age (p = 0.001).
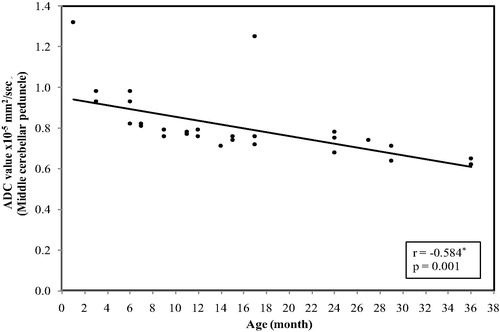
Figure 2 Correlation between age (by months) and ADC value in dorsal brain stem. The restriction was present at age of 1 month with a significant decrease in the ADC values with progression of the age (p < 0.001).
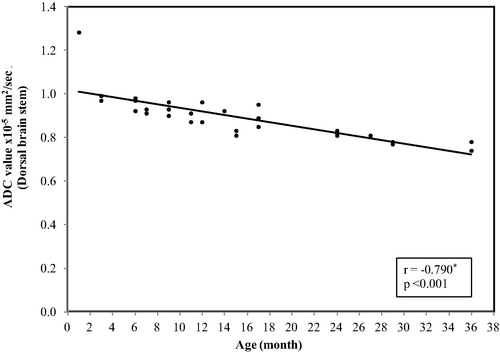
Figure 3 Correlation between age and ADC value in ventral brain stem. The restriction appeared at age of 6 months in some of the cases and at the age of 7 months in other cases with a significant decrease in the ADC values with progression of the age (p < 0.001).
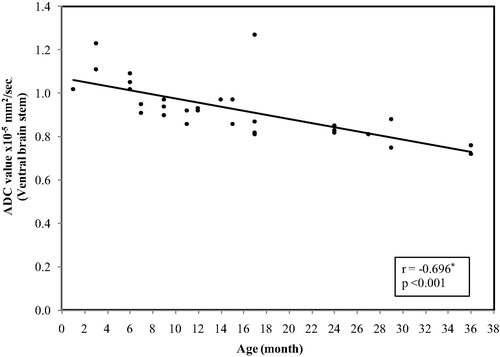
Figure 4 Correlation between age and ADC value in genu of the corpus callosum. The restriction appeared at age of 9 months with a significant decrease in the ADC values with progression of the age (p < 0.001).
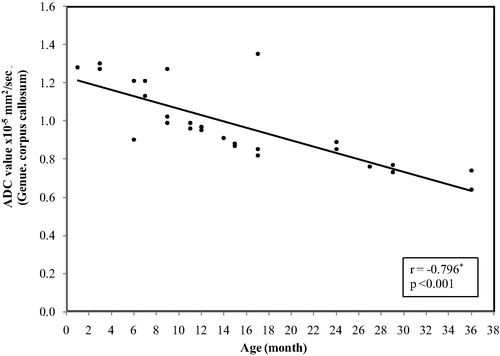
Figure 5 Correlation between age and ADC value in splenium of the corpus callosum. The restriction appeared at age of 3 months with a significant decrease in the ADC values with increase the age (p = 0.009).
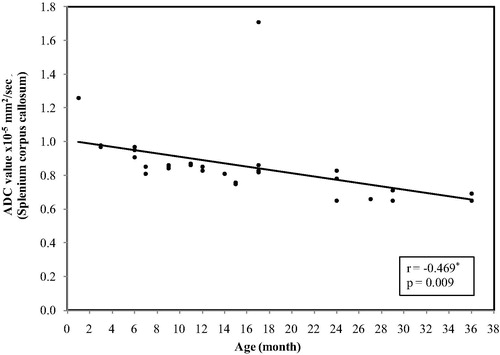
Figure 6 Correlation between age and ADC value in anterior limb internal capsule .The restriction appeared at age of a significant decrease in the ADC values with increase the age (p < 0.001).
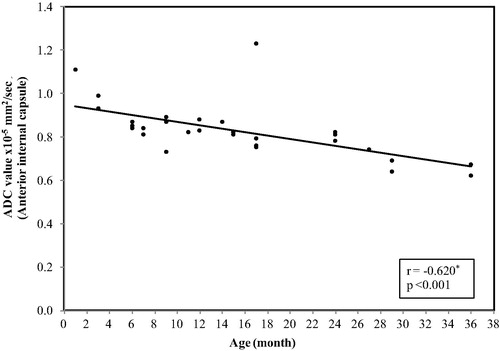
Figure 7 Correlation between age (by months) and ADC value in posterior limb internal capsule. The restriction was present at age of 1 month with a significant decrease in the ADC value with increase the age (p < 0.001).
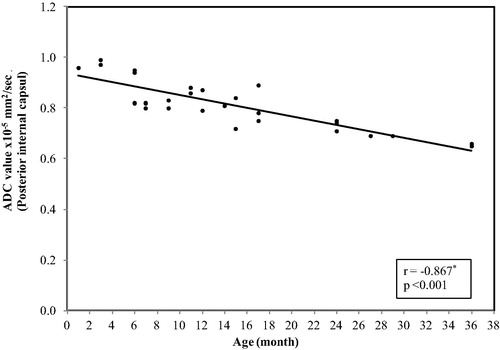
Figure 8 Correlation between age and ADC value in corona radiate. The restriction was present at age of 1 month with a significant decrease in the ADC values with increase the age (p < 0.001).
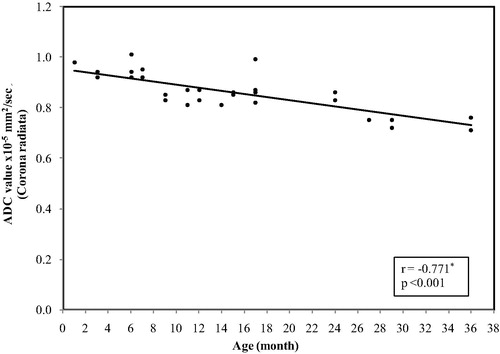
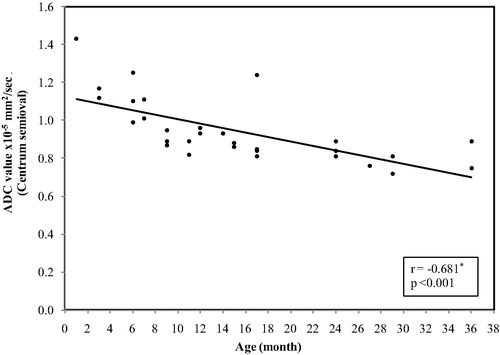
Figure 9 Correlation between age (by months) and ADC value in centrum semiovale .The restriction appeared at age ranging between 6 and 9 significant with a decrease in the ADC values with increase the age (p < 0.001).