415
Views
6
CrossRef citations to date
0
Altmetric
Research Articles

Detection of occult hepatitis B virus among chronic hepatitis C patientsFootnoteFootnote

, , , &
Pages 115-123 | Received 29 Nov 2014, Accepted 18 Jun 2015, Published online: 17 May 2019

Figures & data

Figure 3 Dissociation curve of c gene.

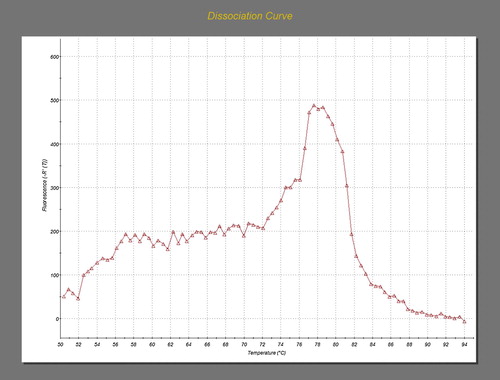
Table 1 Correlation between HCV RNA viral load, with abnormal liver functions among the 100 anti-HCV positive cases:

Figure 1 Gel electrophoresis of nested PCR product. Lane (1): DNA ladder – 100 bp. Lane (2): positive control. Lane (3, 4): positive samples. Lane (5, 6, 7): negative samples.

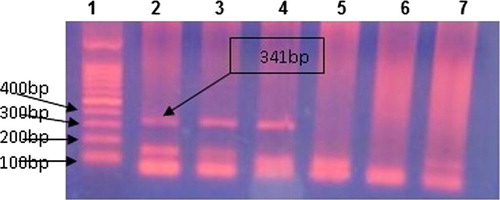
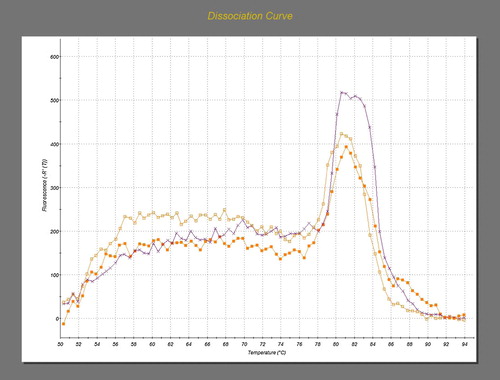
Figure 2 Dissociation curve of s gene.

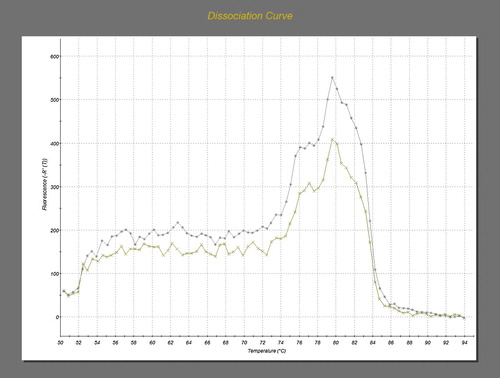
Figure 4 Dissociation curve of x gene.

Table 2 Distribution of S, X, C and pol genes profile and liver enzymes among the 100 HCV positive patients.

Table 3 Distribution of liver function tests and anti-HBc among the 18 OBI patients.