Figures & data
Figure 1 FT-IR spectral features of the extract A. crassna stem bark depict the major chemical groups as the functional components of the bioactive phytoconstituents.
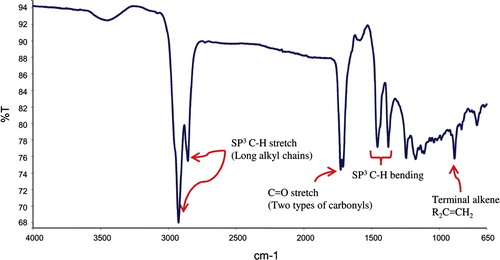
Figure 2 Gas chormatographic analysis of the essential oils of Aquilaria crassna on chromatogram of GC–MS. The pie charts depict the relative chemical compositions of sub-fractions. The details of the peaks are given in the .
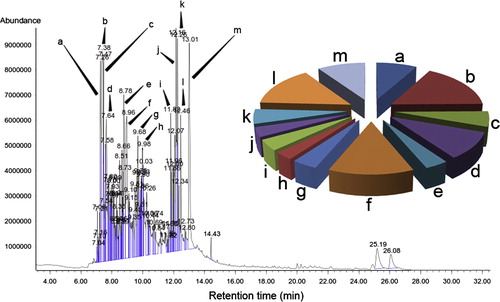
Table 1 GC–MS quantitative estimation of essential oils phytochemicals.
Figure 3 Effect of essential oils on cellular morphology of human pancreatic cancer. Photomicrographic images of pancreatic cancer cell lines were taken under an inverted phase-contrast microscope at 200× magnification using a digital camera at 48 h after treatment with essential oils. (A) Cells treated with vehicle (0.1% DMSO). The cells treated with 0.1% DMSO (Vehicle) revealed an aggressive proliferation. (B) Cells treated with essential oils at 6.25 μg/ml. clear inhibition at sub-toxic dose. (C) Cell treated with essential oils at 12.5 μg/ml. (D) Cell treated with essential oils at 25 μg/ml. (E) Cell treated with essential oils at 50 μg/ml. (F) Cell treated with standard drug, 5-fluorouracil at 10 μg/ml. (G) Dose-dependent anti-proliferative effect of essential oils and 5-fluorouracil on pancreatic cancer cell line was assessed by MTT-assay (values are represented as mean ± SD, n = 3).

Figure 4 (A) Anti-migratory effect of essential oils against pancreatic cancer cell line. Interestingly, the extract displayed pronounced effect even at its subtoxic concentration (5 μg/ml), the essential oils caused dislodgement of monolayer of MIA PaCa-2cells, which can be visualized under microscope. The photomicrograph., taken under an inverted phase-contrast microscope at 200× magnification using a digital camera at 12 and 14 h after treatment with essential oils. (B) Graphical representation of the time and dose and time-dependent inhibitory effect essential oils on migration of MIA PaCa-2cells (Values are in mean ± SD, n = 6, ∗ = P < 0.1, ∗∗ = P < 0.005).
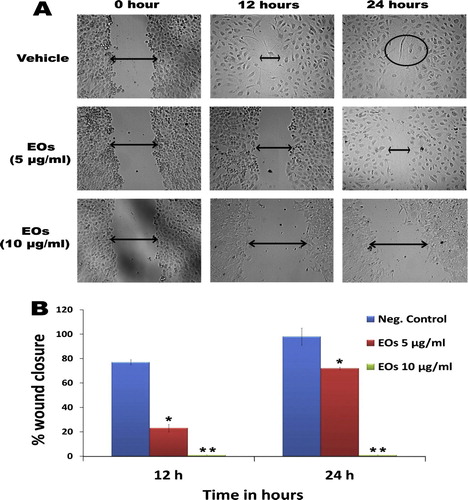
Figure 5 (A) Effect of essential oils on survival of MIA PaCa-2cells colonies in colony formation assay. The picture clearly depicts the strong anti-clonogenic effect of essential oils on colonies of the cancer cells. (B) The graphical representation illustrates the percentage of plating efficiencies after the treatment of the cells with essential oils at 5, 10 and 20 μg/ml in comparison with negative control and the standard reference drug, 5-flourouracil. The results were presented as mean ± SD, n = 3 (∗ = p < 0.05, ∗∗ = p < 0.01).
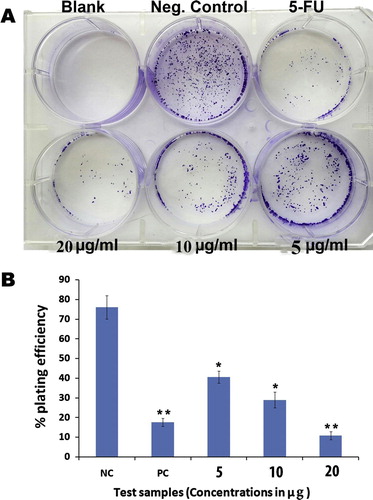
Figure 6 The photomicrographs depict the images of MIA PaCa-2cells with Hoechst 33258 stain, under an inverted phase-contrast microscope at 200× magnification using a digital camera at 6 and 12 h after treatment with essential oils. (A) The cells treated with 0.1% DMSO (Vehicle) revealed an intact cell membrane with prompt and evenly distributed nucleus in cytosol. (B) Cells treated with 10 μg/ml of essential oils after 6 h. The cells displayed early stage apoptotic such as membrane blebbing and chromatin condensation. (C) Cells treated with 10 μg/ml of essential oils after 12 h. The arrows indicate the late staged apoptotic, signs such as of nuclear dissolution including crescent shaped apoptotic nuclei. (D) Cells treated with standard reference, 5-flourouracil (10 μg/ml) also displayed significant induction of apoptosis in the cells. (E) Graphical representation of percentage of apoptotic indices MIA PaCa-2cells. The apoptotic index was expressed as a percentage of the ratio of number of apoptotic cells to the total number of cell in 10 different microscopic fields. Values are presented as mean ± SD (n = 10), ∗ represents p < 0.05 and ∗∗ represents p < 0.01.
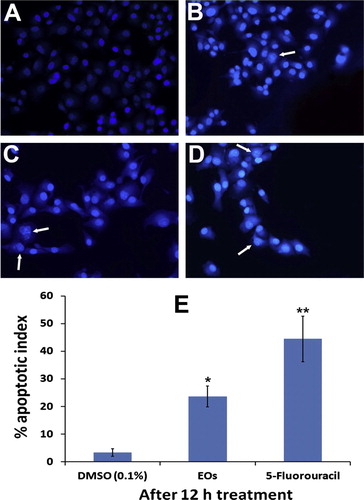
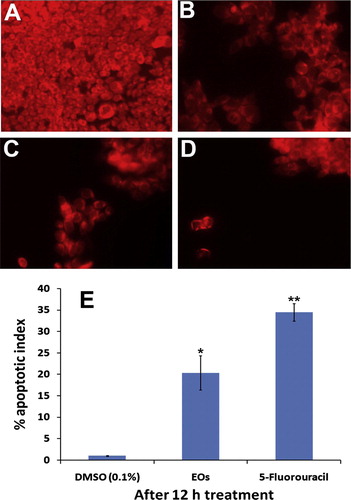
Figure 7 The photomicrographs depict the images of HCT 116 cells with Rhodamin 123 stain, taken under an inverted phase-contrast microscope at 200× magnification using a digital camera at 6 and 12 h after treatment with essential oils. (A) Cells treated with vehicle (0.1% DMSO). (B) Cells treated with essential oils 10 μg/ml after 6 h. (C) Cells treated with essential oils 10 μg/ml after 12 h. (D) Cells treated with standard reference, 5-flourouracil. (E) Graphical representation of percentage of apoptotic indices. The apoptotic index was expressed as a percentage of the ratio of number of unstained cells to the total number of cell in 10 different microscopic fields. Values are presented as mean ± SD (n = 10), ∗ represents p < 0.05 and ∗∗ represents p < 0.01.