Figures & data
Table 1 Serum parameters and AGEs IHC expression in the six studied groups. Values are presented as mean ± S.E. Bold cells denote statistically significant differences. §Derived from Mann–Whitney–Wilcoxon test for independent samples (level of statistical significance: 0.007, due to the Bonferroni correction); †derived from Kruskal–Wallis test (level of statistical significance: 0.05).
Figure 1 Effect of HA-diet and androgen exposure on creatinine levels. The prepubertal androgenized rats (A2) and adult androgenized rats (B2) on a HA-diet, exhibit higher serum creatinine levels, than the respective groups of rats on a LA-diet (A1 and B1). The non-androgenized group does not present any statistically significant difference (C1 and C2).
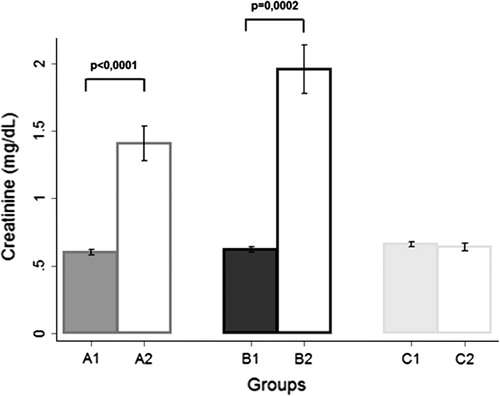
Figure 2 Effect of androgen exposure on CRP levels. The adult androgenized animals (B1 and B2) exhibited higher CRP levels when they were compared with the age-matched adult non-androgenized animals (C1 and C2), either fed with HA- or LA-diet.
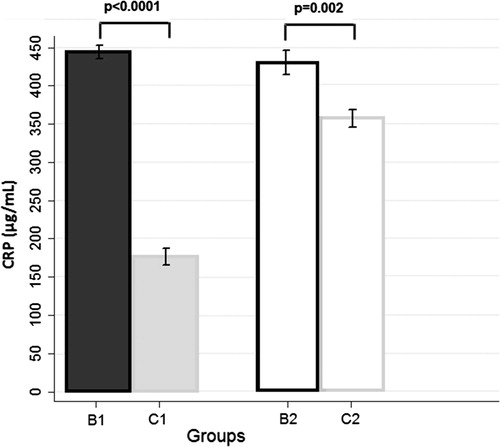
Figure 3 Expression of AGEs in epithelial cells of proximal convoluted tubules. The group of rats fed with HA-diet [(A2) represents the prepubertal androgenized rats, (B2) the androgenized rats and (C2) the adult non-androgenized rats, fed with HA-diet] [exhibit higher AGE immunoreactivity than the respective animals fed with LA-diet [(A1) represents the prepubertal androgenized rats, (B1) the adult androgenized rats and (C1) the adult non-androgenized rats, fed with LA-diet]. Magnification ×100.
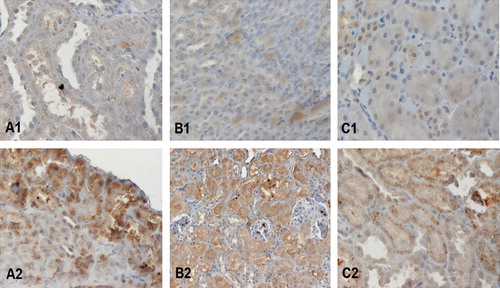
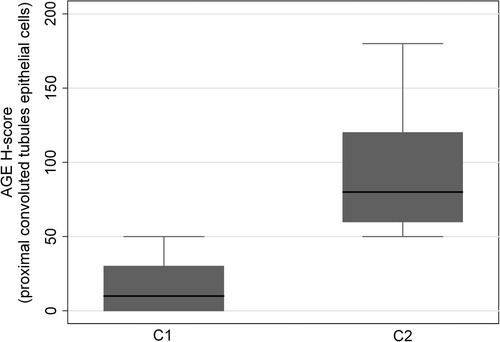
Figure 4 Box plot illustrating the higher AGEs immunoreactivity in C2 group when compared to C1 group (p = 0.0055) in epithelial cells of proximal convoluted tubules.