Figures & data
Figure 3 Effect of EPO and E on scoring of renal tissue damage of all groups. Comparison between mean ± SD of scoring of renal tissue damage of group (I): control group, group II: (RIR group), group III: (RIR + EPO group), group IV: (OVR + RIR group), group V: (OVR + RIR + E group), group VI: (OVR + RIR + EPO group) and group (VII): (OVR + RIR + E + EPO). a = statistically significant compared to the corresponding value in group (I) (p < 0.001). b = statistically significant compared to the corresponding value in group (II) (p < 0.001). c = statistically significant compared to the corresponding value in group (III) (p < 0.001). d = statistically significant compared to the corresponding value in group (IV) (p < 0.001). # = statistically significant compared to the corresponding value in group (V) (p < 0.005). & = statistically significant compared to the corresponding value in group (V) (p < 0.01). @ = statistically significant compared to the corresponding value in group (VI) (p < 0.01).
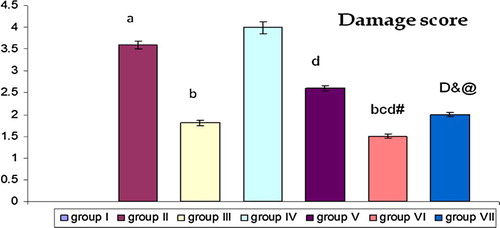
Figure 4 Histological results of all group. (A) A photomicrograph renal sections stained with H & E showed no histopathological changes in kidney of sham operated group. (B) Kidney sections of RIR group showed severe vacuolization and congestion with development of severe necrosis in tubular cells. (C) Kidney sections of RIR + EPO group showed moderate tubular cell vacuolization and necrosis. (D) Kidney sections of RIR + OVR group showed severe vacuolization and congestion with development of severe necrosis in tubular cells. (E) Kidney sections of RIR + OVR + E group showed mild vacuolization and congestion with mild necrosis in tubular cells. (F) Kidney sections of RIR + OVR + EPO group showed mild vacuolization and congestion with mild necrosis in tubular cells. (G) Kidney sections of RIR + OVR + E + EPO group showed moderate vacuolization and congestion with moderate necrosis in tubular cells (H & E 20×).
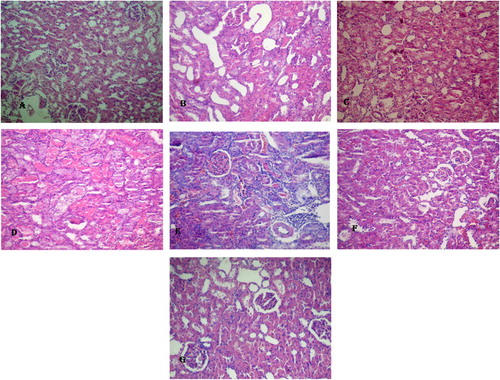
Figure 1 Effect of EPO and E on RBF in all groups. (A): A trace showing RBF of control group. (B) A trace showing RBF of RIR group. (C) A trace showing RBF of RIR + EPO group. (D) A trace showing RBF of OVR + RIR group. (E) A trace showing RBF of OVR + RIR + E group. (F) A trace showing RBF of OVR + RIR + EPO group. (G) A trace showing RBF of OVR + RIR + E + EPO group.
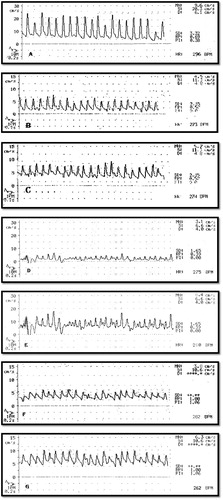
Table 1 Comparison between mean ± SD of serum creatinine (mg/dl), blood urea nitrogen (BUN) (mg/dl) and RBF cm/s in group (I): control group, group II: (RIR group), group III: (EPO + RIR group), group IV: (OVR + RIR group), group V: (OVR + RIR + E group), group VI: (OVR + RIR + EPO group) and group (VII): (OVR + RIR + E + EPO group).
Table 2 Comparison between mean ± SD NO (nmol/l), ET-1(ng/g) and EPO (Iu/l) levels in renal tissue of group (I): control group, group II: (RIR group), group III: (RIR + EPO group), group IV: (OVR + RIR group), group V: (OVR + RIR + E group), group VI: (OVR + RIR + EPO group) and group (VII): (OVR + RIR + E + EPO group).
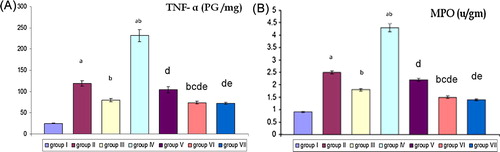
Figure 2 Effect of EPO and E on TNF-α (pg /mg) and MPO (u/gm) levels in renal tissue of all groups. (A and B) Comparison between mean ± SD of TNF-α (PG/mg) and MPO (u/gm) levels in renal tissue of group (I): control group, group II: (RIR group), group III: (RIR + EPO group), group IV: (OVR + RIR group), group V: (OVR + RIR + E group), group VI: (OVR + RIR + EPO group) and group (VII): (OVR + RIR + E + EPO). a = statistically significant compared to the corresponding value in group (I) (p < 0.001). b = statistically significant compared to the corresponding value in group (II) (p < 0.001). c = statistically significant compared to the corresponding value in group (III) (p < 0.001). d = statistically significant compared to the corresponding value in group (IV) (p < 0.001). e = statistically significant compared to the corresponding value in group (V) (p < 0.001).