Figures & data
Figure 1 Gel electrophoresis of PCR products. Lanes 1–4 show the 417 bp band of MRP-1, while lanes 5–8 show the 244 bp band of GST-Pi and the 100 bp band of β-actin.
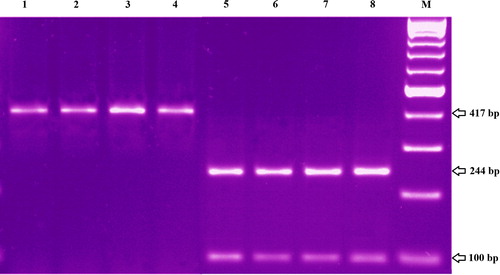
Table 1 Mean ± standard error (M ± SE) of all hematological parameters in control group, AML patients, complete remission group and UR group.
Table 2 Number and percent of AML patients with positive GST-Pi and MRP-1 expression and comparisons of groups and subgroups.
Figure 2 The percent positivity of both GST-Pi and MRP-1 in CR and UR groups through all study points.
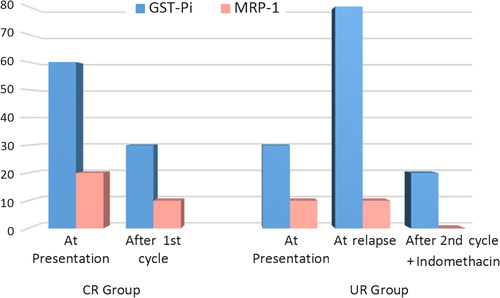
Figure 3 Disease free survival according to (a) GST-Pi and (b) MRP-1 expression and overall survival according to (c) GST-Pi and (d) MRP-1 expression in AML patients.
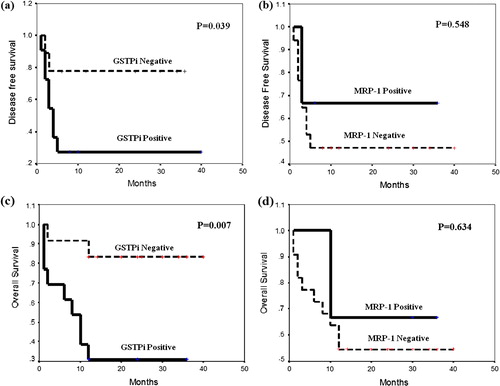
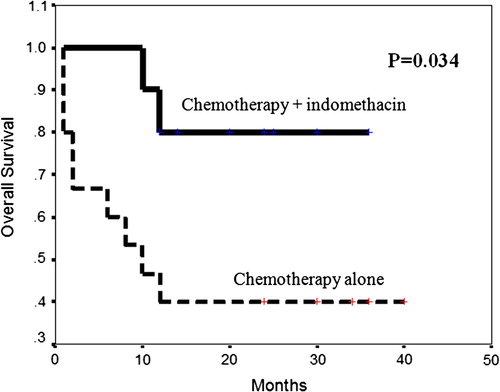
Figure 4 Overall survival according to chemotherapy with and without indomethacin in all patients with AML.