Figures & data
Figure 1 Hypoglycemic effect of Musa species on normoglycemic rats. Values are statistically significant at p < 0.05. Significance determined by ANOVA followed by Dunnett’s test.
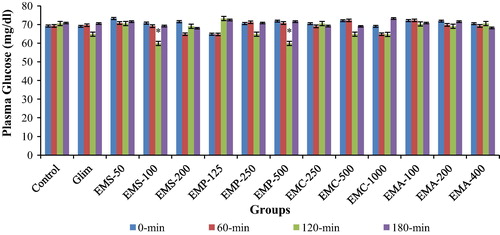
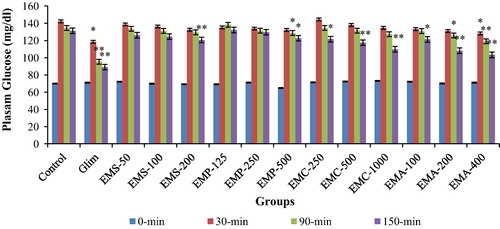
Figure 2 Effect of Musa species on glucose loaded normoglycemic rats. Values are statistically significant at p < 0.05. Significance determined by ANOVA followed by Dunnett’s test.