Figures & data
Figure 1 Selection of the appropriate CE dose. Effect of different doses of CE on uterine wet weight in VCD-treated rats. Data are represented as mean ± SD, of 10 rats in each group. Significance was considered at level of P < 0.05. *Significantly different from normal control group. #Significantly different from vehicle – treated VCD group. @Significantly different from E2 treated group.
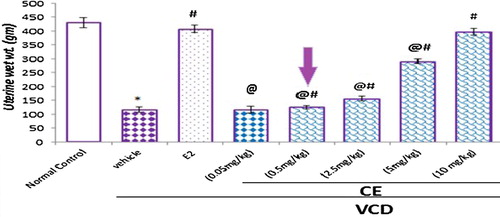
Figure 2 Selection of the minimum fully antagonist RLX dose. Effect of different RLX doses on estrogen stimulated uterine weight. Data are represented as mean ± SD, of 10 rats in each group. Significance was considered at level of P < 0.05. *Significantly different from normal control group. #Significantly different from vehicle – treated VCD group. @Significantly different from E2 – treated VCD group. Significantly different from CE- treated VCD group.
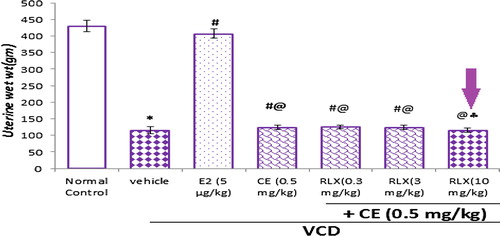
Figure 3 Serum markers of bone formation in all studied groups. Data are represented as mean ± SD, of 10 rats in each group. Significance was considered at level of P < 0.05. *Significantly different from normal control group. #Significantly different from vehicle – treated VCD group. °Significantly different from E2 – treated VCD group.
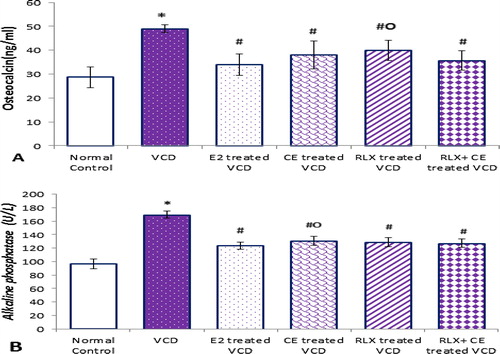
Figure 4 Bone resorping parameters in all studied groups. Data are represented as mean ± SD, of 10 rats in each group. Significance was considered at level of P < 0.05. *Significantly different from normal control group. #Significantly different from vehicle – treated VCD group.
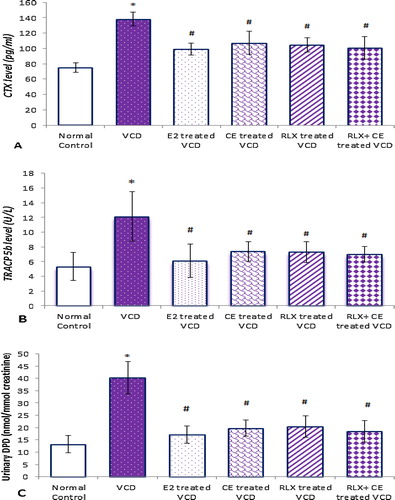
Figure 5 The uterine parameters in all studied groups. Data are represented as mean ± SD, of 10 rats in each group. Significance was considered at level of P < 0.05. *Significantly different from normal control group. #Significantly different from vehicle – treated VCD group. °Significantly different from E2 – treated VCD group.
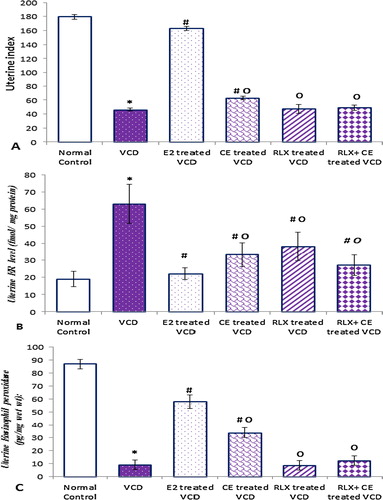
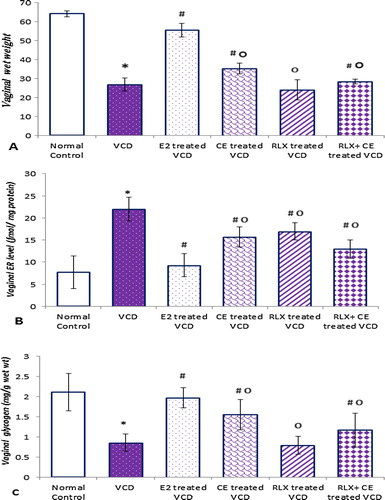
Figure 6 The vaginal parameters in all studied groups. Data are represented as mean ± SD, of 10 rats in each group. Significance was considered at level of P < 0.05. *Significantly different from normal control group. #Significantly different from vehicle – treated VCD group. °Significantly different from E2 – treated VCD group.