Figures & data
Table 1 Table of total antioxidant capacity, total phenolic and flavonoid content.
Table 2 Free radical scavenging, nitric oxide inhibition and ferric ion reducing power activity of SM and CA.
Table 3 Effect of SM and CA on spontaneous locomotor activity.
Figure 1 Effect of (A) SM or (B) CA on spontaneous alternation behaviour in scopolamine-treated mice in the Y-maze test. Values are expressed as mean ± SEM (n = 6), ∗∗P < 0.01; ∗∗∗P < 0.001 versus vehicle-treated; aP < 0.05; bP < 0.01; cP < 0.05 versus scopolamine-treated group (one-way ANOVA followed by Tukey post hoc multiple comparison test).
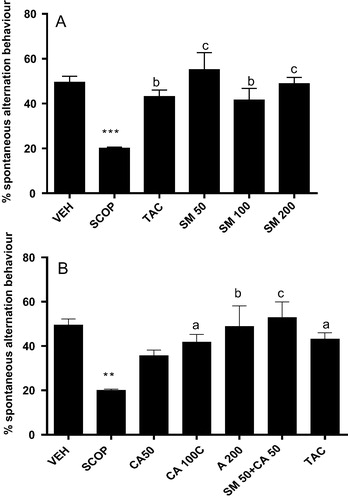
Figure 2 Effect of (A) SM and (B) CA on total number of arm entries in scopolamine-treated mice in the Y-maze. Values are expressed as mean ± SEM (n = 6).
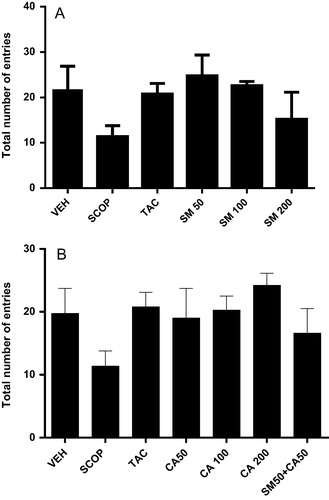
Figure 3 Effect of (A) SM and (B) CA on spatial learning following scopolamine-induced memory impairment in the Morris water maze test in rats. Values are expressed as mean ELT (s) ± S.E.M (n = 6). aP < 0.05, bP < 0.01, cP < 0.001 versus session 1 (two-way ANOVA followed by Tukey post hoc multiple comparison test).
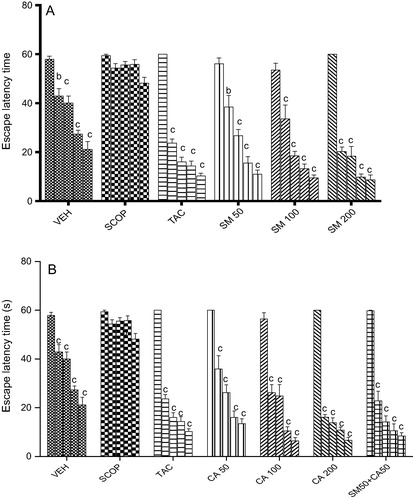
Figure 4 Effect of SM and CA on MDA levels in the (A) prefrontal cortex, (B) hippocampus and (C) striatum of scopolamine-treated rats after the MWM task. Values are expressed as Mean ± SEM (n = 6). ∗∗P < 0.01, ∗∗∗P < 0.001 versus vehicle-treated control, aP < 0.05, bP < 0.01, cP < 0.001 versus vehicle + scopolamine treated (one-way ANOVA followed by Tukey post hoc multiple comparison test).
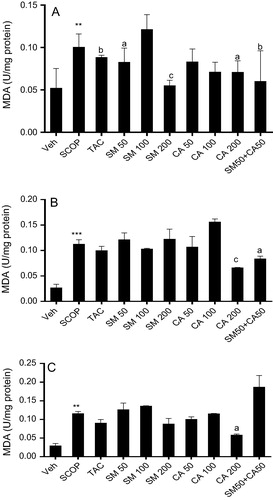
Figure 5 Effect of SM and CA on GSH level in the (A) prefrontal cortex, (B) hippocampus and (C) striatum of scopolamine-treated rats after the MWM task. Values are expressed as mean ± SEM (n = 6). ∗P < 0.05, ∗∗P < 0.01 versus vehicle-treated control, aP < 0.05, bP < 0.01, cP < 0.001 versus vehicle + scopolamine treated (one-way ANOVA followed by Tukey post hoc multiple comparison test).
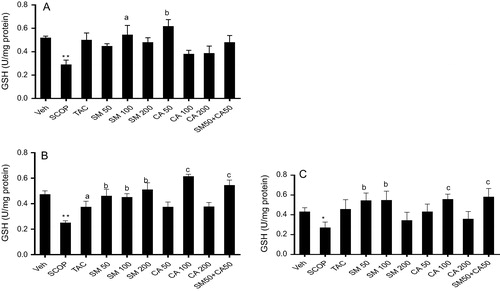
Figure 6 Effect of SM and CA on catalase level in the (A) prefrontal cortex, (B) hippocampus and (C) striatum of scopolamine-treated rats after the MWM task. Values are expressed as mean ± SEM (n = 6). ∗∗P < 0.01, ∗∗∗P < 0.001 versus vehicle-treated control, aP < 0.05, bP < 0.01, cP < 0.001 versus vehicle + scopolamine treated (one-way ANOVA followed by Tukey post hoc multiple comparison test).
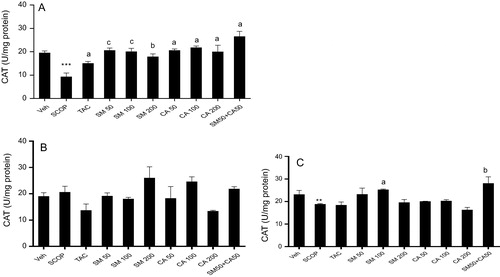
Figure 7 Effect of SM and CA on SOD activity in the (A) prefrontal cortex, (B) hippocampus and (C) striatum of scopolamine-treated rats after the MWM task. Values are expressed as mean ± SEM (n = 6). ∗∗P < 0.01 versus vehicle-treated control, aP < 0.05, bP < 0.01, cP < 0.001 versus vehicle + scopolamine treated (one-way ANOVA followed by Tukey post hoc multiple comparison test).
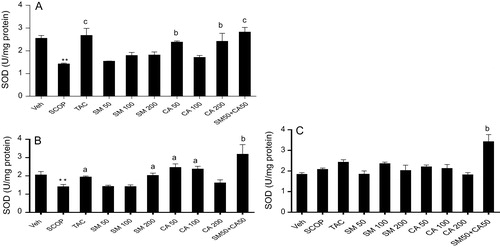
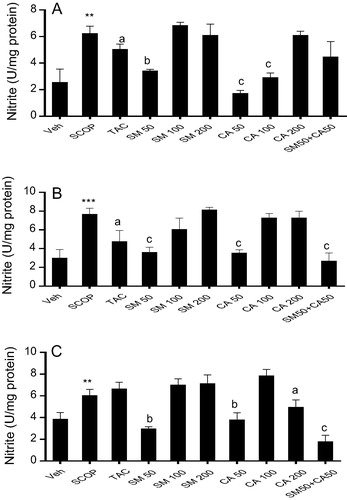
Figure 8 Effect of SM and CA on nitrite level in the (A) prefrontal cortex, (B) hippocampus and (C) striatum of scopolamine-treated rats after the MWM task. Values are expressed as mean ± SEM (n = 6). ∗∗P < 0.01; ∗∗∗P < 0.01 versus vehicle-treated control, aP < 0.05; bP < 0.01; cP < 0.001 versus vehicle + scopolamine treated (one-way ANOVA followed by Tukey post hoc multiple comparison test).